Races in Lochmoor Waterway Estates, Florida (FL) Detailed Stats
Data:
Races - White alone (%)
Races - White alone (% change since 2000)
Races - Black alone (%)
Races - Black alone (% change since 2000)
Races - American Indian alone (%)
Races - American Indian alone (% change since 2000)
Races - Asian alone (%)
Races - Asian alone (% change since 2000)
Races - Hispanic (%)
Races - Hispanic (% change since 2000)
Races - Native Hawaiian and Other Pacific Islander alone (%)
Races - Native Hawaiian and Other Pacific Islander alone (% change since 2000)
Races - Two or more races(%)
Races - Two or more races(% change since 2000)
Races - Other race alone (%)
Races - Other race alone (% change since 2000)
Racial diversity
Place of birth - Born in state of residence (%)
Place of birth - Born in state of residence (%) - White
Place of birth - Born in state of residence (%) - Black or African American
Place of birth - Born in state of residence (%) - Asian
Place of birth - Born in state of residence (%) - Hispanic or Latino
Place of birth - Born in state of residence (%) - American Indian and Alaska Native
Place of birth - Born in state of residence (%) - Multirace
Place of birth - Born in state of residence (%) - Other Race
Place of birth - Born in other state (%)
Place of birth - Born in other state (%) - White
Place of birth - Born in other state (%) - Black or African American
Place of birth - Born in other state (%) - Asian
Place of birth - Born in other state (%) - Hispanic or Latino
Place of birth - Born in other state (%) - American Indian and Alaska Native
Place of birth - Born in other state (%) - Multirace
Place of birth - Born in other state (%) - Other Race
Place of birth - Native, outside of US (%)
Place of birth - Native, outside of US (%) - White
Place of birth - Native, outside of US (%) - Black or African American
Place of birth - Native, outside of US (%) - Asian
Place of birth - Native, outside of US (%) - Hispanic or Latino
Place of birth - Native, outside of US (%) - American Indian and Alaska Native
Place of birth - Native, outside of US (%) - Multirace
Place of birth - Native, outside of US (%) - Other Race
Place of birth - Foreign born (%)
Place of birth - Foreign born (%) - White
Place of birth - Foreign born (%) - Black or African American
Place of birth - Foreign born (%) - Asian
Place of birth - Foreign born (%) - Hispanic or Latino
Place of birth - Foreign born (%) - American Indian and Alaska Native
Place of birth - Foreign born (%) - Multirace
Place of birth - Foreign born (%) - Other Race
Residents speaking English at home (%)
Residents speaking English at home - Born in the United States (%)
Residents speaking English at home - Native, born elsewhere (%)
Residents speaking English at home - Foreign born (%)
Residents speaking Spanish at home (%)
Residents speaking Spanish at home - Born in the United States (%)
Residents speaking Spanish at home - Native, born elsewhere (%)
Residents speaking Spanish at home - Foreign born (%)
Residents speaking other language at home (%)
Residents speaking other language at home - Born in the United States (%)
Residents speaking other language at home - Native, born elsewhere (%)
Residents speaking other language at home - Foreign born (%)
Marital status - Never married (%)
Marital status - Now married (%)
Marital status - Separated (%)
Marital status - Widowed (%)
Marital status - Divorced (%)
Ancestries Reported - Arab (%)
Ancestries Reported - Czech (%)
Ancestries Reported - Danish (%)
Ancestries Reported - Dutch (%)
Ancestries Reported - English (%)
Ancestries Reported - French (%)
Ancestries Reported - French Canadian (%)
Ancestries Reported - German (%)
Ancestries Reported - Greek (%)
Ancestries Reported - Hungarian (%)
Ancestries Reported - Irish (%)
Ancestries Reported - Italian (%)
Ancestries Reported - Lithuanian (%)
Ancestries Reported - Norwegian (%)
Ancestries Reported - Polish (%)
Ancestries Reported - Portuguese (%)
Ancestries Reported - Russian (%)
Ancestries Reported - Scotch-Irish (%)
Ancestries Reported - Scottish (%)
Ancestries Reported - Slovak (%)
Ancestries Reported - Subsaharan African (%)
Ancestries Reported - Swedish (%)
Ancestries Reported - Swiss (%)
Ancestries Reported - Ukrainian (%)
Ancestries Reported - United States (%)
Ancestries Reported - Welsh (%)
Ancestries Reported - West Indian (%)
Ancestries Reported - Other (%)
Geographical mobility - Same house 1 year ago (%)
Geographical mobility - Same house 1 year ago (%) - White
Geographical mobility - Same house 1 year ago (%) - Black or African American
Geographical mobility - Same house 1 year ago (%) - Asian
Geographical mobility - Same house 1 year ago (%) - Hispanic or Latino
Geographical mobility - Same house 1 year ago (%) - American Indian and Alaska Native
Geographical mobility - Same house 1 year ago (%) - Multirace
Geographical mobility - Same house 1 year ago (%) - Other Race
Geographical mobility - Moved within same county (%)
Geographical mobility - Moved within same county (%) - White
Geographical mobility - Moved within same county (%) - Black or African American
Geographical mobility - Moved within same county (%) - Asian
Geographical mobility - Moved within same county (%) - Hispanic or Latino
Geographical mobility - Moved within same county (%) - American Indian and Alaska Native
Geographical mobility - Moved within same county (%) - Multirace
Geographical mobility - Moved within same county (%) - Other Race
Geographical mobility - Moved from different county within same state (%)
Geographical mobility - Moved from different county within same state (%) - White
Geographical mobility - Moved from different county within same state (%) - Black or African American
Geographical mobility - Moved from different county within same state (%) - Asian
Geographical mobility - Moved from different county within same state (%) - Hispanic or Latino
Geographical mobility - Moved from different county within same state (%) - American Indian and Alaska Native
Geographical mobility - Moved from different county within same state (%) - Multirace
Geographical mobility - Moved from different county within same state (%) - Other Race
Geographical mobility - Moved from different state (%)
Geographical mobility - Moved from different state (%) - White
Geographical mobility - Moved from different state (%) - Black or African American
Geographical mobility - Moved from different state (%) - Asian
Geographical mobility - Moved from different state (%) - Hispanic or Latino
Geographical mobility - Moved from different state (%) - American Indian and Alaska Native
Geographical mobility - Moved from different state (%) - Multirace
Geographical mobility - Moved from different state (%) - Other Race
Geographical mobility - Moved from abroad (%)
Geographical mobility - Moved from abroad (%) - White
Geographical mobility - Moved from abroad (%) - Black or African American
Geographical mobility - Moved from abroad (%) - Asian
Geographical mobility - Moved from abroad (%) - Hispanic or Latino
Geographical mobility - Moved from abroad (%) - American Indian and Alaska Native
Geographical mobility - Moved from abroad (%) - Multirace
Geographical mobility - Moved from abroad (%) - Other Race
Place of birth for the foreign-born population - Ireland (%)
Place of birth for the foreign-born population - Denmark (%)
Place of birth for the foreign-born population - Norway (%)
Place of birth for the foreign-born population - Sweden (%)
Place of birth for the foreign-born population - United Kingdom (%)
Place of birth for the foreign-born population - England (%)
Place of birth for the foreign-born population - Scotland (%)
Place of birth for the foreign-born population - Other Northern Europe (%)
Place of birth for the foreign-born population - Austria (%)
Place of birth for the foreign-born population - Belgium (%)
Place of birth for the foreign-born population - France (%)
Place of birth for the foreign-born population - Germany (%)
Place of birth for the foreign-born population - Netherlands (%)
Place of birth for the foreign-born population - Switzerland (%)
Place of birth for the foreign-born population - Other Western Europe (%)
Place of birth for the foreign-born population - Greece (%)
Place of birth for the foreign-born population - Italy (%)
Place of birth for the foreign-born population - Portugal (%)
Place of birth for the foreign-born population - Spain (%)
Place of birth for the foreign-born population - Other Southern Europe (%)
Place of birth for the foreign-born population - Albania (%)
Place of birth for the foreign-born population - Belarus (%)
Place of birth for the foreign-born population - Bosnia and Herzegovina (%)
Place of birth for the foreign-born population - Bulgaria (%)
Place of birth for the foreign-born population - Croatia (%)
Place of birth for the foreign-born population - Czechoslovakia (%)
Place of birth for the foreign-born population - Hungary (%)
Place of birth for the foreign-born population - Latvia (%)
Place of birth for the foreign-born population - Lithuania (%)
Place of birth for the foreign-born population - North Macedonia (Macedonia) (%)
Place of birth for the foreign-born population - Moldova (%)
Place of birth for the foreign-born population - Poland (%)
Place of birth for the foreign-born population - Romania (%)
Place of birth for the foreign-born population - Russia (%)
Place of birth for the foreign-born population - Serbia (%)
Place of birth for the foreign-born population - Ukraine (%)
Place of birth for the foreign-born population - Other Eastern Europe (%)
Place of birth for the foreign-born population - China (%)
Place of birth for the foreign-born population - Hong Kong (%)
Place of birth for the foreign-born population - Taiwan (%)
Place of birth for the foreign-born population - Japan (%)
Place of birth for the foreign-born population - Korea (%)
Place of birth for the foreign-born population - Other Eastern Asia (%)
Place of birth for the foreign-born population - Afghanistan (%)
Place of birth for the foreign-born population - Bangladesh (%)
Place of birth for the foreign-born population - India (%)
Place of birth for the foreign-born population - Iran (%)
Place of birth for the foreign-born population - Kazakhstan (%)
Place of birth for the foreign-born population - Nepal (%)
Place of birth for the foreign-born population - Pakistan (%)
Place of birth for the foreign-born population - Sri Lanka (%)
Place of birth for the foreign-born population - Uzbekistan (%)
Place of birth for the foreign-born population - Other South Central Asia (%)
Place of birth for the foreign-born population - Burma (%)
Place of birth for the foreign-born population - Cambodia (%)
Place of birth for the foreign-born population - Indonesia (%)
Place of birth for the foreign-born population - Laos (%)
Place of birth for the foreign-born population - Malaysia (%)
Place of birth for the foreign-born population - Philippines (%)
Place of birth for the foreign-born population - Singapore (%)
Place of birth for the foreign-born population - Thailand (%)
Place of birth for the foreign-born population - Vietnam (%)
Place of birth for the foreign-born population - Other South Eastern Asia (%)
Place of birth for the foreign-born population - Armenia (%)
Place of birth for the foreign-born population - Iraq (%)
Place of birth for the foreign-born population - Israel (%)
Place of birth for the foreign-born population - Jordan (%)
Place of birth for the foreign-born population - Kuwait (%)
Place of birth for the foreign-born population - Lebanon (%)
Place of birth for the foreign-born population - Saudi Arabia (%)
Place of birth for the foreign-born population - Syria (%)
Place of birth for the foreign-born population - Turkey (%)
Place of birth for the foreign-born population - Yemen (%)
Place of birth for the foreign-born population - Other Western Asia (%)
Place of birth for the foreign-born population - Eritrea (%)
Place of birth for the foreign-born population - Ethiopia (%)
Place of birth for the foreign-born population - Kenya (%)
Place of birth for the foreign-born population - Somalia (%)
Place of birth for the foreign-born population - Uganda (%)
Place of birth for the foreign-born population - Zimbabwe (%)
Place of birth for the foreign-born population - Other Eastern Africa (%)
Place of birth for the foreign-born population - Cameroon (%)
Place of birth for the foreign-born population - Congo (%)
Place of birth for the foreign-born population - Democratic Republic of Congo (Zaire) (%)
Place of birth for the foreign-born population - Other Middle Africa (%)
Place of birth for the foreign-born population - Egypt (%)
Place of birth for the foreign-born population - Morocco (%)
Place of birth for the foreign-born population - Sudan (%)
Place of birth for the foreign-born population - Other Northern Africa (%)
Place of birth for the foreign-born population - South Africa (%)
Place of birth for the foreign-born population - Other Southern Africa (%)
Place of birth for the foreign-born population - Cabo Verde (%)
Place of birth for the foreign-born population - Ghana (%)
Place of birth for the foreign-born population - Liberia (%)
Place of birth for the foreign-born population - Nigeria (%)
Place of birth for the foreign-born population - Senegal (%)
Place of birth for the foreign-born population - Sierra Leone (%)
Place of birth for the foreign-born population - Other Western Africa (%)
Place of birth for the foreign-born population - Australia (%)
Place of birth for the foreign-born population - New Zealand (%)
Place of birth for the foreign-born population - Fiji (%)
Place of birth for the foreign-born population - Micronesia (%)
Place of birth for the foreign-born population - Bahamas (%)
Place of birth for the foreign-born population - Barbados (%)
Place of birth for the foreign-born population - Cuba (%)
Place of birth for the foreign-born population - Dominica (%)
Place of birth for the foreign-born population - Dominican Republic (%)
Place of birth for the foreign-born population - Grenada (%)
Place of birth for the foreign-born population - Haiti (%)
Place of birth for the foreign-born population - Jamaica (%)
Place of birth for the foreign-born population - St. Vincent and the Grenadines (%)
Place of birth for the foreign-born population - Trinidad and Tobago (%)
Place of birth for the foreign-born population - West Indies (%)
Place of birth for the foreign-born population - Other Caribbean (%)
Place of birth for the foreign-born population - Belize (%)
Place of birth for the foreign-born population - Costa Rica (%)
Place of birth for the foreign-born population - El Salvador (%)
Place of birth for the foreign-born population - Guatemala (%)
Place of birth for the foreign-born population - Honduras (%)
Place of birth for the foreign-born population - Mexico (%)
Place of birth for the foreign-born population - Nicaragua (%)
Place of birth for the foreign-born population - Panama (%)
Place of birth for the foreign-born population - Other Central America (%)
Place of birth for the foreign-born population - Argentina (%)
Place of birth for the foreign-born population - Bolivia (%)
Place of birth for the foreign-born population - Brazil (%)
Place of birth for the foreign-born population - Chile (%)
Place of birth for the foreign-born population - Colombia (%)
Place of birth for the foreign-born population - Ecuador (%)
Place of birth for the foreign-born population - Guyana (%)
Place of birth for the foreign-born population - Peru (%)
Place of birth for the foreign-born population - Uruguay (%)
Place of birth for the foreign-born population - Venezuela (%)
Place of birth for the foreign-born population - Other South America (%)
Place of birth for the foreign-born population - Canada (%)
Place of birth for the foreign-born population - Other Northern America (%)
Place of birth for the foreign-born population - Other (%)
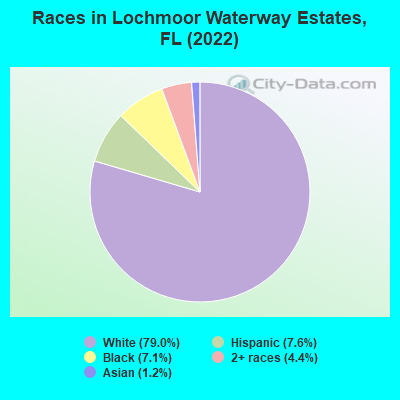
According to 2022 data, the most numerous races in Lochmoor Waterway Estates, FL are White alone (4,475 residents), Hispanic (430 residents), and Black alone (400 residents). 92.1% of Lochmoor Waterway Estates residents speak English at home. 8.3% of Lochmoor Waterway Estates, FL residents are foreign-born (4.3% born in Latin America, 2.8% born in Europe), which is 154.4% less than the foreign-born rate of 21.0% across the entire state of Florida.
Race distribution in Lochmoor Waterway Estates
2000 2022
10,458,509 65.4% White alone 2,682,715 16.8% Hispanic 2,264,268 14.2% Black alone 261,693 1.6% Asian alone 236,954 1.5% Two or more races 42,358 0.3% American Indian alone 28,994 0.2% Other race alone 6,887 0.04% Native Hawaiian and Other
11,309,403 50.8% White alone 6,025,039 27.1% Hispanic 3,241,015 14.6% Black alone 861,630 3.9% Two or more races 623,692 2.8% Asian alone 152,054 0.7% Other race alone 22,504 0.1% American Indian alone 9,486 0.04% Native Hawaiian and Other
Income and house value in Lochmoor Waterway Estates Median household income in 2022 $82,854 White non-Hispanic householders$80,927 Black householders$99,106 Two or more races householdersMedian 2022 house value $394,837 White Non-Hispanic householders$235,958 American Indian or Alaska Native householders $235,958 Asian householders$267,419 Some other race householders$263,644 Hispanic or Latino householders
Median age by race in Lochmoor Waterway Estates
61.9 Median age for White residents62.2 61.5 27.9 Median age for Black or African American residents22.0 30.3 -562,189,054.2 Median age for American Indian / Alaska Native residents-558,080,807.5 -402,449,693.4 44.9 Median age for Asian residents23.6 -628,178,693.5 -1,092,290,987.0 Median age for Native Hawaiian / Pacific Islander residents-858,307,848.3 -800,880,087.2 49.2 Median age for Other race residents44.7 88.2 59.6 Median age for Two or more races residents55.1 64.4 60.3 Median age for White alone residents59.6 60.7 39.6 Median age for Hispanic or Latino residents45.0 36.9
Owner/renter occupied households by race in Lochmoor Waterway Estates
House owners and renters - White residents 1,953 89.4% Owner occupied232 10.6% Renter occupiedHouse owners and renters - Black or African American residents 63 58.0% Owner occupied45 42.0% Renter occupiedHouse owners and renters - Asian residents 18 65.4% Owner occupied10 34.6% Renter occupiedHouse owners and renters - Other race residents 14 100.0% Renter occupiedHouse owners and renters - Two or more races residents 268 81.9% Owner occupied59 18.1% Renter occupiedHouse owners and renters - White alone residents 2,009 89.5% Owner occupied236 10.5% Renter occupiedHouse owners and renters - Hispanic or Latino residents 98 56.1% Owner occupied77 43.9% Renter occupied
Language usage in Lochmoor Waterway Estates
English speakers - Total 92.1% of residents of Lochmoor Waterway Estates speak English at home.
3.5% of residents speak Spanish at home 72 36.9% Speak English very well123 63.1% Speak English less than very well2.7% of residents speak other language at home 107 70.4% Speak English very well45 29.6% Speak English less than very well
English speakers - Born in the United States 98.4% of residents of Lochmoor Waterway Estates speak English at home.
1.0% of residents speak other language at home 36 100.0% Speak English very well
English speakers - Native, born elsewhere 88.1% of residents of Lochmoor Waterway Estates speak English at home.
English speakers - Foreign-born 52.8% of residents of Lochmoor Waterway Estates speak English at home.
25.2% of residents speak Spanish at home 18 14.0% Speak English very well111 86.0% Speak English less than very well23.7% of residents speak other language at home 72 59.5% Speak English very well49 40.5% Speak English less than very well
White (Caucasian) - Speak only English Native:
100.0% (4,149)Foreign-born:
90.6% (132)
White (Caucasian) - Speak another language Native:
0.6% (26)Foreign-born:
30.7% (45)
Black or African American - Speak only English Native:
97.8% (246)Foreign-born:
74.4% (90)
Asian - Speak only English Native:
100.0% (62)Foreign-born:
100.0% (10)
Other race - Speak only English Native:
45.1% (17)Foreign-born:
65.1% (13)
Other race - Speak another language Native:
51.1% (19)Foreign-born:
35.0% (7)
Two or more races - Speak only English Native:
73.4% (366)Foreign-born:
8.9% (16)
Two or more races - Speak another language Native:
12.2% (61)Foreign-born:
91.1% (169)
White alone - Speak only English Native:
99.3% (4,201)Foreign-born:
67.5% (142)
White alone - Speak another language Native:
0.7% (30)Foreign-born:
33.5% (71)
Hispanic or Latino - Speak only English Native:
68.7% (191)Foreign-born:
15.2% (23)
Hispanic or Latino - Speak another language Native:
24.8% (69)Foreign-born:
83.8% (126)
Foreign-born residents in Lochmoor Waterway Estates 468 residents are foreign born (4.3% Latin America , 2.8% Europe ).
This city:
8.3%Florida:
21.1%
Marital status for residents in Lochmoor Waterway Estates Marital status - White (Caucasian) population 15 years and over
Males 20.6% Never married61.7% Now married2.0% Separated4.8% Widowed10.9% DivorcedFemales 12.4% Never married54.2% Now married1.0% Separated15.5% Widowed16.8% DivorcedWomen who did not give birth in the past 12 months Now married:
51.3% (292)Unmarried:
48.7% (277)
Marital status - Black or African American population 15 years and over
Males 49.4% Never married26.6% Now married0.0% Separated24.1% Widowed0.0% DivorcedFemales 80.1% Never married14.3% Now married0.0% Separated5.6% Widowed0.0% DivorcedWomen who did not give birth in the past 12 months Now married:
19.0% (29)Unmarried:
81.0% (124)
Marital status - Asian population 15 years and over
Males 60.5% Never married18.6% Now married0.0% Separated0.0% Widowed20.9% DivorcedFemales 0.0% Never married0.0% Now married47.1% Separated0.0% Widowed52.9% DivorcedMarital status - Other race population 15 years and over
Males 52.6% Never married47.4% Now married0.0% Separated0.0% Widowed0.0% DivorcedFemales 0.0% Never married28.0% Now married0.0% Separated52.0% Widowed20.0% DivorcedMarital status - Two or more races population 15 years and over
Males 13.4% Never married44.4% Now married0.0% Separated0.0% Widowed42.3% DivorcedFemales 7.6% Never married67.6% Now married0.0% Separated5.2% Widowed19.5% DivorcedWomen who did not give birth in the past 12 months Now married:
67.3% (59)Unmarried:
32.7% (28)
Marital status - White alone, not Hispanic / Latino population 15 years and over
Males 20.1% Never married62.0% Now married2.0% Separated4.8% Widowed11.1% DivorcedFemales 12.7% Never married53.3% Now married1.1% Separated15.8% Widowed17.2% DivorcedWomen who did not give birth in the past 12 months Now married:
48.9% (297)Unmarried:
51.1% (310)
Marital status - Hispanic or Latino population 15 years and over
Males 25.7% Never married59.7% Now married0.0% Separated0.0% Widowed14.6% DivorcedFemales 9.2% Never married51.1% Now married0.0% Separated13.2% Widowed26.4% DivorcedWomen who did not give birth in the past 12 months Now married:
79.7% (70)Unmarried:
20.3% (18)
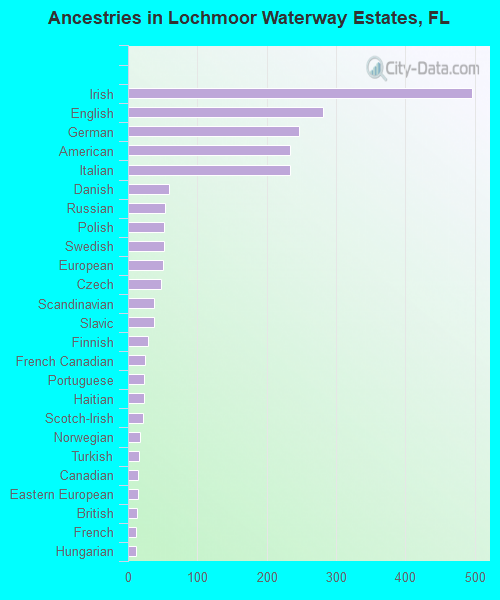
Ancestries in Lochmoor Waterway Estates
496 18.7% Irish281 10.6% English247 9.3% German234 8.8% American233 8.8% Italian59 2.2% Danish53 2.0% Russian52 2.0% Polish52 2.0% Swedish50 1.9% European48 1.8% Czech37 1.4% Scandinavian37 1.4% Slavic29 1.1% Finnish25 0.9% French Canadian23 0.9% Portuguese23 0.9% Haitian21 0.8% Scotch-Irish18 0.7% Norwegian16 0.6% Turkish14 0.5% Canadian14 0.5% Eastern European13 0.5% British12 0.5% French12 0.5% Hungarian10 0.4% Austrian8 0.3% Dutch7 0.3% Brazilian
Children Nativity (place of birth) in Lochmoor Waterway Estates
Children under 6 years - Living with two parents Both parents native 15 100.0% NativeBoth parents foreign-born 31 100.0% NativeChildren under 6 years - Living with one parent Native parent 74 100.0% Native
Children 6 to 17 years - Living with two parents Both parents native 323 100.0% NativeOne native, one foreign-born parent 12 100.0% NativeChildren 6 to 17 years - Living with one parent Native parent 261 100.0% Native