Races in Little Falls, Wisconsin (WI) Detailed Stats
Ancestries, Foreign-born residents, place of birth

Recent posts about races in Little Falls, Wisconsin on our local forum with over 2,400,000 registered users:
 | Little Falls Wisconsin...Stone House...? (5 replies) |
1.6% of Little Falls, WI residents are foreign-born , which is 217.6% less than the foreign-born rate of 5.0% across the entire state of Wisconsin.
Race distribution in Little Falls

- 1,30597.8%White alone
- 131.0%Two or more races
- 80.6%Hispanic
- 40.3%Asian alone
- 20.1%American Indian alone
- 10.07%Black alone
- 10.07%Native Hawaiian and Other
Pacific Islander alone

2000
2022
-
- 4,681,63087.3%White alone
- 300,2455.6%Black alone
- 192,9213.6%Hispanic
- 87,9951.6%Asian alone
- 51,9211.0%Two or more races
- 43,9800.8%American Indian alone
- 3,6370.07%Other race alone
- 1,3460.03%Native Hawaiian and Other
Pacific Islander alone

-
- 4,654,03179.0%White alone
- 447,0227.6%Hispanic
- 345,6785.9%Black alone
- 217,5323.7%Two or more races
- 172,2422.9%Asian alone
- 33,7620.6%American Indian alone
- 19,6800.3%Other race alone
- 2,5920.04%Native Hawaiian and Other
Pacific Islander alone

Income and house value in Little Falls
- Median household income in 2022
- $61,071White non-Hispanic householders
- $127,582Two or more races householders
- Median 2022 house value
- $151,586White Non-Hispanic householders
Household income for White non-Hispanic householders

Household income for Two or more races householders

Foreign-born residents in Little Falls
21 residents are foreign born
| This city: | 1.6% |
| Wisconsin: | 3.6% |
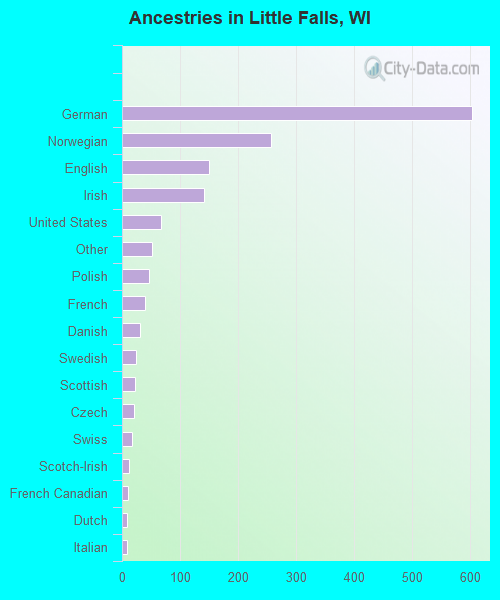
Ancestries in Little Falls

- 60339.7%German
- 25716.9%Norwegian
- 1509.9%English
- 1419.3%Irish
- 684.5%United States
- 513.4%Other
- 473.1%Polish
- 392.6%French
- 312.0%Danish
- 241.6%Swedish
- 231.5%Scottish
- 211.4%Czech
- 181.2%Swiss
- 120.8%Scotch-Irish
- 100.7%French Canadian
- 80.5%Dutch
- 80.5%Italian
- 50.3%Welsh
- 20.1%Hungarian
- 20.1%Slovak
Zip codes: 54656.