Races in Lithia Springs, Georgia (GA) Detailed Stats
Ancestries, Foreign-born residents, place of birth
Settings
X


Recent posts about races in Lithia Springs, Georgia on our local forum with over 2,400,000 registered users:
 | Considering Atlanta move (Lithia Springs,etc.) (31 replies) |
| Blue Geogia (219 replies) |
| Atlanta's traffic mess (164 replies) |
| Silver Springs Village, Powder Springs Ga. (1 reply) |
| Median Home Sale Price by High School District in Metro Atlanta - Past 90 Days (28 replies) |
| Douglasville vs Dallas (9 replies) |
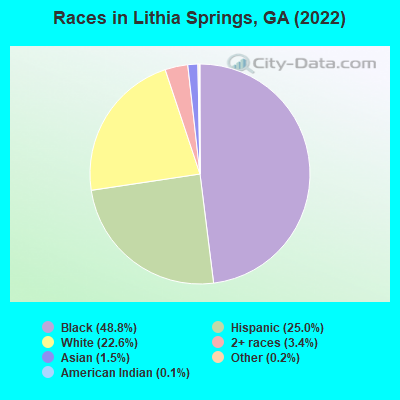
According to 2022 data, the most numerous races in Lithia Springs, GA are White alone (3,681 residents), Black alone (7,954 residents), and Hispanic (4,071 residents). 69.7% of Lithia Springs residents speak English at home. 21.7% of Lithia Springs, GA residents are foreign-born (16.0% born in Latin America, 3.8% born in Africa), which is 54.0% greater than the foreign-born rate of 10.0% across the entire state of Georgia.
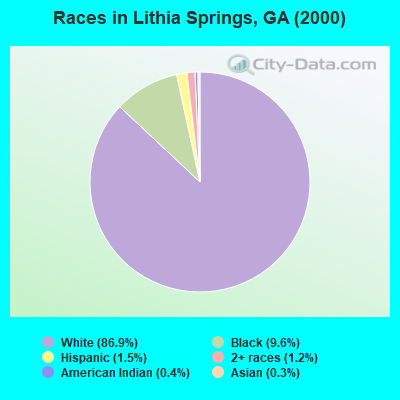
Race distribution in Lithia Springs
2000
2022

- 1,80086.9%White alone
- 1999.6%Black alone
- 321.5%Hispanic
- 251.2%Two or more races
- 90.4%American Indian alone
- 60.3%Asian alone
- 10.05%Native Hawaiian and Other
Pacific Islander alone
-
- 7,95448.8%Black alone
- 4,07125.0%Hispanic
- 3,68122.6%White alone
- 5523.4%Two or more races
- 2471.5%Asian alone
- 390.2%Other race alone
- 190.1%American Indian alone
2000
2022
-
- 5,128,66162.6%White alone
- 2,331,46528.5%Black alone
- 435,2275.3%Hispanic
- 171,5132.1%Asian alone
- 87,3641.1%Two or more races
- 17,6700.2%American Indian alone
- 11,2750.1%Other race alone
- 3,2780.04%Native Hawaiian and Other
Pacific Islander alone

-
- 5,415,65749.6%White alone
- 3,349,24030.7%Black alone
- 1,132,60410.4%Hispanic
- 479,1564.4%Asian alone
- 462,9234.2%Two or more races
- 54,4160.5%Other race alone
- 11,9230.1%American Indian alone
- 6,9570.06%Native Hawaiian and Other
Pacific Islander alone

Income and house value in Lithia Springs
- Median household income in 2022
- $59,433White non-Hispanic householders
- $56,227Black householders
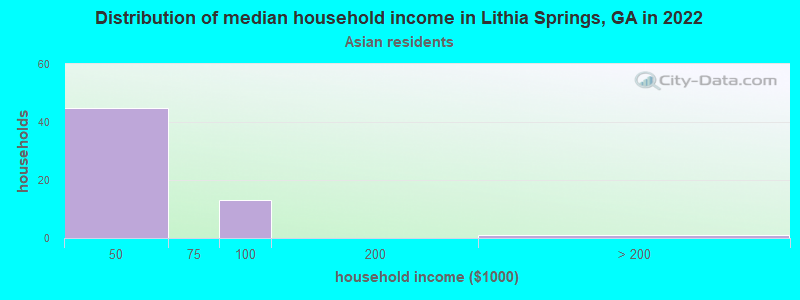
- $41,181Asian householders
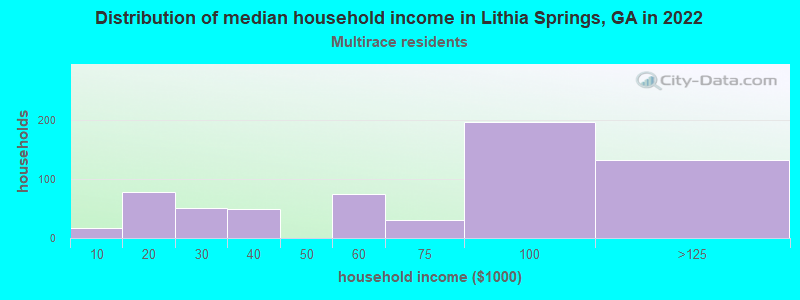
- $80,608Two or more races householders
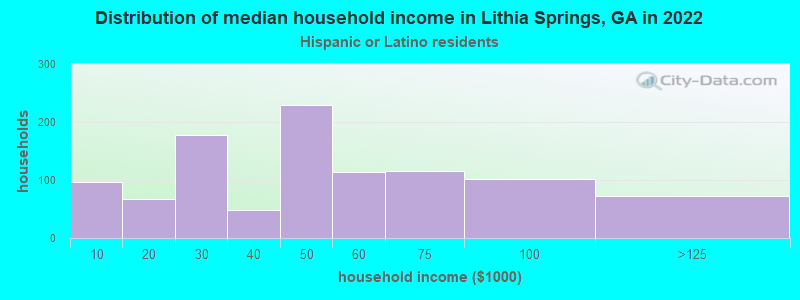
- $48,268Hispanic or Latino race householders
- Median 2022 house value
- $227,277White Non-Hispanic householders
- $191,048Black or African American householders
- $318,414American Indian or Alaska Native householders
- $318,414Some other race householders
- $268,883Two or more races householders
- $318,414Hispanic or Latino householders
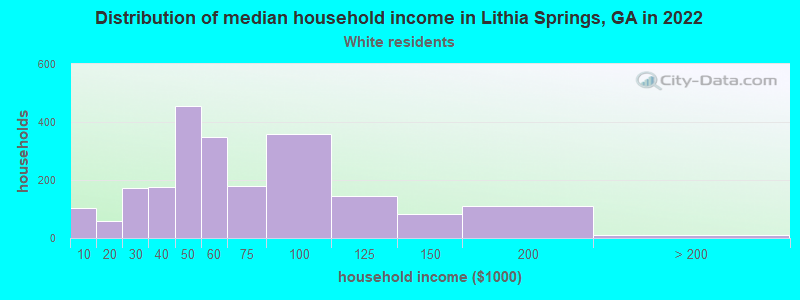
Household income for White non-Hispanic householders
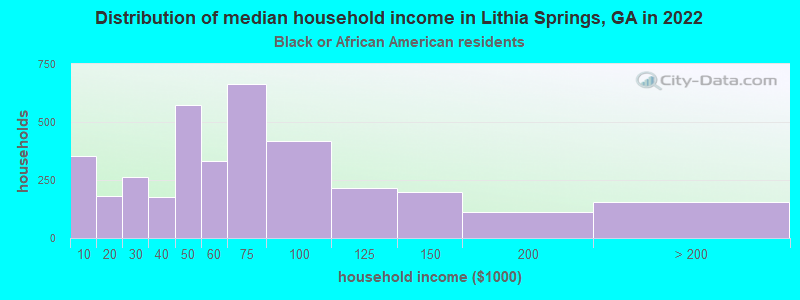
Household income for Black householders
Household income for Asian householders
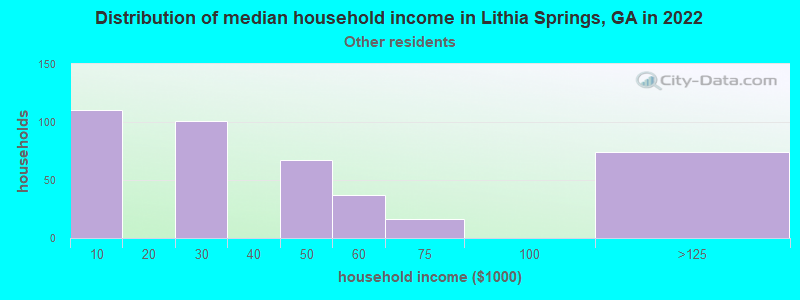
Household income for Some other race householders
Household income for Two or more races householders
Household income for Hispanic or Latino race householders
Median age by race in Lithia Springs
- 40.7Median age for White residents
- 39.1Males
- 40.0Females
- 33.2Median age for Black or African American residents
- 30.5Males
- 34.1Females
- -666,666,666.0Median age for American Indian / Alaska Native residents
- -1,058,165,547.0Males
- -597,938,143.7Females
- 27.7Median age for Asian residents
- 40.7Males
- 30.3Females
- -666,666,666.0Median age for Native Hawaiian / Pacific Islander residents
- -666,666,666.0Males
- -666,666,666.0Females
- 19.2Median age for Other race residents
- 27.1Males
- 14.7Females
- 17.2Median age for Two or more races residents
- 18.8Males
- 19.0Females
- 44.4Median age for White alone residents
- 47.3Males
- 44.6Females
- 18.7Median age for Hispanic or Latino residents
- 23.0Males
- 17.7Females
Owner/renter occupied households by race in Lithia Springs
- House owners and renters - White residents
- 1,35369.1%Owner occupied
- 60430.9%Renter occupied
- House owners and renters - Black or African American residents
- 1,22932.8%Owner occupied
- 2,51467.2%Renter occupied
- House owners and renters - Asian residents
- 3845.9%Owner occupied
- 4554.1%Renter occupied
- House owners and renters - Other race residents
- 13724.7%Owner occupied
- 41775.3%Renter occupied
- House owners and renters - Two or more races residents
- 48283.5%Owner occupied
- 9516.5%Renter occupied
- House owners and renters - White alone residents
- 1,18269.0%Owner occupied
- 53131.0%Renter occupied
- House owners and renters - Hispanic or Latino residents
- 58855.6%Owner occupied
- 47044.4%Renter occupied
Language usage in Lithia Springs
- English speakers - Total
- 69.7% of residents of Lithia Springs speak English at home.
- 23.7% of residents speak Spanish at home
- 2,04656.0%Speak English very well
- 1,61044.0%Speak English less than very well
- 7.3% of residents speak other language at home
- 92381.4%Speak English very well
- 21118.6%Speak English less than very well
- English speakers - Born in the United States
- 97.6% of residents of Lithia Springs speak English at home.
- 1.3% of residents speak Spanish at home
- 4151.9%Speak English very well
- 3848.1%Speak English less than very well
- 1.5% of residents speak other language at home
- 8187.1%Speak English very well
- 1212.9%Speak English less than very well
- English speakers - Native, born elsewhere
- 46.5% of residents of Lithia Springs speak English at home.
- English speakers - Foreign-born
- 13.9% of residents of Lithia Springs speak English at home.
- 62.1% of residents speak Spanish at home
- 45820.5%Speak English very well
- 1,77879.5%Speak English less than very well
- 25.0% of residents speak other language at home
- 69777.4%Speak English very well
- 20422.6%Speak English less than very well
White (Caucasian) - Speak another language
| Native: | 11.8% (502) |
| Foreign-born: | 89.1% (526) |
Black or African American - Speak only English
| Native: | 99.2% (6,479) |
| Foreign-born: | 40.1% (488) |
Black or African American - Speak another language
| Native: | 1.2% (80) |
| Foreign-born: | 59.9% (729) |
Other race - Speak another language
| Native: | 82.2% (383) |
| Foreign-born: | 100.0% (1,022) |
Two or more races - Speak another language
| Native: | 74.9% (949) |
| Foreign-born: | 92.1% (911) |
White alone - Speak another language
| Native: | 5.1% (181) |
| Foreign-born: | 100.0% (26) |
Hispanic or Latino - Speak another language
| Native: | 88.1% (1,364) |
| Foreign-born: | 100.0% (2,258) |
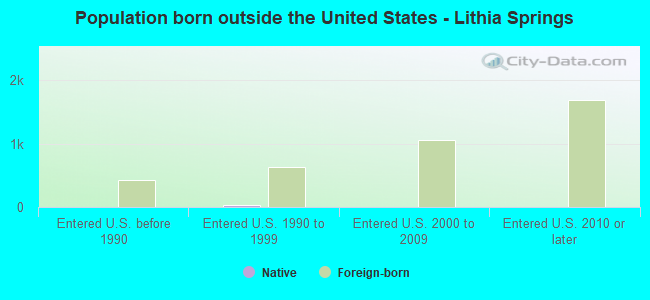
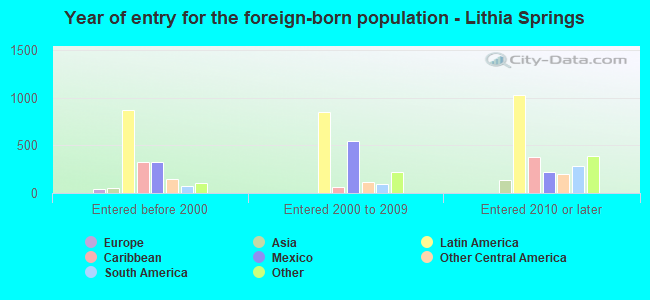
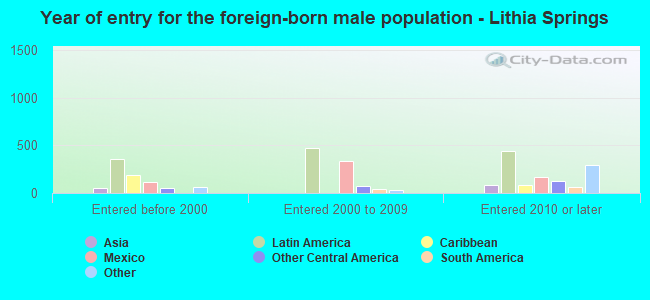
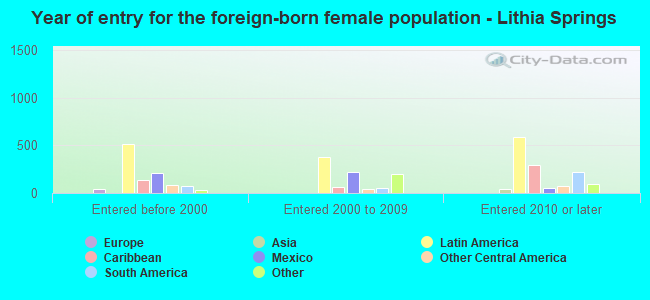
Foreign-born residents in Lithia Springs
3,545 residents are foreign born (16.0% Latin America, 3.8% Africa).
| This city: | 21.7% |
| Georgia: | 10.4% |
Marital status for residents in Lithia Springs
Marital status - White (Caucasian) population 15 years and over
- Males
- 29.6%Never married
- 52.1%Now married
- 2.5%Separated
- 3.0%Widowed
- 12.7%Divorced
- Females
- 26.6%Never married
- 38.4%Now married
- 4.0%Separated
- 10.1%Widowed
- 20.9%Divorced
Women who gave birth in the past 12 months
| Now married: | 64.5% (38) |
| Unmarried: | 35.5% (21) |
Women who did not give birth in the past 12 months
| Now married: | 32.1% (326) |
| Unmarried: | 67.9% (688) |
Marital status - Black or African American population 15 years and over
- Males
- 52.1%Never married
- 34.1%Now married
- 0.0%Separated
- 0.0%Widowed
- 13.9%Divorced
- Females
- 53.7%Never married
- 25.7%Now married
- 3.7%Separated
- 1.1%Widowed
- 15.8%Divorced
Women who gave birth in the past 12 months
| Now married: | 7.6% (11) |
| Unmarried: | 92.4% (128) |
Women who did not give birth in the past 12 months
| Now married: | 28.1% (697) |
| Unmarried: | 71.9% (1,781) |
Marital status - Asian population 15 years and over
- Males
- 26.3%Never married
- 73.7%Now married
- 0.0%Separated
- 0.0%Widowed
- 0.0%Divorced
- Females
- 76.0%Never married
- 24.0%Now married
- 0.0%Separated
- 0.0%Widowed
- 0.0%Divorced
Women who did not give birth in the past 12 months
| Now married: | 12.4% (13) |
| Unmarried: | 87.6% (95) |
Marital status - Other race population 15 years and over
- Males
- 23.5%Never married
- 63.5%Now married
- 0.0%Separated
- 0.0%Widowed
- 13.0%Divorced
- Females
- 28.6%Never married
- 33.1%Now married
- 13.1%Separated
- 14.1%Widowed
- 11.0%Divorced
Women who did not give birth in the past 12 months
| Now married: | 45.5% (104) |
| Unmarried: | 54.5% (124) |
Marital status - Two or more races population 15 years and over
- Males
- 85.3%Never married
- 14.7%Now married
- 0.0%Separated
- 0.0%Widowed
- 0.0%Divorced
- Females
- 38.5%Never married
- 39.2%Now married
- 0.0%Separated
- 15.2%Widowed
- 7.2%Divorced
Women who gave birth in the past 12 months
| Now married: | 0.0% (0) |
| Unmarried: | 100.0% (176) |
Women who did not give birth in the past 12 months
| Now married: | 50.7% (368) |
| Unmarried: | 49.3% (357) |
Marital status - White alone, not Hispanic / Latino population 15 years and over
- Males
- 23.2%Never married
- 55.9%Now married
- 3.1%Separated
- 3.8%Widowed
- 14.0%Divorced
- Females
- 22.6%Never married
- 42.1%Now married
- 1.6%Separated
- 9.8%Widowed
- 23.9%Divorced
Women who gave birth in the past 12 months
| Now married: | 47.1% (20) |
| Unmarried: | 52.9% (23) |
Women who did not give birth in the past 12 months
| Now married: | 31.8% (216) |
| Unmarried: | 68.2% (464) |
Marital status - Hispanic or Latino population 15 years and over
- Males
- 55.9%Never married
- 36.6%Now married
- 0.0%Separated
- 0.0%Widowed
- 7.4%Divorced
- Females
- 38.2%Never married
- 27.8%Now married
- 8.0%Separated
- 12.6%Widowed
- 13.5%Divorced
Women who gave birth in the past 12 months
| Now married: | 22.9% (28) |
| Unmarried: | 77.1% (95) |
Women who did not give birth in the past 12 months
| Now married: | 35.5% (365) |
| Unmarried: | 64.5% (663) |
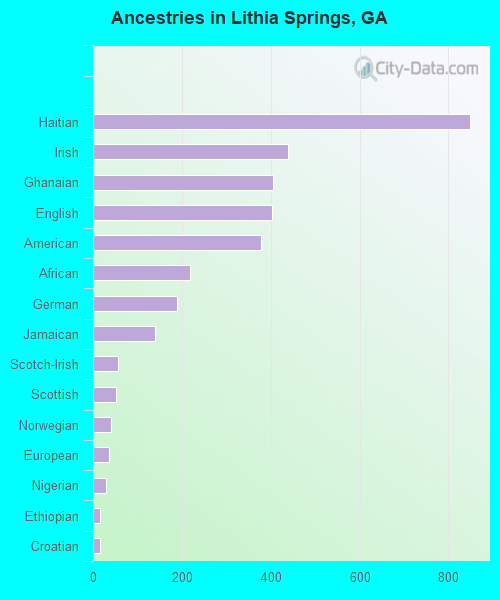
Ancestries in Lithia Springs

- 8497.5%Haitian
- 4383.9%Irish
- 4053.6%Ghanaian
- 4043.6%English
- 3793.4%American
- 2181.9%African
- 1891.7%German
- 1391.2%Jamaican
- 560.5%Scotch-Irish
- 520.5%Scottish
- 410.4%Norwegian
- 350.3%European
- 300.3%Nigerian
- 160.1%Ethiopian
- 150.1%Croatian
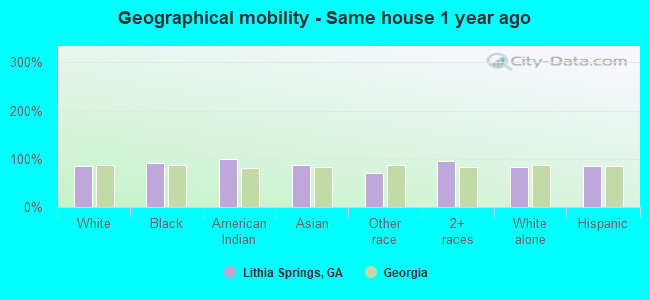
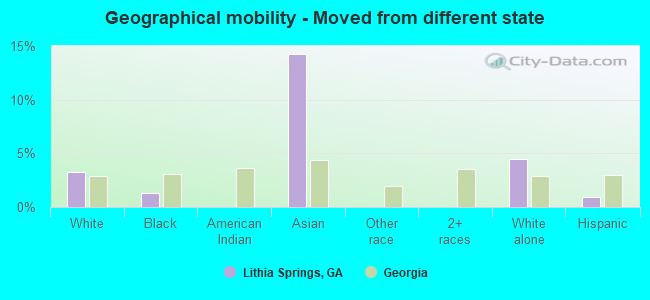
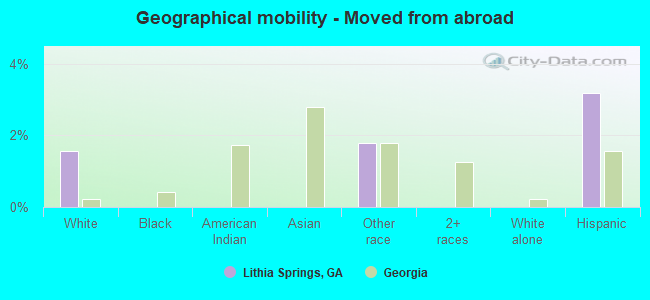
Geographical mobility in Lithia Springs

- Same house 1 year ago
- 3,85684.7%White (Caucasian)
- 7,45292.2%Black or African American
- 2799.5%American Indian / Alaska Native
- 26488.1%Asian
- 88671.5%Other race
- 1,74094.4%Two or more races
- 3,00382.2%White alone, not Hispanic / Latino
- 3,20685.5%Hispanic or Latino
-
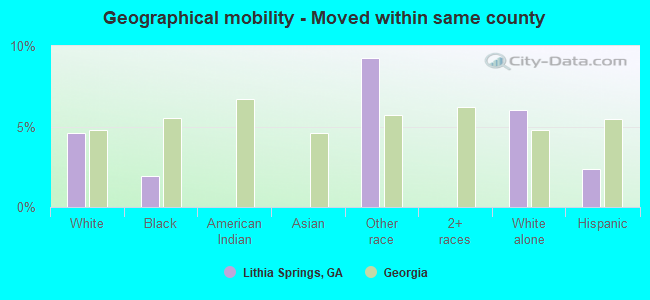
- Moved within same county
- 2114.6%White / Caucasian
- 1571.9%Black or African American
- 1159.2%Other race
- 2196.0%White alone, not Hispanic / Latino
- 872.3%Hispanic or Latino
-
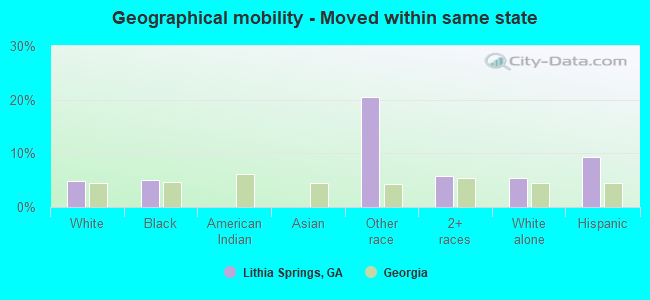
- Moved within same state
- 2204.8%White / Caucasian
- 4125.1%Black or African American
- 25420.5%Other race
- 1065.8%Two or more races
- 1975.4%White alone, not Hispanic / Latino
- 3519.4%Hispanic or Latino
-
- Moved from different state
- 1473.2%White / Caucasian
- 1031.3%Black or African American
- 4314.3%Asian
- 1634.5%White alone, not Hispanic / Latino
- 350.9%Hispanic or Latino
-
- Moved from abroad
- 711.6%White
- 221.8%Other race
- 1193.2%Hispanic or Latino
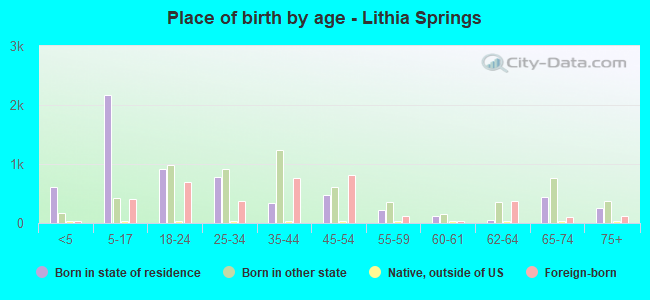
Children Nativity (place of birth) in Lithia Springs
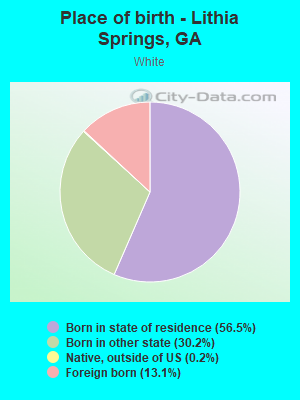
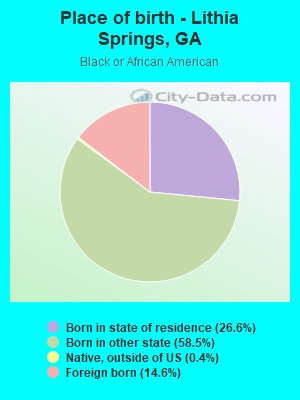
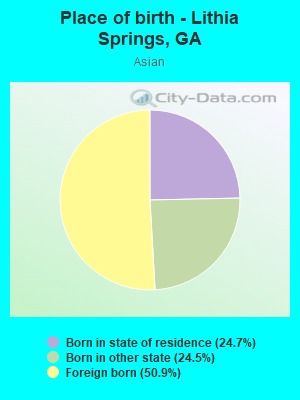
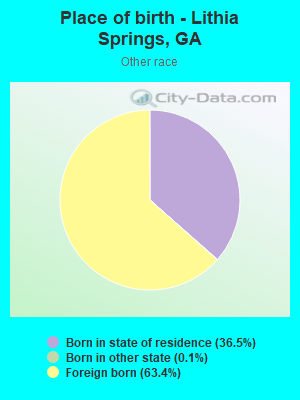
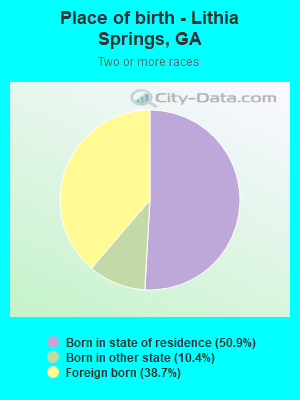
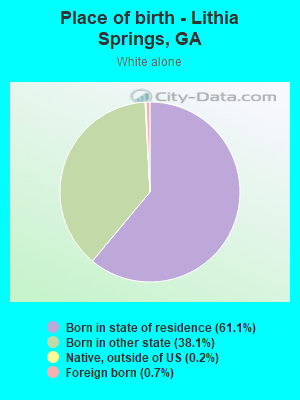
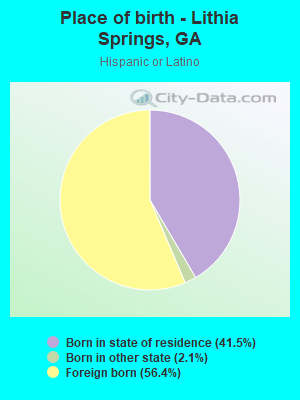
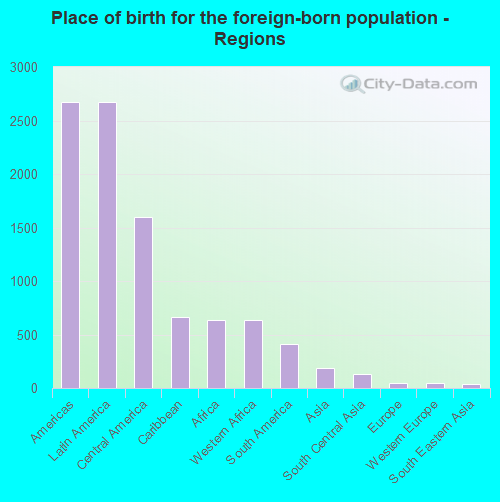
Place of birth for residents in Lithia Springs
![Place of birth for the foreign-born population - Regions]()
- 2,675Americas
- 2,675Latin America
- 1,600Central America
- 659Caribbean
- 636Africa
- 636Western Africa
- 415South America
- 186Asia
- 131South Central Asia
- 46Europe
- 46Western Europe
- 35South Eastern Asia
- 19Eastern Asia
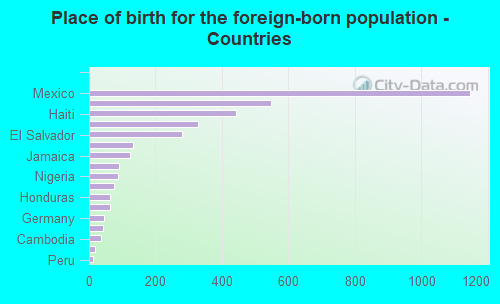
![Place of birth for the foreign-born population - Countries]()
- 1,147Mexico
- 549Ghana
- 443Haiti
- 327Venezuela
- 281El Salvador
- 131India
- 124Jamaica
- 91Dominican Republic
- 86Nigeria
- 76Argentina
- 64Honduras
- 63Nicaragua
- 46Germany
- 42Guatemala
- 35Cambodia
- 19Korea
- 11Peru
Grandparents responsible for own grandchildren in Lithia Springs
Zip codes: 30122.