Races in Linwood, Wisconsin (WI) Detailed Stats
Ancestries, Foreign-born residents, place of birth
Race distribution in Linwood

- 1,09698.6%White alone
- 60.5%Two or more races
- 40.4%Asian alone
- 20.2%Hispanic
- 20.2%American Indian alone
- 10.09%Black alone

2000
2022
-
- 4,681,63087.3%White alone
- 300,2455.6%Black alone
- 192,9213.6%Hispanic
- 87,9951.6%Asian alone
- 51,9211.0%Two or more races
- 43,9800.8%American Indian alone
- 3,6370.07%Other race alone
- 1,3460.03%Native Hawaiian and Other
Pacific Islander alone

-
- 4,654,03179.0%White alone
- 447,0227.6%Hispanic
- 345,6785.9%Black alone
- 217,5323.7%Two or more races
- 172,2422.9%Asian alone
- 33,7620.6%American Indian alone
- 19,6800.3%Other race alone
- 2,5920.04%Native Hawaiian and Other
Pacific Islander alone

Income and house value in Linwood
- Median household income in 2022
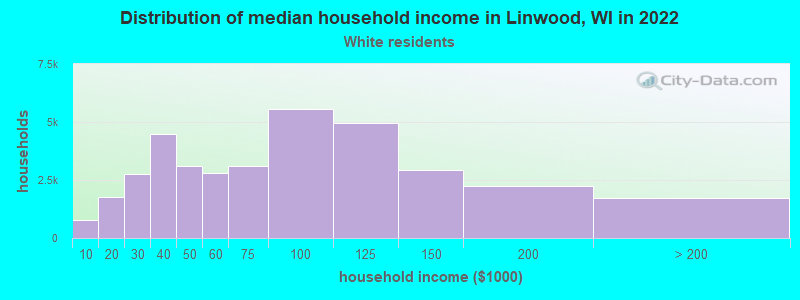
- $92,613White non-Hispanic householders
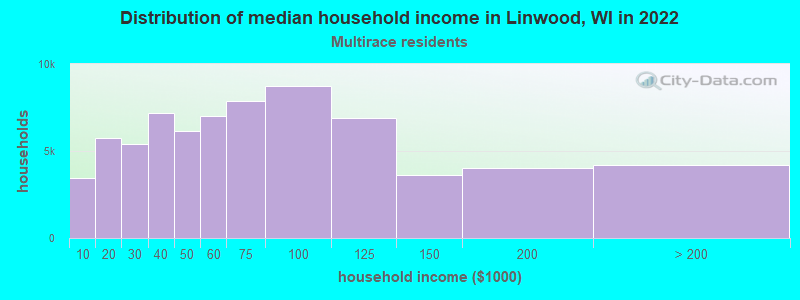
- $50,044Two or more races householders
- Median 2022 house value
- $265,119White Non-Hispanic householders
Household income for White non-Hispanic householders
Household income for Two or more races householders
Ancestries in Linwood

- 64243.1%Polish
- 46931.5%German
- 916.1%English
- 654.4%Irish
- 402.7%Norwegian
- 291.9%United States
- 281.9%Other
- 221.5%Swedish
- 181.2%French
- 161.1%Dutch
- 120.8%Czech
- 120.8%Scottish
- 100.7%Danish
- 100.7%French Canadian
- 70.5%Russian
- 60.4%Swiss
- 50.3%Lithuanian
- 30.2%Scotch-Irish
- 20.1%Hungarian
- 20.1%Welsh

Zip codes: 54481.