Races in Lexington, South Carolina (SC) Detailed Stats
Data:
Races - White alone (%)
Races - White alone (% change since 2000)
Races - Black alone (%)
Races - Black alone (% change since 2000)
Races - American Indian alone (%)
Races - American Indian alone (% change since 2000)
Races - Asian alone (%)
Races - Asian alone (% change since 2000)
Races - Hispanic (%)
Races - Hispanic (% change since 2000)
Races - Native Hawaiian and Other Pacific Islander alone (%)
Races - Native Hawaiian and Other Pacific Islander alone (% change since 2000)
Races - Two or more races(%)
Races - Two or more races(% change since 2000)
Races - Other race alone (%)
Races - Other race alone (% change since 2000)
Racial diversity
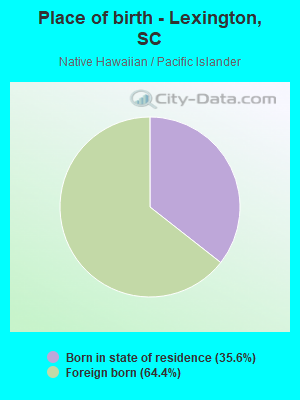
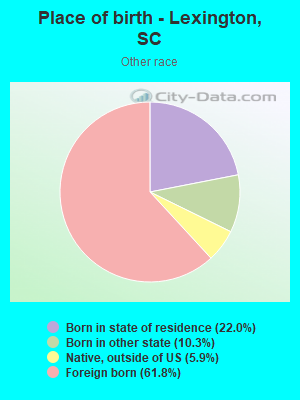
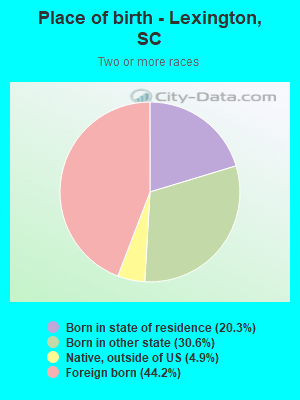
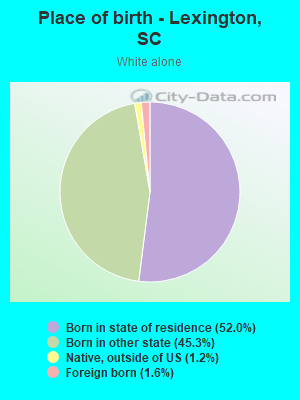
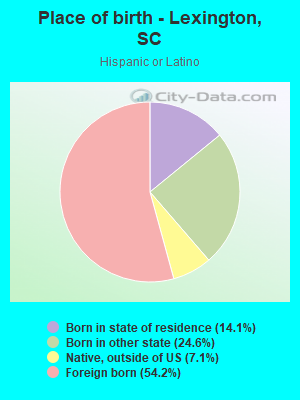
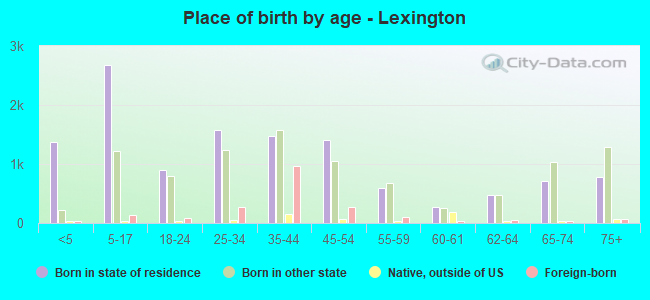
Place of birth - Born in state of residence (%)
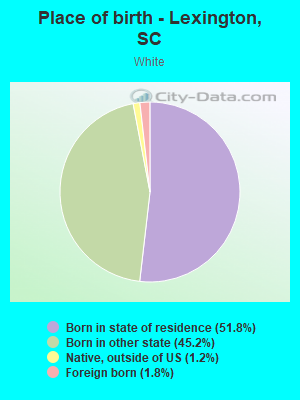
Place of birth - Born in state of residence (%) - White
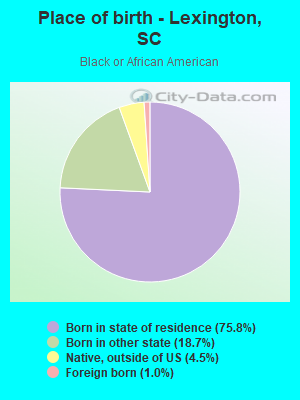
Place of birth - Born in state of residence (%) - Black or African American
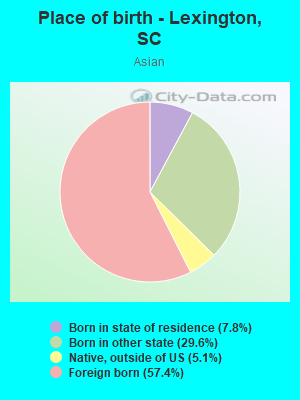
Place of birth - Born in state of residence (%) - Asian
Place of birth - Born in state of residence (%) - Hispanic or Latino
Place of birth - Born in state of residence (%) - American Indian and Alaska Native
Place of birth - Born in state of residence (%) - Multirace
Place of birth - Born in state of residence (%) - Other Race
Place of birth - Born in other state (%)
Place of birth - Born in other state (%) - White
Place of birth - Born in other state (%) - Black or African American
Place of birth - Born in other state (%) - Asian
Place of birth - Born in other state (%) - Hispanic or Latino
Place of birth - Born in other state (%) - American Indian and Alaska Native
Place of birth - Born in other state (%) - Multirace
Place of birth - Born in other state (%) - Other Race
Place of birth - Native, outside of US (%)
Place of birth - Native, outside of US (%) - White
Place of birth - Native, outside of US (%) - Black or African American
Place of birth - Native, outside of US (%) - Asian
Place of birth - Native, outside of US (%) - Hispanic or Latino
Place of birth - Native, outside of US (%) - American Indian and Alaska Native
Place of birth - Native, outside of US (%) - Multirace
Place of birth - Native, outside of US (%) - Other Race
Place of birth - Foreign born (%)
Place of birth - Foreign born (%) - White
Place of birth - Foreign born (%) - Black or African American
Place of birth - Foreign born (%) - Asian
Place of birth - Foreign born (%) - Hispanic or Latino
Place of birth - Foreign born (%) - American Indian and Alaska Native
Place of birth - Foreign born (%) - Multirace
Place of birth - Foreign born (%) - Other Race
Residents speaking English at home (%)
Residents speaking English at home - Born in the United States (%)
Residents speaking English at home - Native, born elsewhere (%)
Residents speaking English at home - Foreign born (%)
Residents speaking Spanish at home (%)
Residents speaking Spanish at home - Born in the United States (%)
Residents speaking Spanish at home - Native, born elsewhere (%)
Residents speaking Spanish at home - Foreign born (%)
Residents speaking other language at home (%)
Residents speaking other language at home - Born in the United States (%)
Residents speaking other language at home - Native, born elsewhere (%)
Residents speaking other language at home - Foreign born (%)
Marital status - Never married (%)
Marital status - Now married (%)
Marital status - Separated (%)
Marital status - Widowed (%)
Marital status - Divorced (%)
Ancestries Reported - Arab (%)
Ancestries Reported - Czech (%)
Ancestries Reported - Danish (%)
Ancestries Reported - Dutch (%)
Ancestries Reported - English (%)
Ancestries Reported - French (%)
Ancestries Reported - French Canadian (%)
Ancestries Reported - German (%)
Ancestries Reported - Greek (%)
Ancestries Reported - Hungarian (%)
Ancestries Reported - Irish (%)
Ancestries Reported - Italian (%)
Ancestries Reported - Lithuanian (%)
Ancestries Reported - Norwegian (%)
Ancestries Reported - Polish (%)
Ancestries Reported - Portuguese (%)
Ancestries Reported - Russian (%)
Ancestries Reported - Scotch-Irish (%)
Ancestries Reported - Scottish (%)
Ancestries Reported - Slovak (%)
Ancestries Reported - Subsaharan African (%)
Ancestries Reported - Swedish (%)
Ancestries Reported - Swiss (%)
Ancestries Reported - Ukrainian (%)
Ancestries Reported - United States (%)
Ancestries Reported - Welsh (%)
Ancestries Reported - West Indian (%)
Ancestries Reported - Other (%)
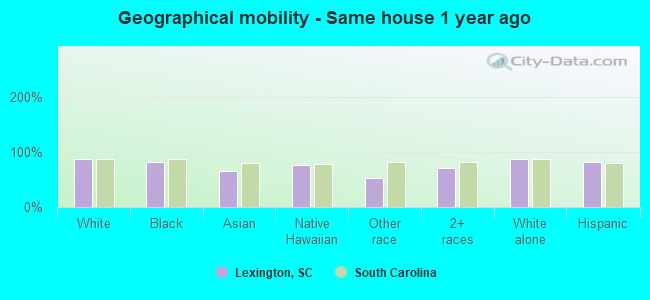
Geographical mobility - Same house 1 year ago (%)
Geographical mobility - Same house 1 year ago (%) - White
Geographical mobility - Same house 1 year ago (%) - Black or African American
Geographical mobility - Same house 1 year ago (%) - Asian
Geographical mobility - Same house 1 year ago (%) - Hispanic or Latino
Geographical mobility - Same house 1 year ago (%) - American Indian and Alaska Native
Geographical mobility - Same house 1 year ago (%) - Multirace
Geographical mobility - Same house 1 year ago (%) - Other Race
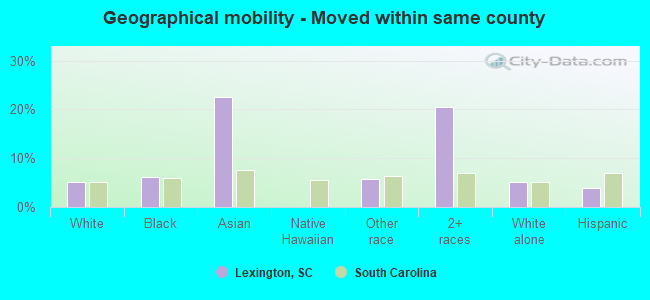
Geographical mobility - Moved within same county (%)
Geographical mobility - Moved within same county (%) - White
Geographical mobility - Moved within same county (%) - Black or African American
Geographical mobility - Moved within same county (%) - Asian
Geographical mobility - Moved within same county (%) - Hispanic or Latino
Geographical mobility - Moved within same county (%) - American Indian and Alaska Native
Geographical mobility - Moved within same county (%) - Multirace
Geographical mobility - Moved within same county (%) - Other Race
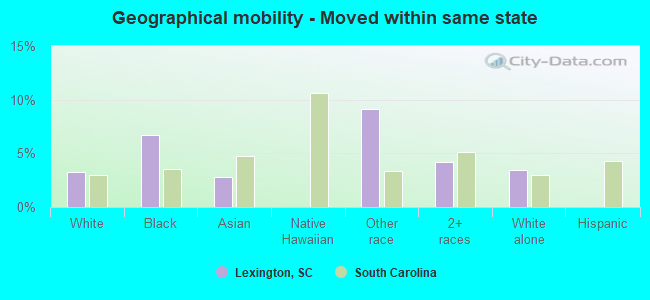
Geographical mobility - Moved from different county within same state (%)
Geographical mobility - Moved from different county within same state (%) - White
Geographical mobility - Moved from different county within same state (%) - Black or African American
Geographical mobility - Moved from different county within same state (%) - Asian
Geographical mobility - Moved from different county within same state (%) - Hispanic or Latino
Geographical mobility - Moved from different county within same state (%) - American Indian and Alaska Native
Geographical mobility - Moved from different county within same state (%) - Multirace
Geographical mobility - Moved from different county within same state (%) - Other Race
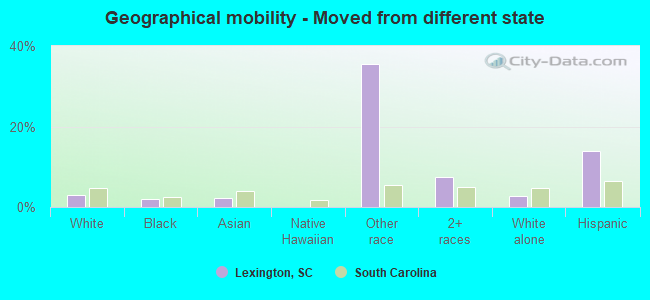
Geographical mobility - Moved from different state (%)
Geographical mobility - Moved from different state (%) - White
Geographical mobility - Moved from different state (%) - Black or African American
Geographical mobility - Moved from different state (%) - Asian
Geographical mobility - Moved from different state (%) - Hispanic or Latino
Geographical mobility - Moved from different state (%) - American Indian and Alaska Native
Geographical mobility - Moved from different state (%) - Multirace
Geographical mobility - Moved from different state (%) - Other Race
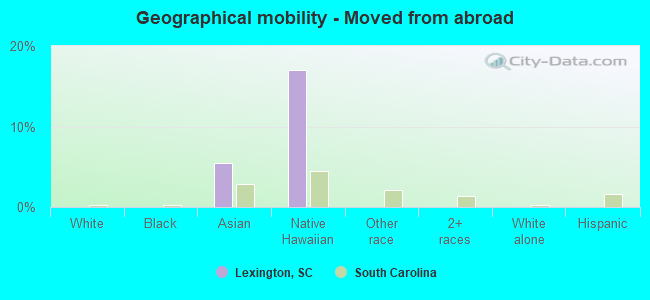
Geographical mobility - Moved from abroad (%)
Geographical mobility - Moved from abroad (%) - White
Geographical mobility - Moved from abroad (%) - Black or African American
Geographical mobility - Moved from abroad (%) - Asian
Geographical mobility - Moved from abroad (%) - Hispanic or Latino
Geographical mobility - Moved from abroad (%) - American Indian and Alaska Native
Geographical mobility - Moved from abroad (%) - Multirace
Geographical mobility - Moved from abroad (%) - Other Race
Place of birth for the foreign-born population - Ireland (%)
Place of birth for the foreign-born population - Denmark (%)
Place of birth for the foreign-born population - Norway (%)
Place of birth for the foreign-born population - Sweden (%)
Place of birth for the foreign-born population - United Kingdom (%)
Place of birth for the foreign-born population - England (%)
Place of birth for the foreign-born population - Scotland (%)
Place of birth for the foreign-born population - Other Northern Europe (%)
Place of birth for the foreign-born population - Austria (%)
Place of birth for the foreign-born population - Belgium (%)
Place of birth for the foreign-born population - France (%)
Place of birth for the foreign-born population - Germany (%)
Place of birth for the foreign-born population - Netherlands (%)
Place of birth for the foreign-born population - Switzerland (%)
Place of birth for the foreign-born population - Other Western Europe (%)
Place of birth for the foreign-born population - Greece (%)
Place of birth for the foreign-born population - Italy (%)
Place of birth for the foreign-born population - Portugal (%)
Place of birth for the foreign-born population - Spain (%)
Place of birth for the foreign-born population - Other Southern Europe (%)
Place of birth for the foreign-born population - Albania (%)
Place of birth for the foreign-born population - Belarus (%)
Place of birth for the foreign-born population - Bosnia and Herzegovina (%)
Place of birth for the foreign-born population - Bulgaria (%)
Place of birth for the foreign-born population - Croatia (%)
Place of birth for the foreign-born population - Czechoslovakia (%)
Place of birth for the foreign-born population - Hungary (%)
Place of birth for the foreign-born population - Latvia (%)
Place of birth for the foreign-born population - Lithuania (%)
Place of birth for the foreign-born population - North Macedonia (Macedonia) (%)
Place of birth for the foreign-born population - Moldova (%)
Place of birth for the foreign-born population - Poland (%)
Place of birth for the foreign-born population - Romania (%)
Place of birth for the foreign-born population - Russia (%)
Place of birth for the foreign-born population - Serbia (%)
Place of birth for the foreign-born population - Ukraine (%)
Place of birth for the foreign-born population - Other Eastern Europe (%)
Place of birth for the foreign-born population - China (%)
Place of birth for the foreign-born population - Hong Kong (%)
Place of birth for the foreign-born population - Taiwan (%)
Place of birth for the foreign-born population - Japan (%)
Place of birth for the foreign-born population - Korea (%)
Place of birth for the foreign-born population - Other Eastern Asia (%)
Place of birth for the foreign-born population - Afghanistan (%)
Place of birth for the foreign-born population - Bangladesh (%)
Place of birth for the foreign-born population - India (%)
Place of birth for the foreign-born population - Iran (%)
Place of birth for the foreign-born population - Kazakhstan (%)
Place of birth for the foreign-born population - Nepal (%)
Place of birth for the foreign-born population - Pakistan (%)
Place of birth for the foreign-born population - Sri Lanka (%)
Place of birth for the foreign-born population - Uzbekistan (%)
Place of birth for the foreign-born population - Other South Central Asia (%)
Place of birth for the foreign-born population - Burma (%)
Place of birth for the foreign-born population - Cambodia (%)
Place of birth for the foreign-born population - Indonesia (%)
Place of birth for the foreign-born population - Laos (%)
Place of birth for the foreign-born population - Malaysia (%)
Place of birth for the foreign-born population - Philippines (%)
Place of birth for the foreign-born population - Singapore (%)
Place of birth for the foreign-born population - Thailand (%)
Place of birth for the foreign-born population - Vietnam (%)
Place of birth for the foreign-born population - Other South Eastern Asia (%)
Place of birth for the foreign-born population - Armenia (%)
Place of birth for the foreign-born population - Iraq (%)
Place of birth for the foreign-born population - Israel (%)
Place of birth for the foreign-born population - Jordan (%)
Place of birth for the foreign-born population - Kuwait (%)
Place of birth for the foreign-born population - Lebanon (%)
Place of birth for the foreign-born population - Saudi Arabia (%)
Place of birth for the foreign-born population - Syria (%)
Place of birth for the foreign-born population - Turkey (%)
Place of birth for the foreign-born population - Yemen (%)
Place of birth for the foreign-born population - Other Western Asia (%)
Place of birth for the foreign-born population - Eritrea (%)
Place of birth for the foreign-born population - Ethiopia (%)
Place of birth for the foreign-born population - Kenya (%)
Place of birth for the foreign-born population - Somalia (%)
Place of birth for the foreign-born population - Uganda (%)
Place of birth for the foreign-born population - Zimbabwe (%)
Place of birth for the foreign-born population - Other Eastern Africa (%)
Place of birth for the foreign-born population - Cameroon (%)
Place of birth for the foreign-born population - Congo (%)
Place of birth for the foreign-born population - Democratic Republic of Congo (Zaire) (%)
Place of birth for the foreign-born population - Other Middle Africa (%)
Place of birth for the foreign-born population - Egypt (%)
Place of birth for the foreign-born population - Morocco (%)
Place of birth for the foreign-born population - Sudan (%)
Place of birth for the foreign-born population - Other Northern Africa (%)
Place of birth for the foreign-born population - South Africa (%)
Place of birth for the foreign-born population - Other Southern Africa (%)
Place of birth for the foreign-born population - Cabo Verde (%)
Place of birth for the foreign-born population - Ghana (%)
Place of birth for the foreign-born population - Liberia (%)
Place of birth for the foreign-born population - Nigeria (%)
Place of birth for the foreign-born population - Senegal (%)
Place of birth for the foreign-born population - Sierra Leone (%)
Place of birth for the foreign-born population - Other Western Africa (%)
Place of birth for the foreign-born population - Australia (%)
Place of birth for the foreign-born population - New Zealand (%)
Place of birth for the foreign-born population - Fiji (%)
Place of birth for the foreign-born population - Micronesia (%)
Place of birth for the foreign-born population - Bahamas (%)
Place of birth for the foreign-born population - Barbados (%)
Place of birth for the foreign-born population - Cuba (%)
Place of birth for the foreign-born population - Dominica (%)
Place of birth for the foreign-born population - Dominican Republic (%)
Place of birth for the foreign-born population - Grenada (%)
Place of birth for the foreign-born population - Haiti (%)
Place of birth for the foreign-born population - Jamaica (%)
Place of birth for the foreign-born population - St. Vincent and the Grenadines (%)
Place of birth for the foreign-born population - Trinidad and Tobago (%)
Place of birth for the foreign-born population - West Indies (%)
Place of birth for the foreign-born population - Other Caribbean (%)
Place of birth for the foreign-born population - Belize (%)
Place of birth for the foreign-born population - Costa Rica (%)
Place of birth for the foreign-born population - El Salvador (%)
Place of birth for the foreign-born population - Guatemala (%)
Place of birth for the foreign-born population - Honduras (%)
Place of birth for the foreign-born population - Mexico (%)
Place of birth for the foreign-born population - Nicaragua (%)
Place of birth for the foreign-born population - Panama (%)
Place of birth for the foreign-born population - Other Central America (%)
Place of birth for the foreign-born population - Argentina (%)
Place of birth for the foreign-born population - Bolivia (%)
Place of birth for the foreign-born population - Brazil (%)
Place of birth for the foreign-born population - Chile (%)
Place of birth for the foreign-born population - Colombia (%)
Place of birth for the foreign-born population - Ecuador (%)
Place of birth for the foreign-born population - Guyana (%)
Place of birth for the foreign-born population - Peru (%)
Place of birth for the foreign-born population - Uruguay (%)
Place of birth for the foreign-born population - Venezuela (%)
Place of birth for the foreign-born population - Other South America (%)
Place of birth for the foreign-born population - Canada (%)
Place of birth for the foreign-born population - Other Northern America (%)
Place of birth for the foreign-born population - Other (%)
Latest news about races in Lexington, SC collected exclusively by city-data.com from local newspapers, TV, and radio stations
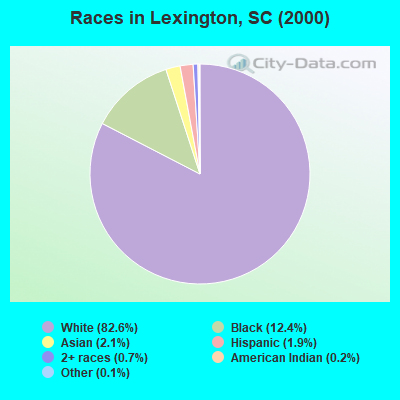
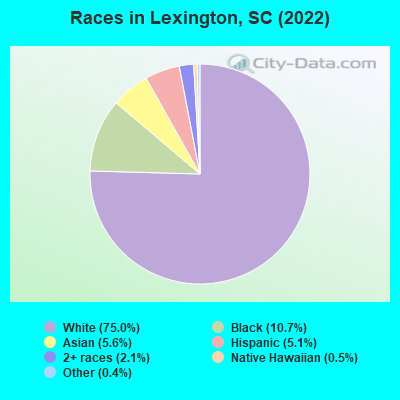
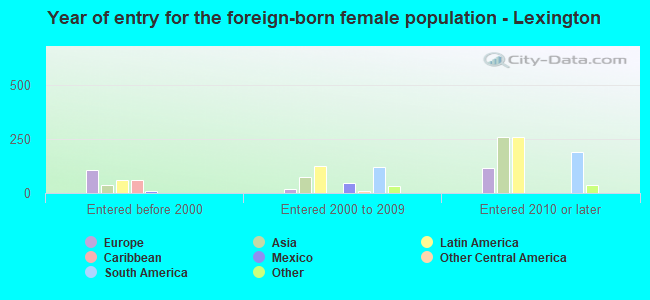
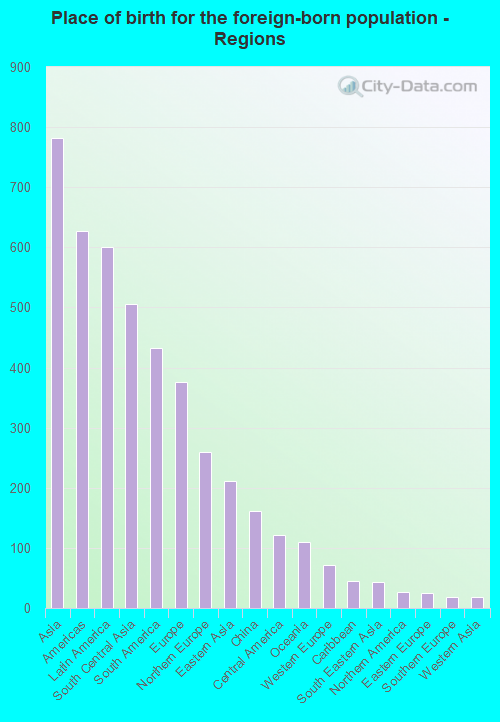
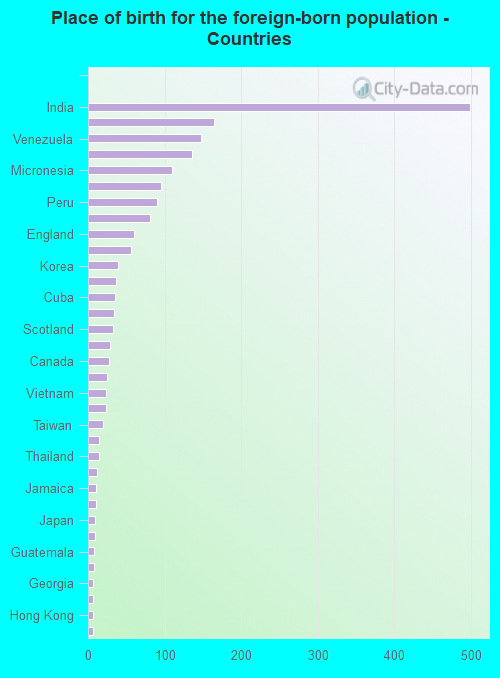
According to 2022 data, the most numerous races in Lexington, SC are White alone (18,281 residents), Black alone (2,604 residents), and Hispanic (1,242 residents). 89.2% of Lexington residents speak English at home. 7.8% of Lexington, SC residents are foreign-born (3.3% born in Asia, 2.5% born in Latin America, 1.6% born in Europe), which is 35.7% greater than the foreign-born rate of 5.0% across the entire state of South Carolina.
Race distribution in Lexington
2000 2022
2,652,291 66.1% White alone 1,178,486 29.4% Black alone 95,076 2.4% Hispanic 35,568 0.9% Asian alone 33,290 0.8% Two or more races 12,765 0.3% American Indian alone 3,266 0.08% Other race alone 1,270 0.03% Native Hawaiian and Other
3,301,739 62.5% White alone 1,313,290 24.9% Black alone 343,783 6.5% Hispanic 190,508 3.6% Two or more races 89,888 1.7% Asian alone 29,390 0.6% Other race alone 12,112 0.2% American Indian alone 1,924 0.04% Native Hawaiian and Other
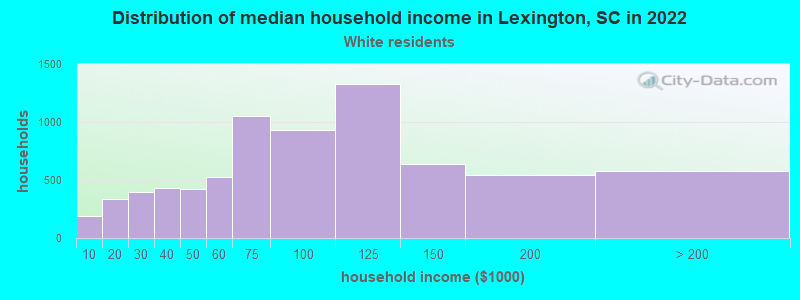
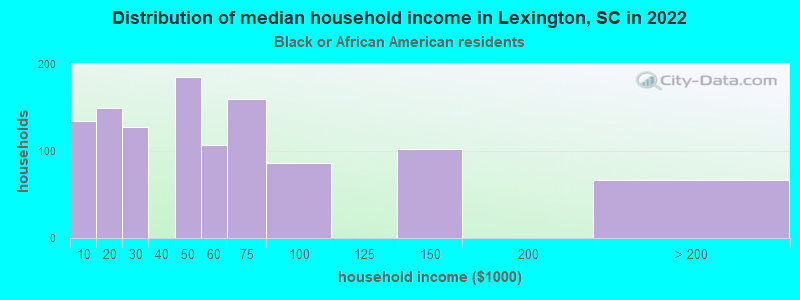
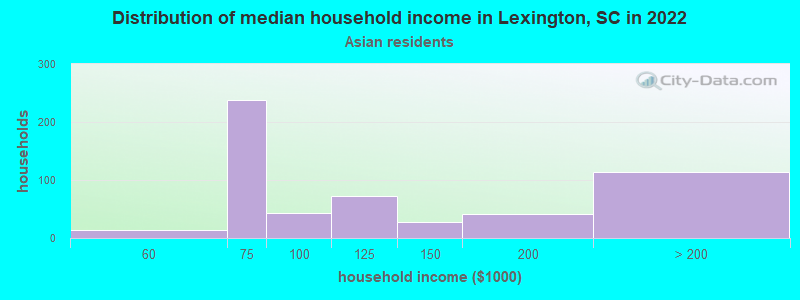
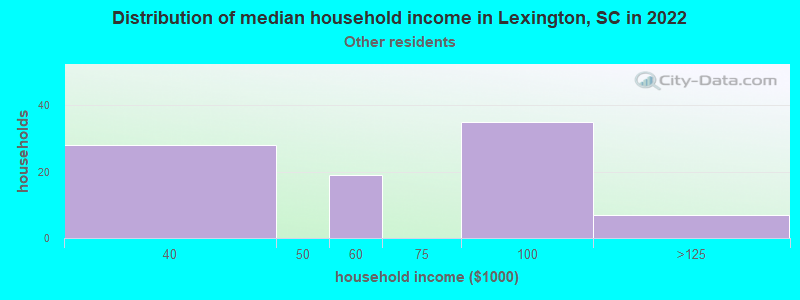
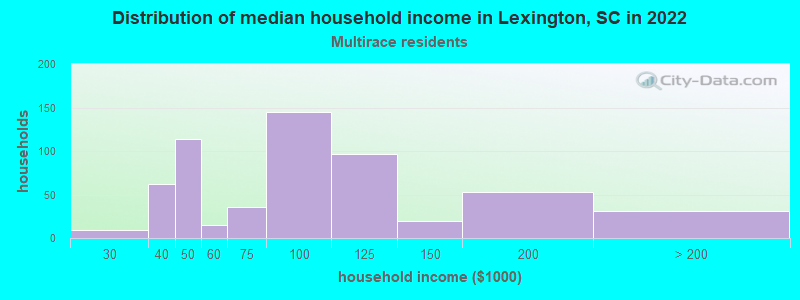
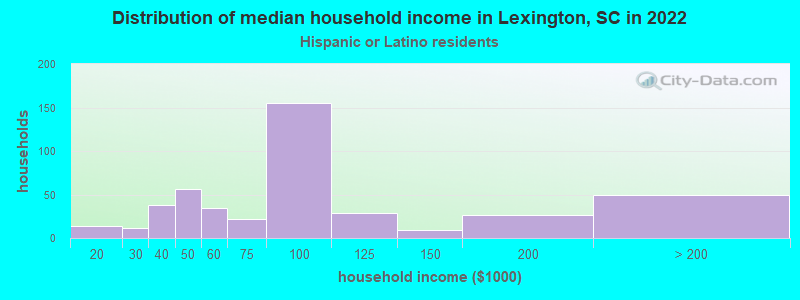
Income and house value in Lexington Median household income in 2022 $84,370 White non-Hispanic householders$53,304 Black householders$105,322 Asian householders$49,830 Some other race householders$85,362 Two or more races householders$93,895 Hispanic or Latino race householdersMedian 2022 house value $278,021 White Non-Hispanic householders$177,166 Black or African American householders $199,853 Asian householders$312,258 Two or more races householders
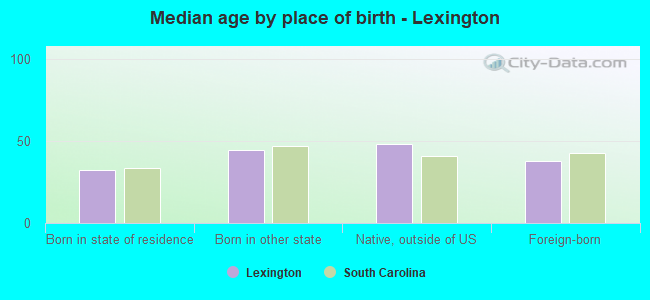
Median age by race in Lexington
41.3 Median age for White residents40.9 42.5 38.4 Median age for Black or African American residents39.2 43.7 -984,126,983.1 Median age for American Indian / Alaska Native residents-878,787,877.9 -1,034,343,433.3 32.9 Median age for Asian residents36.4 32.5 24.8 Median age for Native Hawaiian / Pacific Islander residents19.5 -666,666,666.0 44.8 Median age for Other race residents47.8 33.3 41.3 Median age for Two or more races residents42.1 40.6 41.6 Median age for White alone residents40.9 42.8 35.8 Median age for Hispanic or Latino residents37.0 33.6
Owner/renter occupied households by race in Lexington
House owners and renters - White residents 5,523 76.8% Owner occupied1,668 23.2% Renter occupiedHouse owners and renters - Black or African American residents 361 32.3% Owner occupied756 67.7% Renter occupiedHouse owners and renters - Asian residents 325 69.9% Owner occupied140 30.1% Renter occupiedHouse owners and renters - Native Hawaiian / Pacific Islander residents 42 100.0% Renter occupiedHouse owners and renters - Other race residents 15 24.1% Owner occupied48 75.9% Renter occupiedHouse owners and renters - Two or more races residents 353 60.6% Owner occupied229 39.4% Renter occupiedHouse owners and renters - White alone residents 5,485 77.3% Owner occupied1,613 22.7% Renter occupiedHouse owners and renters - Hispanic or Latino residents 138 31.1% Owner occupied305 68.9% Renter occupied
Language usage in Lexington
English speakers - Total 89.2% of residents of Lexington speak English at home.
4.4% of residents speak Spanish at home 606 60.9% Speak English very well389 39.1% Speak English less than very well6.1% of residents speak other language at home 992 71.7% Speak English very well391 28.3% Speak English less than very well
English speakers - Born in the United States 94.7% of residents of Lexington speak English at home.
2.3% of residents speak Spanish at home 200 90.5% Speak English very well21 9.5% Speak English less than very well2.7% of residents speak other language at home 108 42.2% Speak English very well148 57.8% Speak English less than very well
English speakers - Native, born elsewhere 70.3% of residents of Lexington speak English at home.
20.5% of residents speak Spanish at home 92 100.0% Speak English very well4.0% of residents speak other language at home 18 100.0% Speak English very well
English speakers - Foreign-born 16.2% of residents of Lexington speak English at home.
38.5% of residents speak Spanish at home 414 55.3% Speak English very well334 44.7% Speak English less than very well45.7% of residents speak other language at home 709 79.8% Speak English very well180 20.2% Speak English less than very well
White (Caucasian) - Speak only English Native:
97.0% (16,501)Foreign-born:
39.1% (129)
White (Caucasian) - Speak another language Native:
3.1% (522)Foreign-born:
58.7% (193)
Black or African American - Speak only English Native:
99.2% (2,463)Foreign-born:
87.3% (24)
Asian - Speak only English Native:
43.6% (177)Foreign-born:
9.6% (75)
Asian - Speak another language Native:
57.6% (234)Foreign-born:
91.5% (714)
Other race - Speak only English Native:
30.7% (17)Foreign-born:
18.7% (25)
Other race - Speak another language Native:
59.1% (32)Foreign-born:
80.4% (106)
Two or more races - Speak only English Native:
83.4% (677)Foreign-born:
4.2% (29)
Two or more races - Speak another language Native:
16.8% (137)Foreign-born:
99.8% (690)
White alone - Speak only English Native:
97.4% (16,405)Foreign-born:
53.3% (150)
White alone - Speak another language Native:
2.7% (457)Foreign-born:
47.3% (133)
Hispanic or Latino - Speak only English Native:
53.2% (253)Foreign-born:
2.8% (19)
Hispanic or Latino - Speak another language Native:
47.0% (223)Foreign-born:
100.0% (686)
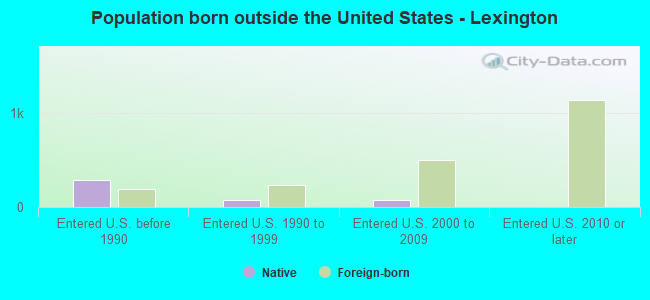
Foreign-born residents in Lexington 1,896 residents are foreign born (3.3% Asia , 2.5% Latin America , 1.6% Europe ).
This city:
7.8%South Carolina:
5.3%
Marital status for residents in Lexington Marital status - White (Caucasian) population 15 years and over
Males 25.1% Never married62.2% Now married1.7% Separated3.1% Widowed7.9% DivorcedFemales 22.4% Never married51.8% Now married1.4% Separated9.7% Widowed14.8% DivorcedWomen who gave birth in the past 12 months Now married:
68.3% (127)Unmarried:
31.7% (59)
Women who did not give birth in the past 12 months Now married:
52.3% (2,312)Unmarried:
47.7% (2,112)
Marital status - Black or African American population 15 years and over
Males 53.4% Never married31.3% Now married3.1% Separated1.1% Widowed11.1% DivorcedFemales 31.5% Never married32.6% Now married3.2% Separated11.1% Widowed21.5% DivorcedWomen who gave birth in the past 12 months Now married:
0.0% (0)Unmarried:
100.0% (16)
Women who did not give birth in the past 12 months Now married:
48.7% (220)Unmarried:
51.3% (232)
Marital status - Asian population 15 years and over
Males 10.5% Never married86.7% Now married0.0% Separated0.0% Widowed2.8% DivorcedFemales 33.0% Never married62.3% Now married2.4% Separated0.0% Widowed2.2% DivorcedWomen who gave birth in the past 12 months Now married:
100.0% (39)Unmarried:
0.0% (0)
Women who did not give birth in the past 12 months Now married:
60.9% (264)Unmarried:
39.1% (170)
Marital status - Native Hawaiian / Pacific Islander population 15 years and over
Males 51.3% Never married48.7% Now married0.0% Separated0.0% Widowed0.0% DivorcedFemales 0.0% Never married100.0% Now married0.0% Separated0.0% Widowed0.0% DivorcedWomen who gave birth in the past 12 months Now married:
100.0% (33)Unmarried:
0.0% (0)
Marital status - Other race population 15 years and over
Males 0.0% Never married80.3% Now married0.0% Separated19.7% Widowed0.0% DivorcedFemales 33.3% Never married56.8% Now married0.0% Separated9.9% Widowed0.0% DivorcedWomen who gave birth in the past 12 months Now married:
0.0% (0)Unmarried:
100.0% (40)
Women who did not give birth in the past 12 months Now married:
87.3% (76)Unmarried:
12.7% (11)
Marital status - Two or more races population 15 years and over
Males 21.9% Never married65.3% Now married3.2% Separated1.1% Widowed8.4% DivorcedFemales 15.5% Never married55.7% Now married0.0% Separated2.7% Widowed26.1% DivorcedWomen who did not give birth in the past 12 months Now married:
47.6% (116)Unmarried:
52.4% (128)
Marital status - White alone, not Hispanic / Latino population 15 years and over
Males 25.1% Never married62.2% Now married1.7% Separated2.9% Widowed8.0% DivorcedFemales 22.4% Never married51.7% Now married1.4% Separated9.7% Widowed14.9% DivorcedWomen who gave birth in the past 12 months Now married:
68.3% (127)Unmarried:
31.7% (59)
Women who did not give birth in the past 12 months Now married:
52.0% (2,287)Unmarried:
48.0% (2,110)
Marital status - Hispanic or Latino population 15 years and over
Males 15.9% Never married73.8% Now married2.3% Separated2.6% Widowed5.4% DivorcedFemales 11.9% Never married63.5% Now married1.0% Separated5.2% Widowed18.4% DivorcedWomen who did not give birth in the past 12 months Now married:
65.0% (231)Unmarried:
35.0% (124)
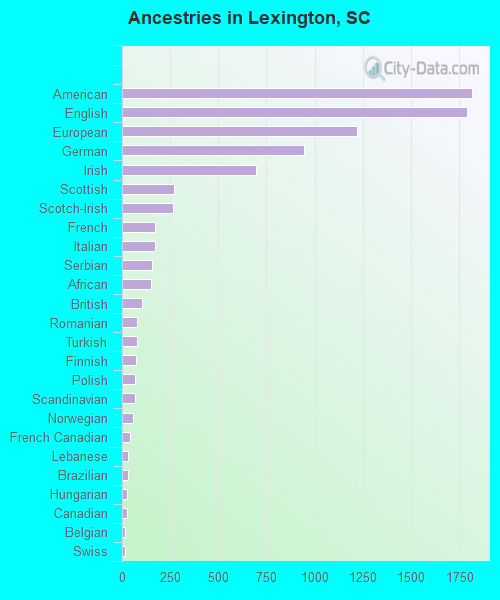
Ancestries in Lexington
1,815 14.3% American1,790 14.1% English1,220 9.6% European945 7.4% German698 5.5% Irish270 2.1% Scottish263 2.1% Scotch-Irish172 1.4% French169 1.3% Italian156 1.2% Serbian148 1.2% African103 0.8% British80 0.6% Romanian78 0.6% Turkish73 0.6% Finnish67 0.5% Polish66 0.5% Scandinavian57 0.4% Norwegian44 0.3% French Canadian31 0.2% Lebanese31 0.2% Brazilian27 0.2% Hungarian25 0.2% Canadian17 0.1% Belgian17 0.1% Swiss13 0.1% Dutch13 0.1% Swedish12 0.09% Northern European11 0.09% Lithuanian10 0.08% Jamaican9 0.07% Czech8 0.06% Greek7 0.06% Eastern European5 0.04% Austrian
Children Nativity (place of birth) in Lexington
Children under 6 years - Living with two parents Both parents native 1,494 100.0% NativeBoth parents foreign-born 298 88.8% Native38 11.2% Foreign-bornOne native, one foreign-born parent 12 100.0% NativeChildren under 6 years - Living with one parent Native parent 182 100.0% NativeForeign-born parent 13 100.0% NativeChildren 6 to 17 years - Living with two parents Both parents native 2,252 100.0% NativeBoth parents foreign-born 189 56.7% Native144 43.3% Foreign-bornOne native, one foreign-born parent 256 93.4% Native18 6.6% Foreign-bornChildren 6 to 17 years - Living with one parent Native parent 1,018 100.0% NativeForeign-born parent 22 49.3% Native23 50.7% Foreign-born
Grandparents responsible for own grandchildren in Lexington
Grandparents (30 to 59 years) White / Caucasian 27 88.7% Responsible for grandchildren3 11.3% Not responsible for grandchildrenOther race 12 100.0% Not responsible for grandchildrenWhite alone, not Hispanic / Latino 28 88.8% Responsible for grandchildren3 11.2% Not responsible for grandchildrenHispanic or Latino 15 100.0% Not responsible for grandchildrenGrandparents (60 years and over) White / Caucasian 20 19.9% Responsible for grandchildren81 80.1% Not responsible for grandchildrenWhite alone, not Hispanic / Latino 21 20.6% Responsible for grandchildren80 79.4% Not responsible for grandchildren