Races in Lewisburg, Pennsylvania (PA) Detailed Stats
Ancestries, Foreign-born residents, place of birth
Settings
X


Recent posts about races in Lewisburg, Pennsylvania on our local forum with over 2,400,000 registered users:
 | Diversity in Lewisburg, PA...how are blacks treated? (5 replies) |
| Lewisburg, PA (8 replies) |
| Where to live near Geisinger? (14 replies) |
| Move to Bloomsburg or Lewisburg, PA? (16 replies) |
| Considering relocating to Eastern PA From the Deeeeeeep South. Crazy? (123 replies) |
| Favorite small to medium-sized town in Pennsylvania? (58 replies) |
Latest news about races in Lewisburg, PA collected exclusively by city-data.com from local newspapers, TV, and radio stations
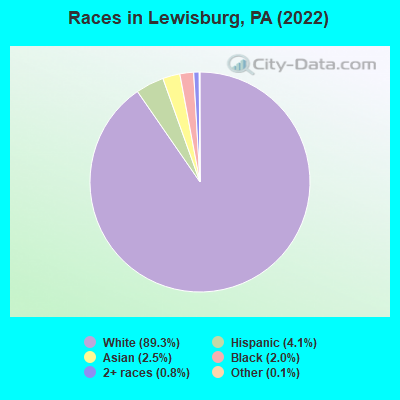
According to 2022 data, the most numerous races in Lewisburg, PA are White alone (4,711 residents), Black alone (107 residents), and Hispanic (216 residents). 91.4% of Lewisburg residents speak English at home. 3.6% of Lewisburg, PA residents are foreign-born (1.8% born in Latin America, 1.4% born in Asia), which is 94.4% less than the foreign-born rate of 7.0% across the entire state of Pennsylvania.
Race distribution in Lewisburg
2000
2022

- 5,07890.4%White alone
- 1572.8%Asian alone
- 1382.5%Black alone
- 1312.3%Hispanic
- 881.6%Two or more races
- 130.2%Other race alone
- 90.2%American Indian alone
- 60.1%Native Hawaiian and Other
Pacific Islander alone

-
- 4,71189.3%White alone
- 2164.1%Hispanic
- 1302.5%Asian alone
- 1072.0%Black alone
- 440.8%Two or more races
- 60.1%Other race alone
2000
2022
-
- 10,322,45584.1%White alone
- 1,202,4379.8%Black alone
- 394,0883.2%Hispanic
- 218,2961.8%Asian alone
- 113,0970.9%Two or more races
- 13,0860.1%Other race alone
- 14,9040.1%American Indian alone
- 2,6910.02%Native Hawaiian and Other
Pacific Islander alone

-
- 9,487,22873.1%White alone
- 1,311,58110.1%Black alone
- 1,115,9978.6%Hispanic
- 493,9423.8%Two or more races
- 487,1243.8%Asian alone
- 63,5820.5%Other race alone
- 10,1300.08%American Indian alone
- 2,4240.02%Native Hawaiian and Other
Pacific Islander alone

Income and house value in Lewisburg
- Median household income in 2022
- $41,351White non-Hispanic householders
- $80,309Asian householders
- $134,180Two or more races householders
- Median 2022 house value
- $241,954White Non-Hispanic householders
- $203,423Two or more races householders
- $203,423Hispanic or Latino householders
Household income for White non-Hispanic householders

Household income for Black householders

Household income for Asian householders

Household income for Two or more races householders

Household income for Hispanic or Latino race householders

Median age by race in Lewisburg
- 29.7Median age for White residents
- 29.9Males
- 29.7Females
- 21.9Median age for Black or African American residents
- 29.0Males
- 19.9Females
- -642,857,142.2Median age for American Indian / Alaska Native residents
- -714,583,332.6Males
- -577,519,379.3Females
- 20.4Median age for Asian residents
- 19.3Males
- 20.8Females
- -680,432,644.4Median age for Native Hawaiian / Pacific Islander residents
- -649,523,808.9Males
- -747,474,746.7Females
- 33.1Median age for Other race residents
- -673,355,629.2Males
- -687,898,088.5Females
- 47.0Median age for Two or more races residents
- 48.0Males
- 26.1Females
- 29.5Median age for White alone residents
- 29.6Males
- 29.5Females
- 30.2Median age for Hispanic or Latino residents
- 30.4Males
- 20.8Females
Owner/renter occupied households by race in Lewisburg
- House owners and renters - White residents
- 74840.6%Owner occupied
- 1,09559.4%Renter occupied
- House owners and renters - Black or African American residents
- 17100.0%Renter occupied
- House owners and renters - Asian residents
- 210.2%Owner occupied
- 1989.8%Renter occupied
- House owners and renters - Other race residents
- 31100.0%Renter occupied
- House owners and renters - Two or more races residents
- 5291.7%Owner occupied
- 58.3%Renter occupied
- House owners and renters - White alone residents
- 75341.3%Owner occupied
- 1,07158.7%Renter occupied
- House owners and renters - Hispanic or Latino residents
- 2623.1%Owner occupied
- 8876.9%Renter occupied
Language usage in Lewisburg
- English speakers - Total
- 91.4% of residents of Lewisburg speak English at home.
- 5.0% of residents speak Spanish at home
- 22486.8%Speak English very well
- 3413.2%Speak English less than very well
- 3.2% of residents speak other language at home
- 14586.8%Speak English very well
- 2213.2%Speak English less than very well
- English speakers - Born in the United States
- 95.0% of residents of Lewisburg speak English at home.
- 0.8% of residents speak Spanish at home
- 22100.0%Speak English very well
- 3.7% of residents speak other language at home
- 9596.9%Speak English very well
- 33.1%Speak English less than very well
- English speakers - Foreign-born
- 22.6% of residents of Lewisburg speak English at home.
- 41.4% of residents speak Spanish at home
- 5064.9%Speak English very well
- 2735.1%Speak English less than very well
- 36.6% of residents speak other language at home
- 5073.5%Speak English very well
- 1826.5%Speak English less than very well
White (Caucasian) - Speak only English
| Native: | 96.4% (4,452) |
| Foreign-born: | 18.2% (11) |
White (Caucasian) - Speak another language
| Native: | 3.5% (162) |
| Foreign-born: | 79.6% (49) |
Asian - Speak only English
| Native: | 30.9% (25) |
| Foreign-born: | 3.7% (2) |
Asian - Speak another language
| Native: | 70.2% (57) |
| Foreign-born: | 96.2% (52) |
Other race - Speak only English
| Native: | 46.9% (6) |
| Foreign-born: | 99.5% (38) |
White alone - Speak only English
| Native: | 95.9% (4,416) |
| Foreign-born: | 38.5% (12) |
White alone - Speak another language
| Native: | 4.2% (191) |
| Foreign-born: | 61.4% (19) |
Hispanic or Latino - Speak only English
| Native: | 71.2% (81) |
| Foreign-born: | 27.5% (30) |
Hispanic or Latino - Speak another language
| Native: | 29.4% (33) |
| Foreign-born: | 70.7% (78) |
Foreign-born residents in Lewisburg
190 residents are foreign born (1.8% Latin America, 1.4% Asia).
| This city: | 3.6% |
| Pennsylvania: | 7.3% |


Marital status for residents in Lewisburg
Marital status - White (Caucasian) population 15 years and over
- Males
- 58.9%Never married
- 26.0%Now married
- 5.8%Separated
- 0.3%Widowed
- 9.0%Divorced
- Females
- 51.1%Never married
- 21.4%Now married
- 0.6%Separated
- 11.9%Widowed
- 15.0%Divorced
Women who gave birth in the past 12 months
| Now married: | 0.0% (0) |
| Unmarried: | 100.0% (6) |
Women who did not give birth in the past 12 months
| Now married: | 13.7% (178) |
| Unmarried: | 86.3% (1,123) |
Marital status - Black or African American population 15 years and over
- Males
- 68.1%Never married
- 14.5%Now married
- 0.0%Separated
- 10.1%Widowed
- 7.2%Divorced
- Females
- 100.0%Never married
- 0.0%Now married
- 0.0%Separated
- 0.0%Widowed
- 0.0%Divorced
Women who did not give birth in the past 12 months
| Now married: | 0.0% (0) |
| Unmarried: | 100.0% (39) |
Marital status - Asian population 15 years and over
- Males
- 80.0%Never married
- 20.0%Now married
- 0.0%Separated
- 0.0%Widowed
- 0.0%Divorced
- Females
- 78.8%Never married
- 21.2%Now married
- 0.0%Separated
- 0.0%Widowed
- 0.0%Divorced
Women who did not give birth in the past 12 months
| Now married: | 21.2% (14) |
| Unmarried: | 78.8% (53) |
Marital status - Other race population 15 years and over
- Males
- 100.0%Never married
- 0.0%Now married
- 0.0%Separated
- 0.0%Widowed
- 0.0%Divorced
- Females
- 100.0%Never married
- 0.0%Now married
- 0.0%Separated
- 0.0%Widowed
- 0.0%Divorced
Women who did not give birth in the past 12 months
| Now married: | 0.0% (0) |
| Unmarried: | 100.0% (14) |
Marital status - Two or more races population 15 years and over
- Males
- 79.2%Never married
- 20.8%Now married
- 0.0%Separated
- 0.0%Widowed
- 0.0%Divorced
- Females
- 53.1%Never married
- 46.9%Now married
- 0.0%Separated
- 0.0%Widowed
- 0.0%Divorced
Women who did not give birth in the past 12 months
| Now married: | 46.9% (32) |
| Unmarried: | 53.1% (36) |
Marital status - White alone, not Hispanic / Latino population 15 years and over
- Males
- 57.9%Never married
- 26.2%Now married
- 6.1%Separated
- 0.3%Widowed
- 9.5%Divorced
- Females
- 51.0%Never married
- 21.5%Now married
- 0.6%Separated
- 11.9%Widowed
- 15.0%Divorced
Women who gave birth in the past 12 months
| Now married: | 0.0% (0) |
| Unmarried: | 100.0% (6) |
Women who did not give birth in the past 12 months
| Now married: | 13.7% (182) |
| Unmarried: | 86.3% (1,142) |
Marital status - Hispanic or Latino population 15 years and over
- Males
- 85.2%Never married
- 14.8%Now married
- 0.0%Separated
- 0.0%Widowed
- 0.0%Divorced
- Females
- 54.0%Never married
- 46.0%Now married
- 0.0%Separated
- 0.0%Widowed
- 0.0%Divorced
Women who did not give birth in the past 12 months
| Now married: | 46.0% (24) |
| Unmarried: | 54.0% (29) |
Ancestries in Lewisburg

- 52726.8%German
- 26713.6%English
- 23511.9%American
- 19810.1%Irish
- 1658.4%Italian
- 492.5%European
- 442.2%Scottish
- 371.9%Pennsylvania German
- 341.7%Welsh
- 251.3%Czechoslovakian
- 180.9%Norwegian
- 180.9%Polish
- 170.9%Slovak
- 140.7%Eastern European
- 140.7%Greek
- 110.6%Scotch-Irish
- 80.4%Slovene
- 70.4%Belgian
- 50.3%Turkish
- 30.2%Portuguese
- 20.1%Hungarian
- 10.05%British

Geographical mobility in Lewisburg

- Same house 1 year ago
- 2,78558.8%White (Caucasian)
- 5242.3%Black or African American
- 2821.7%Asian
- 3573.9%Other race
- 6260.6%Two or more races
- 2,82760.1%White alone, not Hispanic / Latino
- 5525.3%Hispanic or Latino

-
- Moved within same county
- 83817.7%White / Caucasian
- 3024.5%Black or African American
- 5100.0%American Indian / Alaska Native
- 3929.8%Asian
- 1021.7%Other race
- 1918.3%Two or more races
- 86018.3%White alone, not Hispanic / Latino
- 188.3%Hispanic or Latino

-
- Moved within same state
- 2815.9%White / Caucasian
- 2318.8%Black or African American
- 2217.1%Asian
- 2324.9%White alone, not Hispanic / Latino
- 6228.7%Hispanic or Latino

-
- Moved from different state
- 69214.6%White / Caucasian
- 108.3%Black or African American
- 3123.6%Asian
- 2221.5%Two or more races
- 70414.9%White alone, not Hispanic / Latino
- 2511.5%Hispanic or Latino

-
- Moved from abroad
- 671.4%White
- 290.6%White alone, not Hispanic / Latino
- 4621.1%Hispanic or Latino

Children Nativity (place of birth) in Lewisburg
Place of birth for residents in Lewisburg
![Place of birth for the foreign-born population - Regions]()
- 97Americas
- 97Latin America
- 79Asia
- 52South America
- 44Central America
- 32Eastern Asia
- 28China
- 28South Central Asia
- 13South Eastern Asia
- 7Europe
- 7Western Europe
- 6Western Asia
- 5Africa
- 5Northern Africa

![Place of birth for the foreign-born population - Countries]()
- 52Colombia
- 44Costa Rica
- 28China
- 24Bangladesh
- 13Thailand
- 7Belgium
- 6Turkey
- 5Egypt
- 4Korea
- 3Bhutan

Zip codes: 17837.