Races in Leon Valley, Texas (TX) Detailed Stats
Data:
Races - White alone (%)
Races - White alone (% change since 2000)
Races - Black alone (%)
Races - Black alone (% change since 2000)
Races - American Indian alone (%)
Races - American Indian alone (% change since 2000)
Races - Asian alone (%)
Races - Asian alone (% change since 2000)
Races - Hispanic (%)
Races - Hispanic (% change since 2000)
Races - Native Hawaiian and Other Pacific Islander alone (%)
Races - Native Hawaiian and Other Pacific Islander alone (% change since 2000)
Races - Two or more races(%)
Races - Two or more races(% change since 2000)
Races - Other race alone (%)
Races - Other race alone (% change since 2000)
Racial diversity
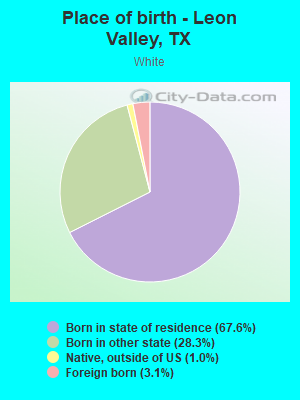
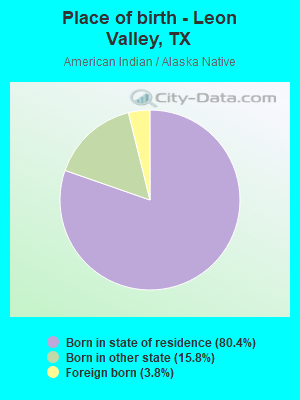
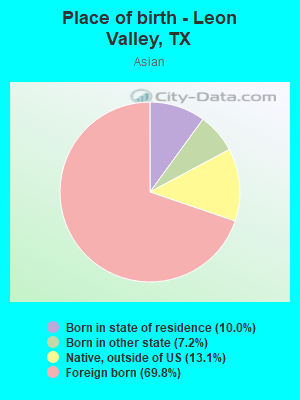
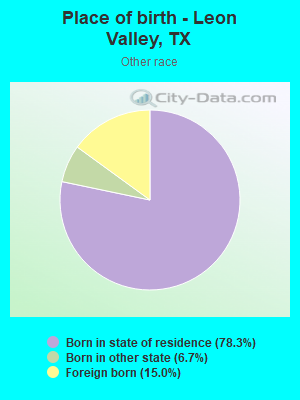
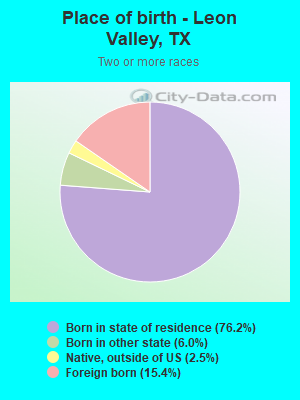
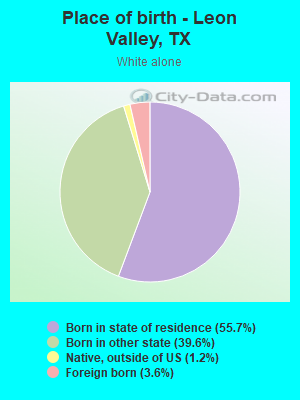
Place of birth - Born in state of residence (%)
Place of birth - Born in state of residence (%) - White
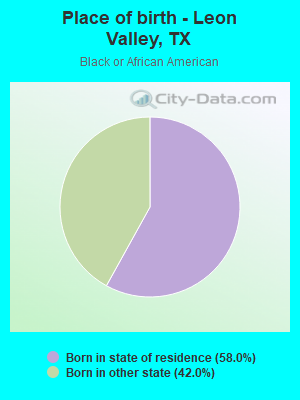
Place of birth - Born in state of residence (%) - Black or African American
Place of birth - Born in state of residence (%) - Asian
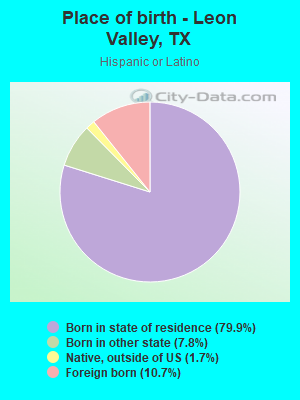
Place of birth - Born in state of residence (%) - Hispanic or Latino
Place of birth - Born in state of residence (%) - American Indian and Alaska Native
Place of birth - Born in state of residence (%) - Multirace
Place of birth - Born in state of residence (%) - Other Race
Place of birth - Born in other state (%)
Place of birth - Born in other state (%) - White
Place of birth - Born in other state (%) - Black or African American
Place of birth - Born in other state (%) - Asian
Place of birth - Born in other state (%) - Hispanic or Latino
Place of birth - Born in other state (%) - American Indian and Alaska Native
Place of birth - Born in other state (%) - Multirace
Place of birth - Born in other state (%) - Other Race
Place of birth - Native, outside of US (%)
Place of birth - Native, outside of US (%) - White
Place of birth - Native, outside of US (%) - Black or African American
Place of birth - Native, outside of US (%) - Asian
Place of birth - Native, outside of US (%) - Hispanic or Latino
Place of birth - Native, outside of US (%) - American Indian and Alaska Native
Place of birth - Native, outside of US (%) - Multirace
Place of birth - Native, outside of US (%) - Other Race
Place of birth - Foreign born (%)
Place of birth - Foreign born (%) - White
Place of birth - Foreign born (%) - Black or African American
Place of birth - Foreign born (%) - Asian
Place of birth - Foreign born (%) - Hispanic or Latino
Place of birth - Foreign born (%) - American Indian and Alaska Native
Place of birth - Foreign born (%) - Multirace
Place of birth - Foreign born (%) - Other Race
Residents speaking English at home (%)
Residents speaking English at home - Born in the United States (%)
Residents speaking English at home - Native, born elsewhere (%)
Residents speaking English at home - Foreign born (%)
Residents speaking Spanish at home (%)
Residents speaking Spanish at home - Born in the United States (%)
Residents speaking Spanish at home - Native, born elsewhere (%)
Residents speaking Spanish at home - Foreign born (%)
Residents speaking other language at home (%)
Residents speaking other language at home - Born in the United States (%)
Residents speaking other language at home - Native, born elsewhere (%)
Residents speaking other language at home - Foreign born (%)
Marital status - Never married (%)
Marital status - Now married (%)
Marital status - Separated (%)
Marital status - Widowed (%)
Marital status - Divorced (%)
Ancestries Reported - Arab (%)
Ancestries Reported - Czech (%)
Ancestries Reported - Danish (%)
Ancestries Reported - Dutch (%)
Ancestries Reported - English (%)
Ancestries Reported - French (%)
Ancestries Reported - French Canadian (%)
Ancestries Reported - German (%)
Ancestries Reported - Greek (%)
Ancestries Reported - Hungarian (%)
Ancestries Reported - Irish (%)
Ancestries Reported - Italian (%)
Ancestries Reported - Lithuanian (%)
Ancestries Reported - Norwegian (%)
Ancestries Reported - Polish (%)
Ancestries Reported - Portuguese (%)
Ancestries Reported - Russian (%)
Ancestries Reported - Scotch-Irish (%)
Ancestries Reported - Scottish (%)
Ancestries Reported - Slovak (%)
Ancestries Reported - Subsaharan African (%)
Ancestries Reported - Swedish (%)
Ancestries Reported - Swiss (%)
Ancestries Reported - Ukrainian (%)
Ancestries Reported - United States (%)
Ancestries Reported - Welsh (%)
Ancestries Reported - West Indian (%)
Ancestries Reported - Other (%)
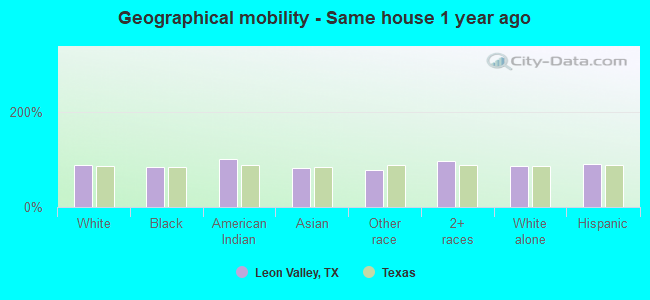
Geographical mobility - Same house 1 year ago (%)
Geographical mobility - Same house 1 year ago (%) - White
Geographical mobility - Same house 1 year ago (%) - Black or African American
Geographical mobility - Same house 1 year ago (%) - Asian
Geographical mobility - Same house 1 year ago (%) - Hispanic or Latino
Geographical mobility - Same house 1 year ago (%) - American Indian and Alaska Native
Geographical mobility - Same house 1 year ago (%) - Multirace
Geographical mobility - Same house 1 year ago (%) - Other Race
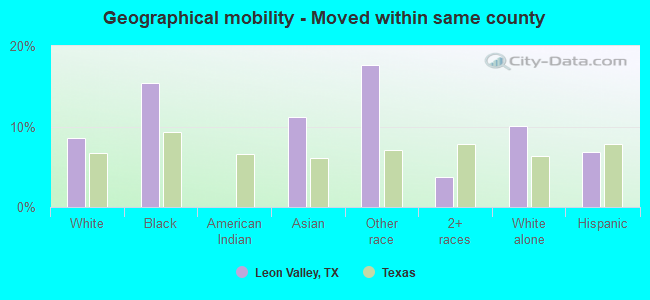
Geographical mobility - Moved within same county (%)
Geographical mobility - Moved within same county (%) - White
Geographical mobility - Moved within same county (%) - Black or African American
Geographical mobility - Moved within same county (%) - Asian
Geographical mobility - Moved within same county (%) - Hispanic or Latino
Geographical mobility - Moved within same county (%) - American Indian and Alaska Native
Geographical mobility - Moved within same county (%) - Multirace
Geographical mobility - Moved within same county (%) - Other Race
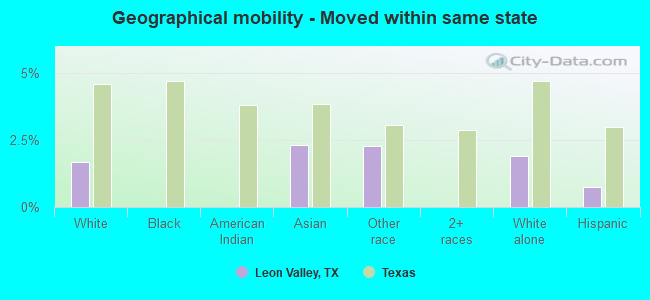
Geographical mobility - Moved from different county within same state (%)
Geographical mobility - Moved from different county within same state (%) - White
Geographical mobility - Moved from different county within same state (%) - Black or African American
Geographical mobility - Moved from different county within same state (%) - Asian
Geographical mobility - Moved from different county within same state (%) - Hispanic or Latino
Geographical mobility - Moved from different county within same state (%) - American Indian and Alaska Native
Geographical mobility - Moved from different county within same state (%) - Multirace
Geographical mobility - Moved from different county within same state (%) - Other Race
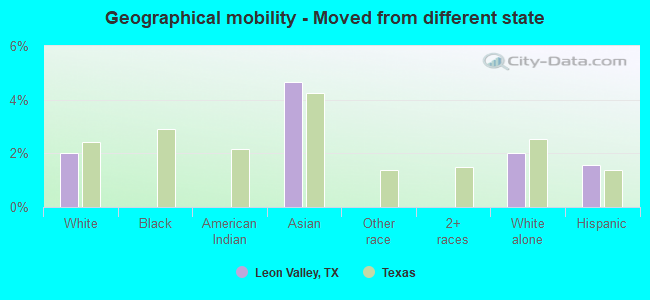
Geographical mobility - Moved from different state (%)
Geographical mobility - Moved from different state (%) - White
Geographical mobility - Moved from different state (%) - Black or African American
Geographical mobility - Moved from different state (%) - Asian
Geographical mobility - Moved from different state (%) - Hispanic or Latino
Geographical mobility - Moved from different state (%) - American Indian and Alaska Native
Geographical mobility - Moved from different state (%) - Multirace
Geographical mobility - Moved from different state (%) - Other Race
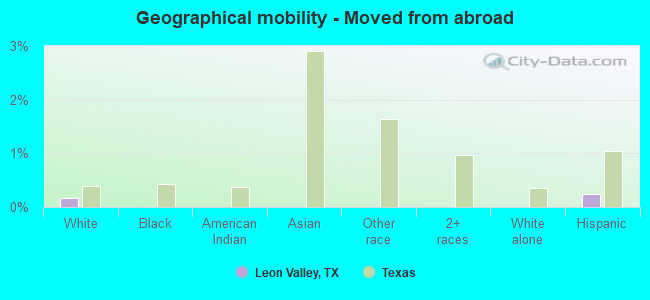
Geographical mobility - Moved from abroad (%)
Geographical mobility - Moved from abroad (%) - White
Geographical mobility - Moved from abroad (%) - Black or African American
Geographical mobility - Moved from abroad (%) - Asian
Geographical mobility - Moved from abroad (%) - Hispanic or Latino
Geographical mobility - Moved from abroad (%) - American Indian and Alaska Native
Geographical mobility - Moved from abroad (%) - Multirace
Geographical mobility - Moved from abroad (%) - Other Race
Place of birth for the foreign-born population - Ireland (%)
Place of birth for the foreign-born population - Denmark (%)
Place of birth for the foreign-born population - Norway (%)
Place of birth for the foreign-born population - Sweden (%)
Place of birth for the foreign-born population - United Kingdom (%)
Place of birth for the foreign-born population - England (%)
Place of birth for the foreign-born population - Scotland (%)
Place of birth for the foreign-born population - Other Northern Europe (%)
Place of birth for the foreign-born population - Austria (%)
Place of birth for the foreign-born population - Belgium (%)
Place of birth for the foreign-born population - France (%)
Place of birth for the foreign-born population - Germany (%)
Place of birth for the foreign-born population - Netherlands (%)
Place of birth for the foreign-born population - Switzerland (%)
Place of birth for the foreign-born population - Other Western Europe (%)
Place of birth for the foreign-born population - Greece (%)
Place of birth for the foreign-born population - Italy (%)
Place of birth for the foreign-born population - Portugal (%)
Place of birth for the foreign-born population - Spain (%)
Place of birth for the foreign-born population - Other Southern Europe (%)
Place of birth for the foreign-born population - Albania (%)
Place of birth for the foreign-born population - Belarus (%)
Place of birth for the foreign-born population - Bosnia and Herzegovina (%)
Place of birth for the foreign-born population - Bulgaria (%)
Place of birth for the foreign-born population - Croatia (%)
Place of birth for the foreign-born population - Czechoslovakia (%)
Place of birth for the foreign-born population - Hungary (%)
Place of birth for the foreign-born population - Latvia (%)
Place of birth for the foreign-born population - Lithuania (%)
Place of birth for the foreign-born population - North Macedonia (Macedonia) (%)
Place of birth for the foreign-born population - Moldova (%)
Place of birth for the foreign-born population - Poland (%)
Place of birth for the foreign-born population - Romania (%)
Place of birth for the foreign-born population - Russia (%)
Place of birth for the foreign-born population - Serbia (%)
Place of birth for the foreign-born population - Ukraine (%)
Place of birth for the foreign-born population - Other Eastern Europe (%)
Place of birth for the foreign-born population - China (%)
Place of birth for the foreign-born population - Hong Kong (%)
Place of birth for the foreign-born population - Taiwan (%)
Place of birth for the foreign-born population - Japan (%)
Place of birth for the foreign-born population - Korea (%)
Place of birth for the foreign-born population - Other Eastern Asia (%)
Place of birth for the foreign-born population - Afghanistan (%)
Place of birth for the foreign-born population - Bangladesh (%)
Place of birth for the foreign-born population - India (%)
Place of birth for the foreign-born population - Iran (%)
Place of birth for the foreign-born population - Kazakhstan (%)
Place of birth for the foreign-born population - Nepal (%)
Place of birth for the foreign-born population - Pakistan (%)
Place of birth for the foreign-born population - Sri Lanka (%)
Place of birth for the foreign-born population - Uzbekistan (%)
Place of birth for the foreign-born population - Other South Central Asia (%)
Place of birth for the foreign-born population - Burma (%)
Place of birth for the foreign-born population - Cambodia (%)
Place of birth for the foreign-born population - Indonesia (%)
Place of birth for the foreign-born population - Laos (%)
Place of birth for the foreign-born population - Malaysia (%)
Place of birth for the foreign-born population - Philippines (%)
Place of birth for the foreign-born population - Singapore (%)
Place of birth for the foreign-born population - Thailand (%)
Place of birth for the foreign-born population - Vietnam (%)
Place of birth for the foreign-born population - Other South Eastern Asia (%)
Place of birth for the foreign-born population - Armenia (%)
Place of birth for the foreign-born population - Iraq (%)
Place of birth for the foreign-born population - Israel (%)
Place of birth for the foreign-born population - Jordan (%)
Place of birth for the foreign-born population - Kuwait (%)
Place of birth for the foreign-born population - Lebanon (%)
Place of birth for the foreign-born population - Saudi Arabia (%)
Place of birth for the foreign-born population - Syria (%)
Place of birth for the foreign-born population - Turkey (%)
Place of birth for the foreign-born population - Yemen (%)
Place of birth for the foreign-born population - Other Western Asia (%)
Place of birth for the foreign-born population - Eritrea (%)
Place of birth for the foreign-born population - Ethiopia (%)
Place of birth for the foreign-born population - Kenya (%)
Place of birth for the foreign-born population - Somalia (%)
Place of birth for the foreign-born population - Uganda (%)
Place of birth for the foreign-born population - Zimbabwe (%)
Place of birth for the foreign-born population - Other Eastern Africa (%)
Place of birth for the foreign-born population - Cameroon (%)
Place of birth for the foreign-born population - Congo (%)
Place of birth for the foreign-born population - Democratic Republic of Congo (Zaire) (%)
Place of birth for the foreign-born population - Other Middle Africa (%)
Place of birth for the foreign-born population - Egypt (%)
Place of birth for the foreign-born population - Morocco (%)
Place of birth for the foreign-born population - Sudan (%)
Place of birth for the foreign-born population - Other Northern Africa (%)
Place of birth for the foreign-born population - South Africa (%)
Place of birth for the foreign-born population - Other Southern Africa (%)
Place of birth for the foreign-born population - Cabo Verde (%)
Place of birth for the foreign-born population - Ghana (%)
Place of birth for the foreign-born population - Liberia (%)
Place of birth for the foreign-born population - Nigeria (%)
Place of birth for the foreign-born population - Senegal (%)
Place of birth for the foreign-born population - Sierra Leone (%)
Place of birth for the foreign-born population - Other Western Africa (%)
Place of birth for the foreign-born population - Australia (%)
Place of birth for the foreign-born population - New Zealand (%)
Place of birth for the foreign-born population - Fiji (%)
Place of birth for the foreign-born population - Micronesia (%)
Place of birth for the foreign-born population - Bahamas (%)
Place of birth for the foreign-born population - Barbados (%)
Place of birth for the foreign-born population - Cuba (%)
Place of birth for the foreign-born population - Dominica (%)
Place of birth for the foreign-born population - Dominican Republic (%)
Place of birth for the foreign-born population - Grenada (%)
Place of birth for the foreign-born population - Haiti (%)
Place of birth for the foreign-born population - Jamaica (%)
Place of birth for the foreign-born population - St. Vincent and the Grenadines (%)
Place of birth for the foreign-born population - Trinidad and Tobago (%)
Place of birth for the foreign-born population - West Indies (%)
Place of birth for the foreign-born population - Other Caribbean (%)
Place of birth for the foreign-born population - Belize (%)
Place of birth for the foreign-born population - Costa Rica (%)
Place of birth for the foreign-born population - El Salvador (%)
Place of birth for the foreign-born population - Guatemala (%)
Place of birth for the foreign-born population - Honduras (%)
Place of birth for the foreign-born population - Mexico (%)
Place of birth for the foreign-born population - Nicaragua (%)
Place of birth for the foreign-born population - Panama (%)
Place of birth for the foreign-born population - Other Central America (%)
Place of birth for the foreign-born population - Argentina (%)
Place of birth for the foreign-born population - Bolivia (%)
Place of birth for the foreign-born population - Brazil (%)
Place of birth for the foreign-born population - Chile (%)
Place of birth for the foreign-born population - Colombia (%)
Place of birth for the foreign-born population - Ecuador (%)
Place of birth for the foreign-born population - Guyana (%)
Place of birth for the foreign-born population - Peru (%)
Place of birth for the foreign-born population - Uruguay (%)
Place of birth for the foreign-born population - Venezuela (%)
Place of birth for the foreign-born population - Other South America (%)
Place of birth for the foreign-born population - Canada (%)
Place of birth for the foreign-born population - Other Northern America (%)
Place of birth for the foreign-born population - Other (%)
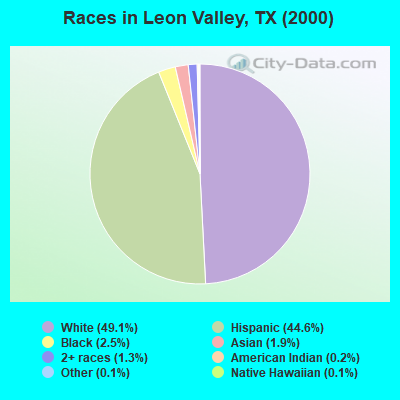
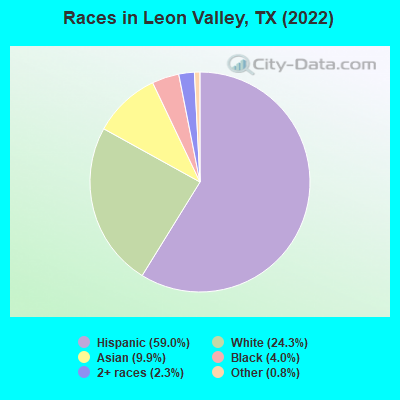
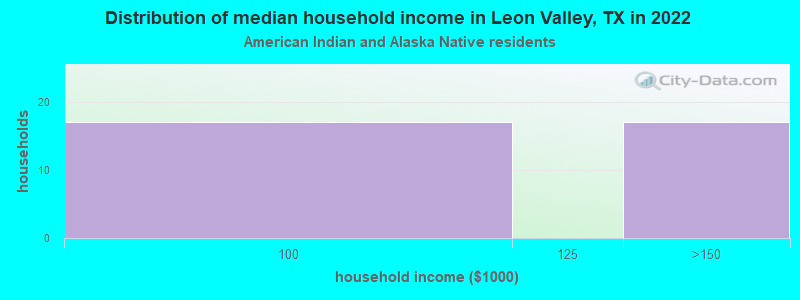
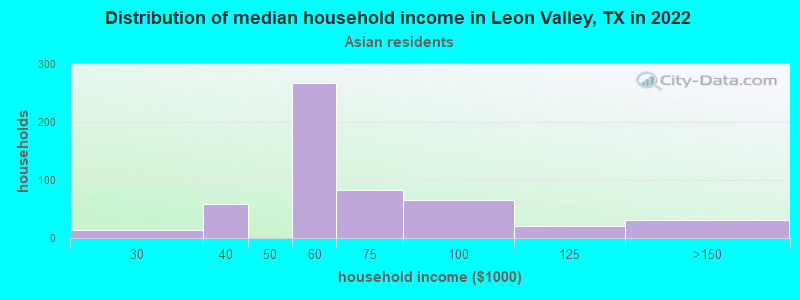
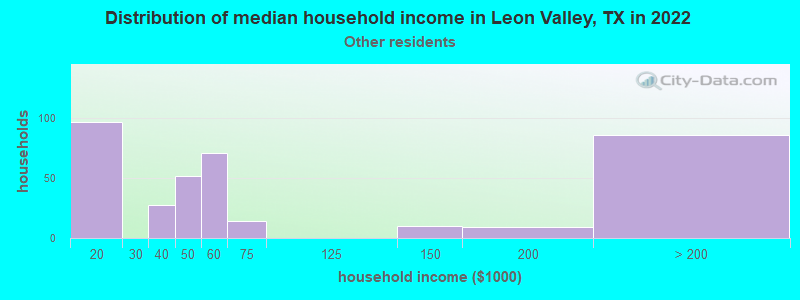
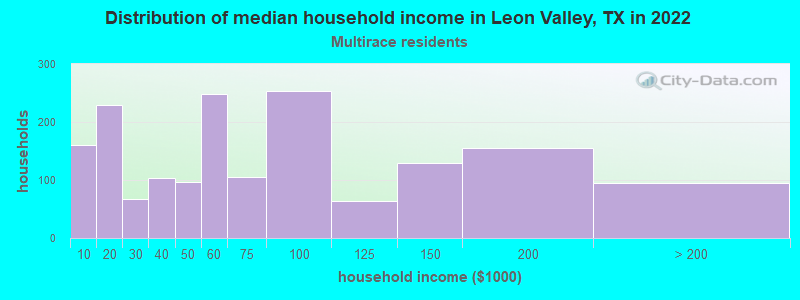
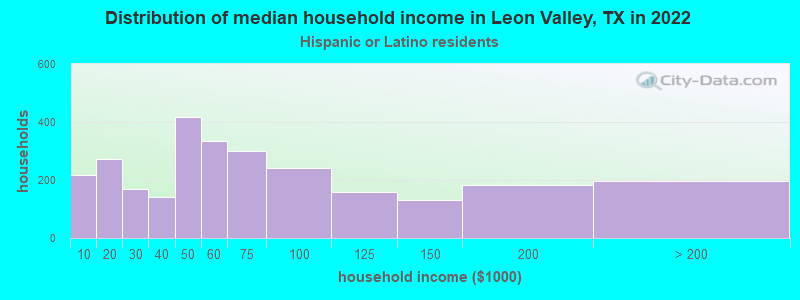
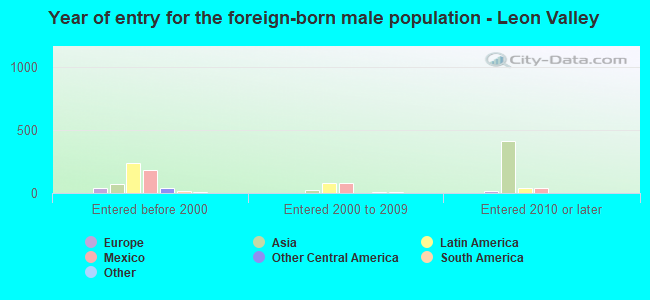
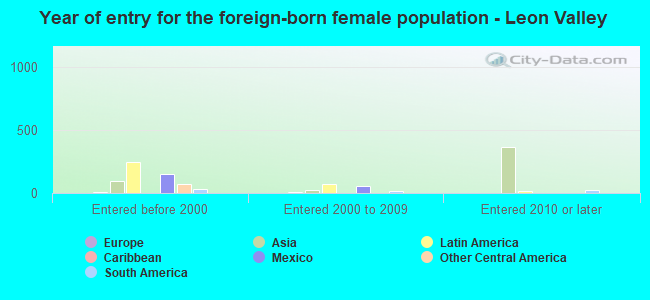
According to 2022 data, the most numerous races in Leon Valley, TX are Hispanic (6,928 residents), White alone (2,849 residents), and Black alone (473 residents). 62.5% of Leon Valley residents speak English at home. 14.7% of Leon Valley, TX residents are foreign-born (7.2% born in Asia, 6.4% born in Latin America), which is 16.0% less than the foreign-born rate of 17.0% across the entire state of Texas.
Race distribution in Leon Valley
2000 2022
10,933,313 52.4% White alone 6,669,666 32.0% Hispanic 2,364,255 11.3% Black alone 554,445 2.7% Asian alone 230,567 1.1% Two or more races 68,859 0.3% American Indian alone 19,958 0.10% Other race alone 10,757 0.05% Native Hawaiian and Other
12,070,642 40.2% Hispanic 11,683,430 38.9% White alone 3,508,706 11.7% Black alone 1,608,173 5.4% Asian alone 956,560 3.2% Two or more races 125,763 0.4% Other race alone 47,023 0.2% American Indian alone 29,275 0.10% Native Hawaiian and Other
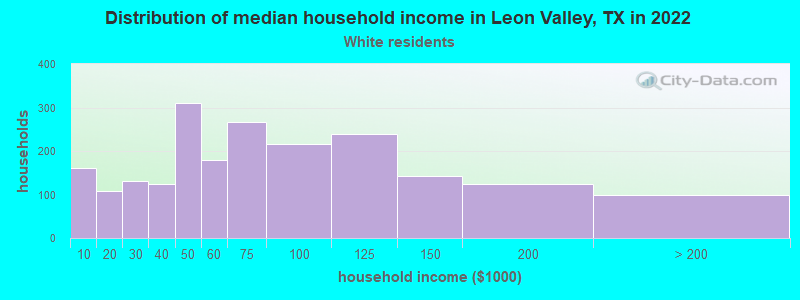
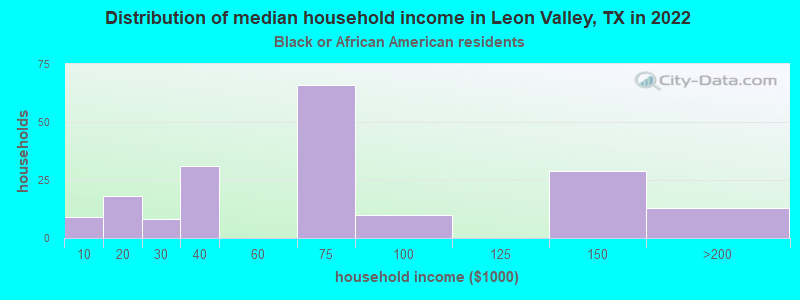
Income and house value in Leon Valley Median household income in 2022 $65,666 White non-Hispanic householders$68,834 Black householders$52,860 Asian householders$50,836 Some other race householders$55,661 Two or more races householders$54,030 Hispanic or Latino race householdersMedian 2022 house value $249,024 White Non-Hispanic householders$274,128 Black or African American householders$230,845 American Indian or Alaska Native householders $295,193 Asian householders$242,675 Some other race householders$240,367 Two or more races householders$256,526 Hispanic or Latino householders
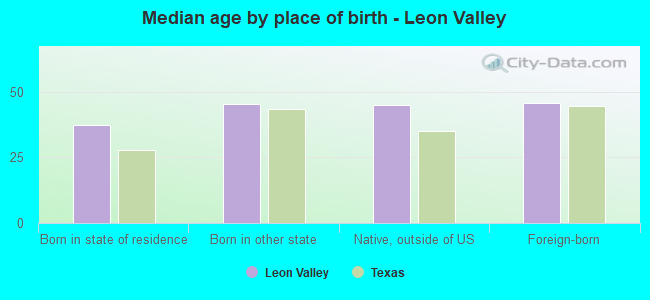
Median age by race in Leon Valley
43.5 Median age for White residents41.4 50.8 22.5 Median age for Black or African American residents38.9 21.0 41.2 Median age for American Indian / Alaska Native residents21.4 42.2 33.2 Median age for Asian residents34.1 27.3 -674,441,204.4 Median age for Native Hawaiian / Pacific Islander residents-596,986,816.7 -748,387,096.0 40.5 Median age for Other race residents41.0 38.1 38.1 Median age for Two or more races residents41.8 37.6 51.6 Median age for White alone residents46.7 55.8 39.1 Median age for Hispanic or Latino residents40.7 37.5
Owner/renter occupied households by race in Leon Valley
House owners and renters - White residents 1,256 59.4% Owner occupied859 40.6% Renter occupiedHouse owners and renters - Black or African American residents 45 23.1% Owner occupied151 76.9% Renter occupiedHouse owners and renters - American Indian / Alaska Native residents 33 100.0% Owner occupiedHouse owners and renters - Asian residents 101 22.7% Owner occupied345 77.3% Renter occupiedHouse owners and renters - Other race residents 159 45.9% Owner occupied187 54.1% Renter occupiedHouse owners and renters - Two or more races residents 1,222 73.1% Owner occupied449 26.9% Renter occupiedHouse owners and renters - White alone residents 899 67.0% Owner occupied443 33.0% Renter occupiedHouse owners and renters - Hispanic or Latino residents 1,565 57.5% Owner occupied1,155 42.5% Renter occupied
Language usage in Leon Valley
English speakers - Total 62.5% of residents of Leon Valley speak English at home.
28.7% of residents speak Spanish at home 2,364 74.1% Speak English very well826 25.9% Speak English less than very well9.3% of residents speak other language at home 382 36.9% Speak English very well654 63.1% Speak English less than very well
English speakers - Born in the United States 88.6% of residents of Leon Valley speak English at home.
10.3% of residents speak Spanish at home 181 88.3% Speak English very well24 11.7% Speak English less than very well1.4% of residents speak other language at home 28 100.0% Speak English very well
English speakers - Native, born elsewhere 70.7% of residents of Leon Valley speak English at home.
24.7% of residents speak Spanish at home 11 22.4% Speak English very well38 77.6% Speak English less than very well
English speakers - Foreign-born 14.1% of residents of Leon Valley speak English at home.
38.5% of residents speak Spanish at home 393 61.0% Speak English very well251 39.0% Speak English less than very well51.8% of residents speak other language at home 201 23.2% Speak English very well665 76.8% Speak English less than very well
White (Caucasian) - Speak only English Native:
86.5% (3,831)Foreign-born:
44.4% (63)
White (Caucasian) - Speak another language Native:
15.1% (667)Foreign-born:
67.1% (96)
American Indian / Alaska Native - Speak another language Native:
17.4% (18)Foreign-born:
93.0% (4)
Asian - Speak only English Native:
79.8% (122)Foreign-born:
8.8% (76)
Asian - Speak another language Native:
23.6% (36)Foreign-born:
90.4% (780)
Other race - Speak another language Native:
66.3% (520)Foreign-born:
100.0% (136)
Two or more races - Speak only English Native:
55.1% (2,023)Foreign-born:
17.7% (124)
Two or more races - Speak another language Native:
45.0% (1,653)Foreign-born:
81.6% (573)
White alone - Speak only English Native:
95.1% (2,479)Foreign-born:
67.7% (69)
White alone - Speak another language Native:
4.9% (127)Foreign-born:
31.4% (32)
Hispanic or Latino - Speak only English Native:
59.1% (3,574)Foreign-born:
12.8% (95)
Hispanic or Latino - Speak another language Native:
41.1% (2,488)Foreign-born:
87.7% (654)
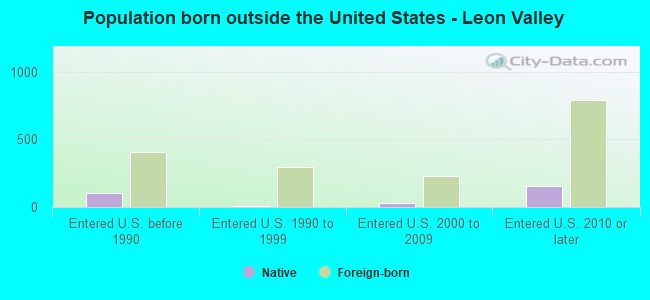
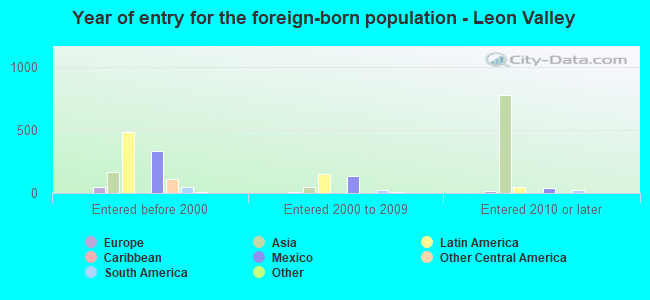
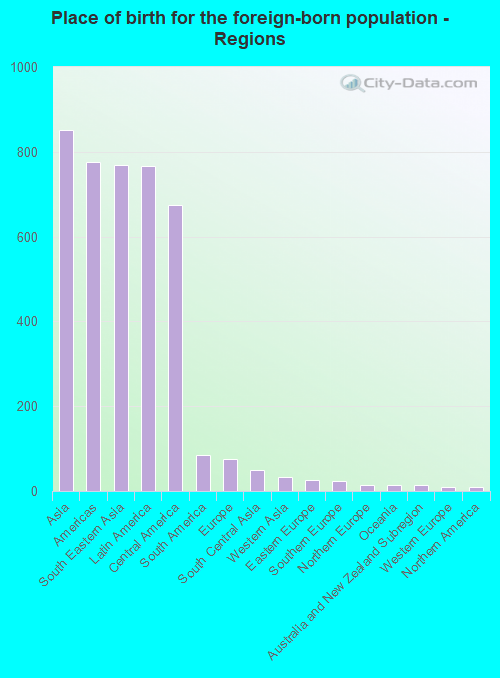
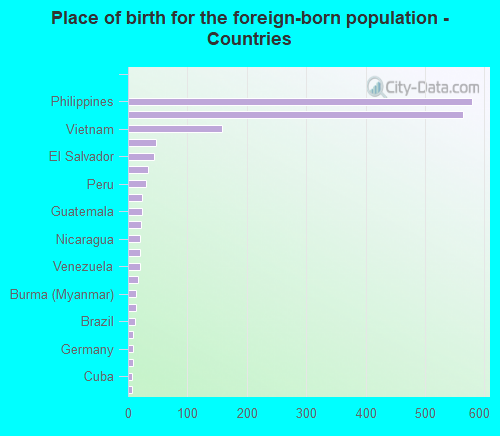
Foreign-born residents in Leon Valley 1,721 residents are foreign born (7.2% Asia , 6.4% Latin America ).
This city:
14.7%Texas:
17.1%
Marital status for residents in Leon Valley Marital status - White (Caucasian) population 15 years and over
Males 37.5% Never married40.5% Now married3.9% Separated3.2% Widowed15.0% DivorcedFemales 30.1% Never married38.0% Now married1.6% Separated12.5% Widowed17.7% DivorcedWomen who gave birth in the past 12 months Now married:
68.0% (12)Unmarried:
32.0% (6)
Women who did not give birth in the past 12 months Now married:
30.0% (265)Unmarried:
70.0% (618)
Marital status - Black or African American population 15 years and over
Males 25.3% Never married74.7% Now married0.0% Separated0.0% Widowed0.0% DivorcedFemales 53.5% Never married42.9% Now married0.0% Separated3.7% Widowed0.0% DivorcedWomen who gave birth in the past 12 months Now married:
0.0% (0)Unmarried:
100.0% (35)
Women who did not give birth in the past 12 months Now married:
20.8% (22)Unmarried:
79.2% (83)
Marital status - American Indian / Alaska Native population 15 years and over
Males 44.0% Never married12.0% Now married0.0% Separated44.0% Widowed0.0% DivorcedFemales 3.2% Never married96.8% Now married0.0% Separated0.0% Widowed0.0% DivorcedWomen who gave birth in the past 12 months Now married:
100.0% (27)Unmarried:
0.0% (0)
Women who did not give birth in the past 12 months Now married:
91.7% (16)Unmarried:
8.3% (1)
Marital status - Asian population 15 years and over
Males 5.5% Never married84.1% Now married0.0% Separated0.0% Widowed10.5% DivorcedFemales 12.9% Never married68.6% Now married6.8% Separated3.2% Widowed8.6% DivorcedWomen who gave birth in the past 12 months Now married:
100.0% (194)Unmarried:
0.0% (0)
Women who did not give birth in the past 12 months Now married:
50.3% (76)Unmarried:
49.7% (75)
Marital status - Other race population 15 years and over
Males 30.3% Never married58.3% Now married6.9% Separated0.0% Widowed4.5% DivorcedFemales 25.7% Never married66.2% Now married0.0% Separated2.4% Widowed5.7% DivorcedWomen who gave birth in the past 12 months Now married:
100.0% (43)Unmarried:
0.0% (0)
Women who did not give birth in the past 12 months Now married:
60.7% (162)Unmarried:
39.3% (105)
Marital status - Two or more races population 15 years and over
Males 38.8% Never married45.3% Now married0.0% Separated3.0% Widowed12.9% DivorcedFemales 50.4% Never married29.4% Now married0.6% Separated7.4% Widowed12.2% DivorcedWomen who gave birth in the past 12 months Now married:
100.0% (83)Unmarried:
0.0% (0)
Women who did not give birth in the past 12 months Now married:
19.8% (249)Unmarried:
80.2% (1,009)
Marital status - White alone, not Hispanic / Latino population 15 years and over
Males 24.7% Never married56.4% Now married0.1% Separated2.8% Widowed16.1% DivorcedFemales 27.7% Never married37.1% Now married0.6% Separated16.4% Widowed18.2% DivorcedWomen who gave birth in the past 12 months Now married:
100.0% (17)Unmarried:
0.0% (0)
Women who did not give birth in the past 12 months Now married:
33.3% (160)Unmarried:
66.7% (319)
Marital status - Hispanic or Latino population 15 years and over
Males 41.5% Never married37.5% Now married4.5% Separated3.0% Widowed13.6% DivorcedFemales 39.7% Never married37.1% Now married1.5% Separated7.6% Widowed14.1% DivorcedWomen who gave birth in the past 12 months Now married:
86.2% (51)Unmarried:
13.8% (8)
Women who did not give birth in the past 12 months Now married:
28.1% (497)Unmarried:
71.9% (1,274)
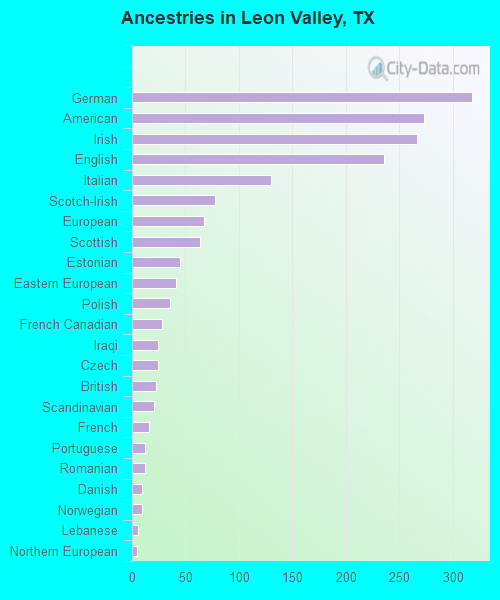
Ancestries in Leon Valley
318 4.2% German273 3.6% American267 3.5% Irish236 3.1% English130 1.7% Italian78 1.0% Scotch-Irish67 0.9% European64 0.8% Scottish45 0.6% Estonian41 0.5% Eastern European36 0.5% Polish28 0.4% French Canadian24 0.3% Iraqi24 0.3% Czech22 0.3% British21 0.3% Scandinavian16 0.2% French12 0.2% Portuguese12 0.2% Romanian9 0.1% Danish9 0.1% Norwegian6 0.08% Lebanese5 0.07% Northern European
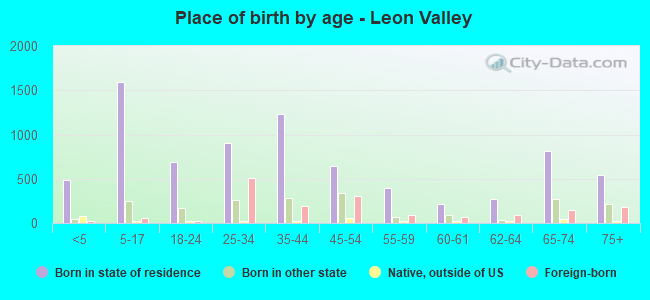
Children Nativity (place of birth) in Leon Valley
Children under 6 years - Living with two parents Both parents native 347 100.0% NativeBoth parents foreign-born 232 100.0% NativeOne native, one foreign-born parent 40 100.0% NativeChildren under 6 years - Living with one parent Native parent 143 100.0% NativeForeign-born parent 23 100.0% NativeChildren 6 to 17 years - Living with two parents Both parents native 330 100.0% NativeBoth parents foreign-born 93 70.5% Native39 29.5% Foreign-bornOne native, one foreign-born parent 193 100.0% NativeChildren 6 to 17 years - Living with one parent Native parent 813 100.0% NativeForeign-born parent 107 55.0% Native88 45.0% Foreign-born
Grandparents responsible for own grandchildren in Leon Valley
Grandparents (30 to 59 years) White / Caucasian 24 66.5% Responsible for grandchildren12 33.5% Not responsible for grandchildrenTwo or more races 51 100.0% Responsible for grandchildrenHispanic or Latino 69 82.7% Responsible for grandchildren14 17.3% Not responsible for grandchildrenGrandparents (60 years and over) White / Caucasian 34 31.8% Responsible for grandchildren73 68.2% Not responsible for grandchildrenHispanic or Latino 56 43.3% Responsible for grandchildren73 56.7% Not responsible for grandchildren