Races in Leominster, Massachusetts (MA) Detailed Stats
Data:
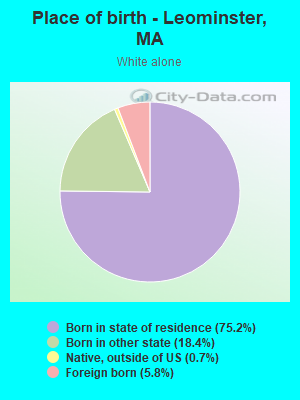
Races - White alone (%)
Races - White alone (% change since 2000)
Races - Black alone (%)
Races - Black alone (% change since 2000)
Races - American Indian alone (%)
Races - American Indian alone (% change since 2000)
Races - Asian alone (%)
Races - Asian alone (% change since 2000)
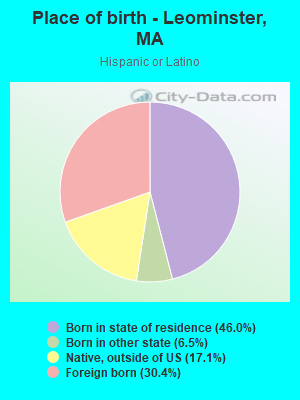
Races - Hispanic (%)
Races - Hispanic (% change since 2000)
Races - Native Hawaiian and Other Pacific Islander alone (%)
Races - Native Hawaiian and Other Pacific Islander alone (% change since 2000)
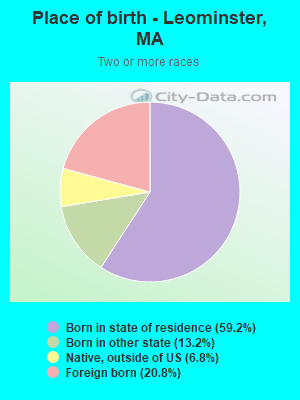
Races - Two or more races(%)
Races - Two or more races(% change since 2000)
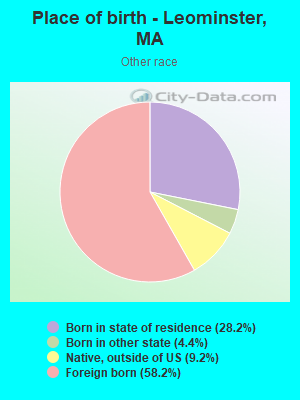
Races - Other race alone (%)
Races - Other race alone (% change since 2000)
Racial diversity
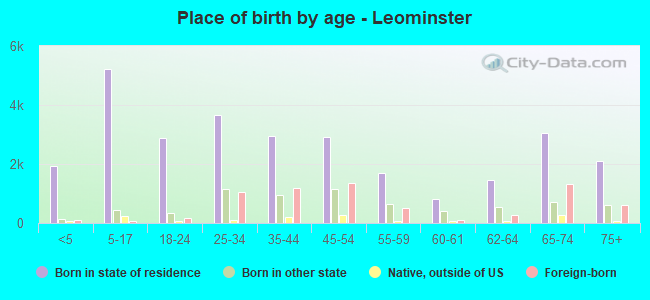
Place of birth - Born in state of residence (%)
Place of birth - Born in state of residence (%) - White
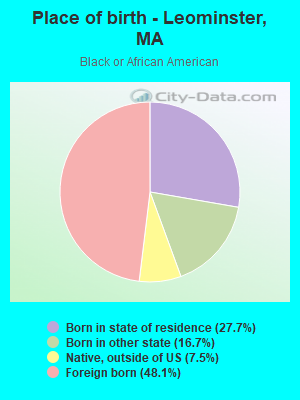
Place of birth - Born in state of residence (%) - Black or African American
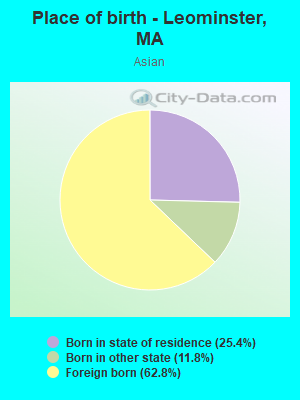
Place of birth - Born in state of residence (%) - Asian
Place of birth - Born in state of residence (%) - Hispanic or Latino
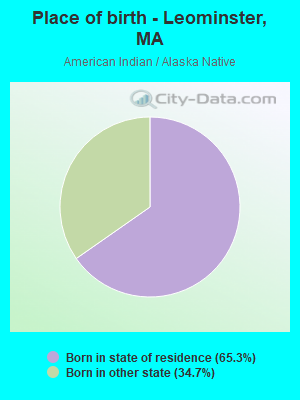
Place of birth - Born in state of residence (%) - American Indian and Alaska Native
Place of birth - Born in state of residence (%) - Multirace
Place of birth - Born in state of residence (%) - Other Race
Place of birth - Born in other state (%)
Place of birth - Born in other state (%) - White
Place of birth - Born in other state (%) - Black or African American
Place of birth - Born in other state (%) - Asian
Place of birth - Born in other state (%) - Hispanic or Latino
Place of birth - Born in other state (%) - American Indian and Alaska Native
Place of birth - Born in other state (%) - Multirace
Place of birth - Born in other state (%) - Other Race
Place of birth - Native, outside of US (%)
Place of birth - Native, outside of US (%) - White
Place of birth - Native, outside of US (%) - Black or African American
Place of birth - Native, outside of US (%) - Asian
Place of birth - Native, outside of US (%) - Hispanic or Latino
Place of birth - Native, outside of US (%) - American Indian and Alaska Native
Place of birth - Native, outside of US (%) - Multirace
Place of birth - Native, outside of US (%) - Other Race
Place of birth - Foreign born (%)
Place of birth - Foreign born (%) - White
Place of birth - Foreign born (%) - Black or African American
Place of birth - Foreign born (%) - Asian
Place of birth - Foreign born (%) - Hispanic or Latino
Place of birth - Foreign born (%) - American Indian and Alaska Native
Place of birth - Foreign born (%) - Multirace
Place of birth - Foreign born (%) - Other Race
Residents speaking English at home (%)
Residents speaking English at home - Born in the United States (%)
Residents speaking English at home - Native, born elsewhere (%)
Residents speaking English at home - Foreign born (%)
Residents speaking Spanish at home (%)
Residents speaking Spanish at home - Born in the United States (%)
Residents speaking Spanish at home - Native, born elsewhere (%)
Residents speaking Spanish at home - Foreign born (%)
Residents speaking other language at home (%)
Residents speaking other language at home - Born in the United States (%)
Residents speaking other language at home - Native, born elsewhere (%)
Residents speaking other language at home - Foreign born (%)
Marital status - Never married (%)
Marital status - Now married (%)
Marital status - Separated (%)
Marital status - Widowed (%)
Marital status - Divorced (%)
Ancestries Reported - Arab (%)
Ancestries Reported - Czech (%)
Ancestries Reported - Danish (%)
Ancestries Reported - Dutch (%)
Ancestries Reported - English (%)
Ancestries Reported - French (%)
Ancestries Reported - French Canadian (%)
Ancestries Reported - German (%)
Ancestries Reported - Greek (%)
Ancestries Reported - Hungarian (%)
Ancestries Reported - Irish (%)
Ancestries Reported - Italian (%)
Ancestries Reported - Lithuanian (%)
Ancestries Reported - Norwegian (%)
Ancestries Reported - Polish (%)
Ancestries Reported - Portuguese (%)
Ancestries Reported - Russian (%)
Ancestries Reported - Scotch-Irish (%)
Ancestries Reported - Scottish (%)
Ancestries Reported - Slovak (%)
Ancestries Reported - Subsaharan African (%)
Ancestries Reported - Swedish (%)
Ancestries Reported - Swiss (%)
Ancestries Reported - Ukrainian (%)
Ancestries Reported - United States (%)
Ancestries Reported - Welsh (%)
Ancestries Reported - West Indian (%)
Ancestries Reported - Other (%)
Geographical mobility - Same house 1 year ago (%)
Geographical mobility - Same house 1 year ago (%) - White
Geographical mobility - Same house 1 year ago (%) - Black or African American
Geographical mobility - Same house 1 year ago (%) - Asian
Geographical mobility - Same house 1 year ago (%) - Hispanic or Latino
Geographical mobility - Same house 1 year ago (%) - American Indian and Alaska Native
Geographical mobility - Same house 1 year ago (%) - Multirace
Geographical mobility - Same house 1 year ago (%) - Other Race
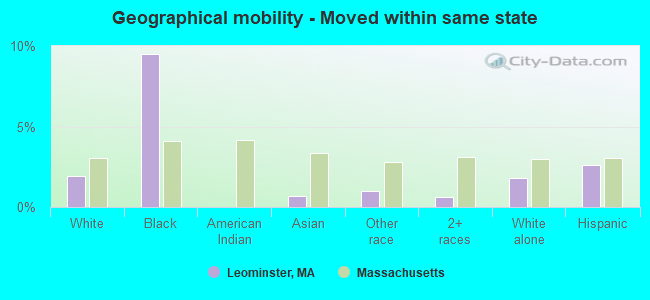
Geographical mobility - Moved within same county (%)
Geographical mobility - Moved within same county (%) - White
Geographical mobility - Moved within same county (%) - Black or African American
Geographical mobility - Moved within same county (%) - Asian
Geographical mobility - Moved within same county (%) - Hispanic or Latino
Geographical mobility - Moved within same county (%) - American Indian and Alaska Native
Geographical mobility - Moved within same county (%) - Multirace
Geographical mobility - Moved within same county (%) - Other Race
Geographical mobility - Moved from different county within same state (%)
Geographical mobility - Moved from different county within same state (%) - White
Geographical mobility - Moved from different county within same state (%) - Black or African American
Geographical mobility - Moved from different county within same state (%) - Asian
Geographical mobility - Moved from different county within same state (%) - Hispanic or Latino
Geographical mobility - Moved from different county within same state (%) - American Indian and Alaska Native
Geographical mobility - Moved from different county within same state (%) - Multirace
Geographical mobility - Moved from different county within same state (%) - Other Race
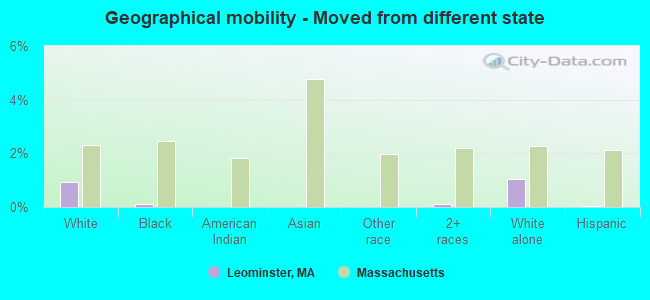
Geographical mobility - Moved from different state (%)
Geographical mobility - Moved from different state (%) - White
Geographical mobility - Moved from different state (%) - Black or African American
Geographical mobility - Moved from different state (%) - Asian
Geographical mobility - Moved from different state (%) - Hispanic or Latino
Geographical mobility - Moved from different state (%) - American Indian and Alaska Native
Geographical mobility - Moved from different state (%) - Multirace
Geographical mobility - Moved from different state (%) - Other Race
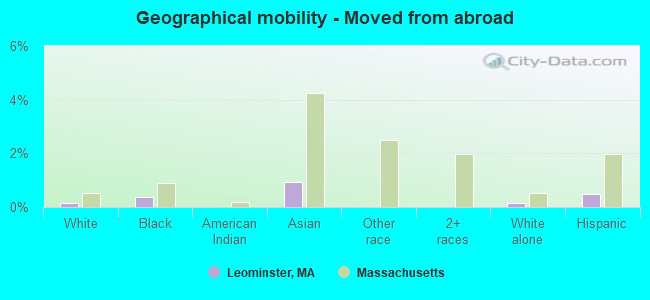
Geographical mobility - Moved from abroad (%)
Geographical mobility - Moved from abroad (%) - White
Geographical mobility - Moved from abroad (%) - Black or African American
Geographical mobility - Moved from abroad (%) - Asian
Geographical mobility - Moved from abroad (%) - Hispanic or Latino
Geographical mobility - Moved from abroad (%) - American Indian and Alaska Native
Geographical mobility - Moved from abroad (%) - Multirace
Geographical mobility - Moved from abroad (%) - Other Race
Place of birth for the foreign-born population - Ireland (%)
Place of birth for the foreign-born population - Denmark (%)
Place of birth for the foreign-born population - Norway (%)
Place of birth for the foreign-born population - Sweden (%)
Place of birth for the foreign-born population - United Kingdom (%)
Place of birth for the foreign-born population - England (%)
Place of birth for the foreign-born population - Scotland (%)
Place of birth for the foreign-born population - Other Northern Europe (%)
Place of birth for the foreign-born population - Austria (%)
Place of birth for the foreign-born population - Belgium (%)
Place of birth for the foreign-born population - France (%)
Place of birth for the foreign-born population - Germany (%)
Place of birth for the foreign-born population - Netherlands (%)
Place of birth for the foreign-born population - Switzerland (%)
Place of birth for the foreign-born population - Other Western Europe (%)
Place of birth for the foreign-born population - Greece (%)
Place of birth for the foreign-born population - Italy (%)
Place of birth for the foreign-born population - Portugal (%)
Place of birth for the foreign-born population - Spain (%)
Place of birth for the foreign-born population - Other Southern Europe (%)
Place of birth for the foreign-born population - Albania (%)
Place of birth for the foreign-born population - Belarus (%)
Place of birth for the foreign-born population - Bosnia and Herzegovina (%)
Place of birth for the foreign-born population - Bulgaria (%)
Place of birth for the foreign-born population - Croatia (%)
Place of birth for the foreign-born population - Czechoslovakia (%)
Place of birth for the foreign-born population - Hungary (%)
Place of birth for the foreign-born population - Latvia (%)
Place of birth for the foreign-born population - Lithuania (%)
Place of birth for the foreign-born population - North Macedonia (Macedonia) (%)
Place of birth for the foreign-born population - Moldova (%)
Place of birth for the foreign-born population - Poland (%)
Place of birth for the foreign-born population - Romania (%)
Place of birth for the foreign-born population - Russia (%)
Place of birth for the foreign-born population - Serbia (%)
Place of birth for the foreign-born population - Ukraine (%)
Place of birth for the foreign-born population - Other Eastern Europe (%)
Place of birth for the foreign-born population - China (%)
Place of birth for the foreign-born population - Hong Kong (%)
Place of birth for the foreign-born population - Taiwan (%)
Place of birth for the foreign-born population - Japan (%)
Place of birth for the foreign-born population - Korea (%)
Place of birth for the foreign-born population - Other Eastern Asia (%)
Place of birth for the foreign-born population - Afghanistan (%)
Place of birth for the foreign-born population - Bangladesh (%)
Place of birth for the foreign-born population - India (%)
Place of birth for the foreign-born population - Iran (%)
Place of birth for the foreign-born population - Kazakhstan (%)
Place of birth for the foreign-born population - Nepal (%)
Place of birth for the foreign-born population - Pakistan (%)
Place of birth for the foreign-born population - Sri Lanka (%)
Place of birth for the foreign-born population - Uzbekistan (%)
Place of birth for the foreign-born population - Other South Central Asia (%)
Place of birth for the foreign-born population - Burma (%)
Place of birth for the foreign-born population - Cambodia (%)
Place of birth for the foreign-born population - Indonesia (%)
Place of birth for the foreign-born population - Laos (%)
Place of birth for the foreign-born population - Malaysia (%)
Place of birth for the foreign-born population - Philippines (%)
Place of birth for the foreign-born population - Singapore (%)
Place of birth for the foreign-born population - Thailand (%)
Place of birth for the foreign-born population - Vietnam (%)
Place of birth for the foreign-born population - Other South Eastern Asia (%)
Place of birth for the foreign-born population - Armenia (%)
Place of birth for the foreign-born population - Iraq (%)
Place of birth for the foreign-born population - Israel (%)
Place of birth for the foreign-born population - Jordan (%)
Place of birth for the foreign-born population - Kuwait (%)
Place of birth for the foreign-born population - Lebanon (%)
Place of birth for the foreign-born population - Saudi Arabia (%)
Place of birth for the foreign-born population - Syria (%)
Place of birth for the foreign-born population - Turkey (%)
Place of birth for the foreign-born population - Yemen (%)
Place of birth for the foreign-born population - Other Western Asia (%)
Place of birth for the foreign-born population - Eritrea (%)
Place of birth for the foreign-born population - Ethiopia (%)
Place of birth for the foreign-born population - Kenya (%)
Place of birth for the foreign-born population - Somalia (%)
Place of birth for the foreign-born population - Uganda (%)
Place of birth for the foreign-born population - Zimbabwe (%)
Place of birth for the foreign-born population - Other Eastern Africa (%)
Place of birth for the foreign-born population - Cameroon (%)
Place of birth for the foreign-born population - Congo (%)
Place of birth for the foreign-born population - Democratic Republic of Congo (Zaire) (%)
Place of birth for the foreign-born population - Other Middle Africa (%)
Place of birth for the foreign-born population - Egypt (%)
Place of birth for the foreign-born population - Morocco (%)
Place of birth for the foreign-born population - Sudan (%)
Place of birth for the foreign-born population - Other Northern Africa (%)
Place of birth for the foreign-born population - South Africa (%)
Place of birth for the foreign-born population - Other Southern Africa (%)
Place of birth for the foreign-born population - Cabo Verde (%)
Place of birth for the foreign-born population - Ghana (%)
Place of birth for the foreign-born population - Liberia (%)
Place of birth for the foreign-born population - Nigeria (%)
Place of birth for the foreign-born population - Senegal (%)
Place of birth for the foreign-born population - Sierra Leone (%)
Place of birth for the foreign-born population - Other Western Africa (%)
Place of birth for the foreign-born population - Australia (%)
Place of birth for the foreign-born population - New Zealand (%)
Place of birth for the foreign-born population - Fiji (%)
Place of birth for the foreign-born population - Micronesia (%)
Place of birth for the foreign-born population - Bahamas (%)
Place of birth for the foreign-born population - Barbados (%)
Place of birth for the foreign-born population - Cuba (%)
Place of birth for the foreign-born population - Dominica (%)
Place of birth for the foreign-born population - Dominican Republic (%)
Place of birth for the foreign-born population - Grenada (%)
Place of birth for the foreign-born population - Haiti (%)
Place of birth for the foreign-born population - Jamaica (%)
Place of birth for the foreign-born population - St. Vincent and the Grenadines (%)
Place of birth for the foreign-born population - Trinidad and Tobago (%)
Place of birth for the foreign-born population - West Indies (%)
Place of birth for the foreign-born population - Other Caribbean (%)
Place of birth for the foreign-born population - Belize (%)
Place of birth for the foreign-born population - Costa Rica (%)
Place of birth for the foreign-born population - El Salvador (%)
Place of birth for the foreign-born population - Guatemala (%)
Place of birth for the foreign-born population - Honduras (%)
Place of birth for the foreign-born population - Mexico (%)
Place of birth for the foreign-born population - Nicaragua (%)
Place of birth for the foreign-born population - Panama (%)
Place of birth for the foreign-born population - Other Central America (%)
Place of birth for the foreign-born population - Argentina (%)
Place of birth for the foreign-born population - Bolivia (%)
Place of birth for the foreign-born population - Brazil (%)
Place of birth for the foreign-born population - Chile (%)
Place of birth for the foreign-born population - Colombia (%)
Place of birth for the foreign-born population - Ecuador (%)
Place of birth for the foreign-born population - Guyana (%)
Place of birth for the foreign-born population - Peru (%)
Place of birth for the foreign-born population - Uruguay (%)
Place of birth for the foreign-born population - Venezuela (%)
Place of birth for the foreign-born population - Other South America (%)
Place of birth for the foreign-born population - Canada (%)
Place of birth for the foreign-born population - Other Northern America (%)
Place of birth for the foreign-born population - Other (%)
Latest news about races in Leominster, MA collected exclusively by city-data.com from local newspapers, TV, and radio stations
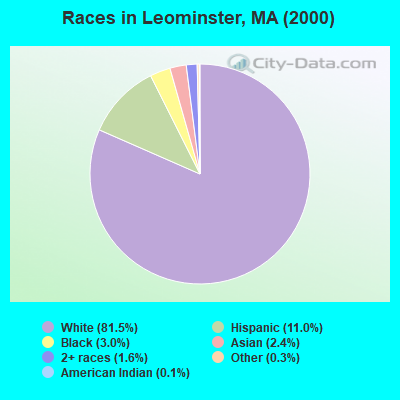
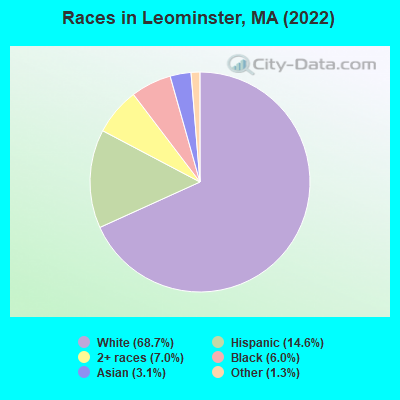
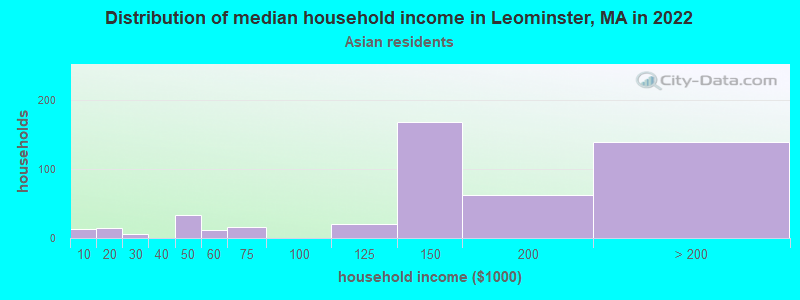
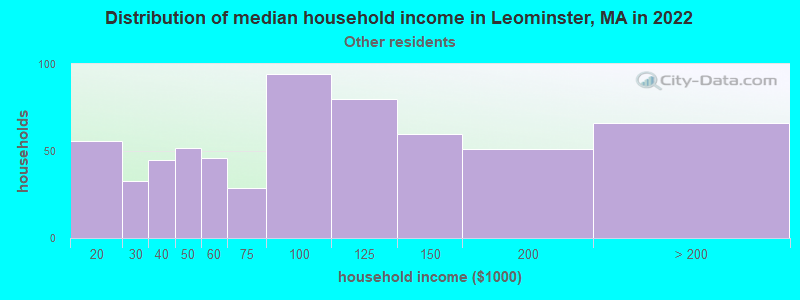
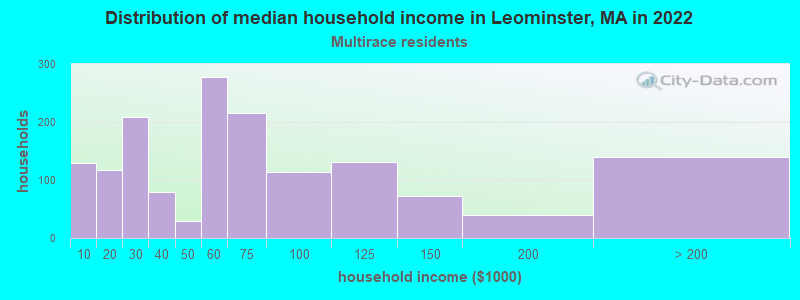
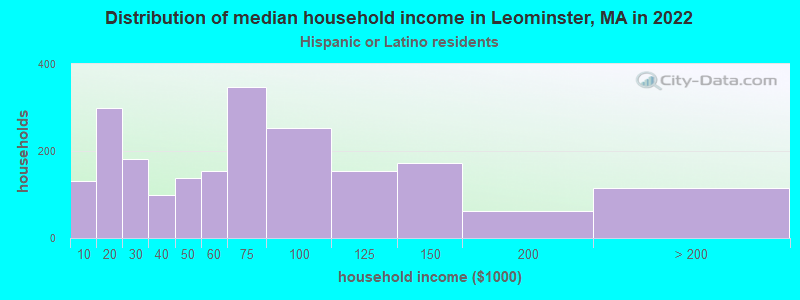
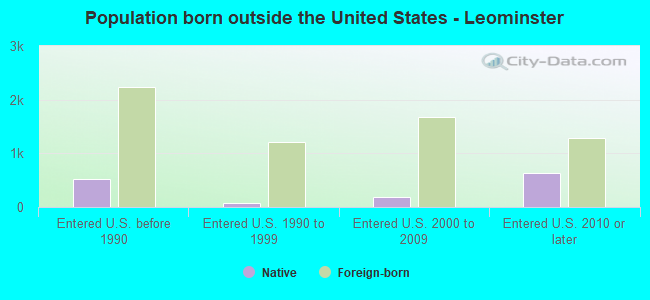
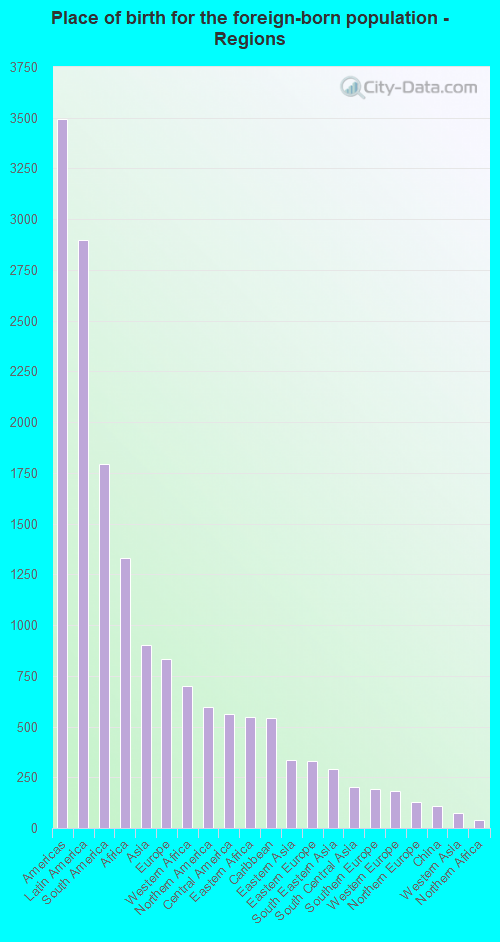
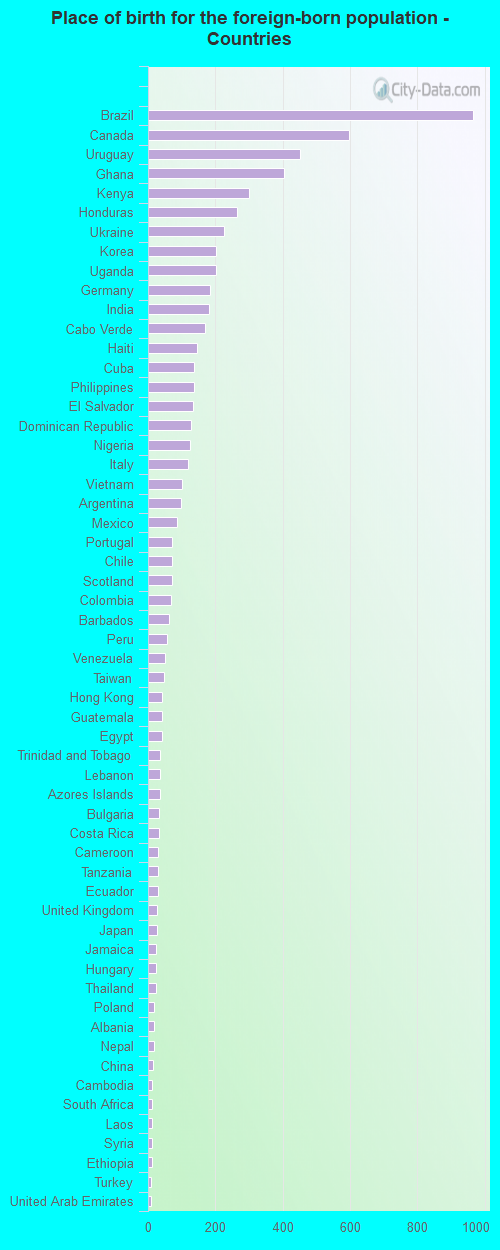
According to 2022 data, the most numerous races in Leominster, MA are White alone (30,116 residents), Hispanic (6,391 residents), and Asian alone (1,353 residents). 77.7% of Leominster residents speak English at home. 15.0% of Leominster, MA residents are foreign-born (6.5% born in Latin America, 3.0% born in Africa, 2.0% born in Asia, 1.9% born in Europe), which is 20.2% less than the foreign-born rate of 18.0% across the entire state of Massachusetts.
Race distribution in Leominster
2000 2022
5,198,359 81.9% White alone 428,729 6.8% Hispanic 318,329 5.0% Black alone 236,786 3.7% Asian alone 110,338 1.7% Two or more races 43,586 0.7% Other race alone 11,264 0.2% American Indian alone 1,706 0.03% Native Hawaiian and Other
4,676,627 67.0% White alone 911,038 13.0% Hispanic 501,463 7.2% Asian alone 459,740 6.6% Black alone 341,889 4.9% Two or more races 84,403 1.2% Other race alone 5,838 0.08% American Indian alone 976 0.01% Native Hawaiian and Other
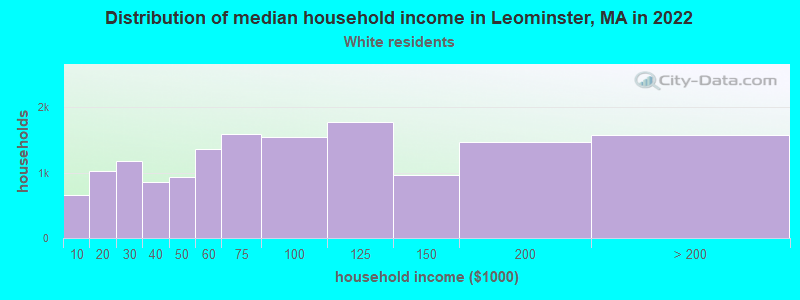
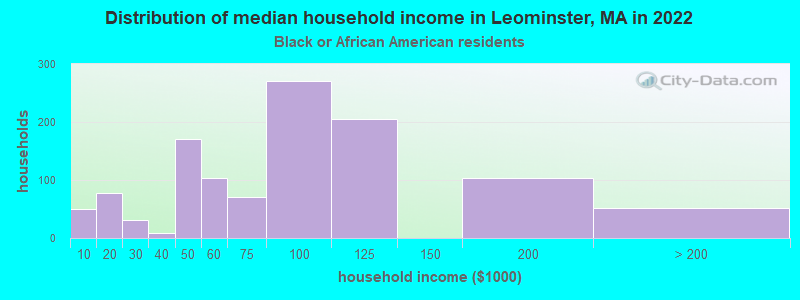
Income and house value in Leominster Median household income in 2022 $74,074 White non-Hispanic householders$76,618 Black householders$161,586 Asian householders$87,118 Some other race householders$51,850 Two or more races householders$58,565 Hispanic or Latino race householdersMedian 2022 house value $365,914 White Non-Hispanic householders$340,036 Black or African American householders $343,142 Asian householders$338,742 Some other race householders$337,449 Two or more races householders$314,417 Hispanic or Latino householders
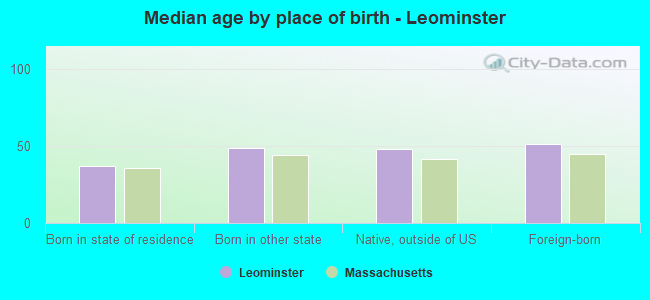
Median age by race in Leominster
48.1 Median age for White residents45.3 50.7 45.2 Median age for Black or African American residents44.9 44.4 56.0 Median age for American Indian / Alaska Native residents-649,474,688.9 -657,223,795.4 42.2 Median age for Asian residents39.6 44.7 -601,918,464.6 Median age for Native Hawaiian / Pacific Islander residents-513,131,312.6 -508,717,948.2 34.4 Median age for Other race residents36.8 30.6 20.8 Median age for Two or more races residents15.6 33.9 48.7 Median age for White alone residents45.6 51.1 31.6 Median age for Hispanic or Latino residents28.2 36.1
Owner/renter occupied households by race in Leominster
House owners and renters - White residents 9,999 66.5% Owner occupied5,040 33.5% Renter occupiedHouse owners and renters - Black or African American residents 597 46.8% Owner occupied678 53.2% Renter occupiedHouse owners and renters - American Indian / Alaska Native residents 24 100.0% Renter occupiedHouse owners and renters - Asian residents 446 95.1% Owner occupied23 4.9% Renter occupiedHouse owners and renters - Other race residents 520 74.6% Owner occupied177 25.4% Renter occupiedHouse owners and renters - Two or more races residents 479 32.1% Owner occupied1,011 67.9% Renter occupiedHouse owners and renters - White alone residents 9,671 66.9% Owner occupied4,778 33.1% Renter occupiedHouse owners and renters - Hispanic or Latino residents 908 42.9% Owner occupied1,210 57.1% Renter occupied
Language usage in Leominster
English speakers - Total 77.7% of residents of Leominster speak English at home.
10.7% of residents speak Spanish at home 2,350 52.9% Speak English very well2,090 47.1% Speak English less than very well11.7% of residents speak other language at home 3,128 64.2% Speak English very well1,744 35.8% Speak English less than very well
English speakers - Born in the United States 94.8% of residents of Leominster speak English at home.
3.3% of residents speak Spanish at home 212 92.6% Speak English very well17 7.4% Speak English less than very well1.6% of residents speak other language at home 114 100.0% Speak English very well
English speakers - Native, born elsewhere 21.9% of residents of Leominster speak English at home.
75.1% of residents speak Spanish at home 417 39.6% Speak English very well635 60.4% Speak English less than very well1.4% of residents speak other language at home 20 100.0% Speak English less than very well
English speakers - Foreign-born 16.5% of residents of Leominster speak English at home.
26.9% of residents speak Spanish at home 495 27.9% Speak English very well1,278 72.1% Speak English less than very well57.1% of residents speak other language at home 2,077 55.2% Speak English very well1,686 44.8% Speak English less than very well
White (Caucasian) - Speak only English Native:
94.7% (27,204)Foreign-born:
21.3% (418)
White (Caucasian) - Speak another language Native:
5.1% (1,475)Foreign-born:
78.7% (1,544)
Black or African American - Speak only English Native:
72.4% (982)Foreign-born:
22.9% (320)
Black or African American - Speak another language Native:
28.2% (382)Foreign-born:
77.6% (1,083)
Asian - Speak only English Native:
47.2% (218)Foreign-born:
12.8% (108)
Asian - Speak another language Native:
52.3% (242)Foreign-born:
86.3% (730)
Other race - Speak only English Native:
30.5% (195)Foreign-born:
11.8% (127)
Other race - Speak another language Native:
69.6% (446)Foreign-born:
88.4% (952)
Two or more races - Speak only English Native:
69.1% (2,805)Foreign-born:
10.9% (138)
Two or more races - Speak another language Native:
29.6% (1,203)Foreign-born:
87.5% (1,109)
White alone - Speak only English Native:
97.3% (26,702)Foreign-born:
24.6% (425)
White alone - Speak another language Native:
2.8% (761)Foreign-born:
74.9% (1,296)
Hispanic or Latino - Speak only English Native:
34.1% (1,358)Foreign-born:
8.8% (173)
Hispanic or Latino - Speak another language Native:
66.0% (2,631)Foreign-born:
91.4% (1,793)
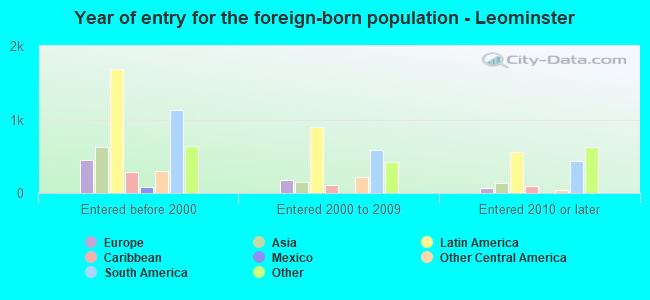
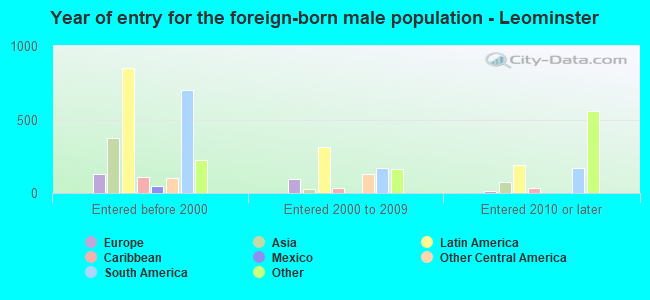
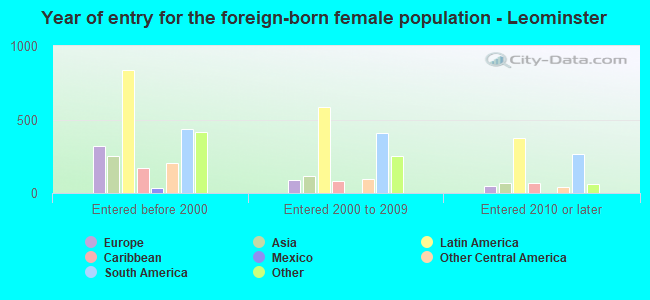
Foreign-born residents in Leominster 6,563 residents are foreign born (6.5% Latin America , 3.0% Africa , 2.0% Asia , 1.9% Europe ).
This city:
15.0%Massachusetts:
17.6%
Marital status for residents in Leominster Marital status - White (Caucasian) population 15 years and over
Males 38.9% Never married46.3% Now married0.8% Separated3.1% Widowed10.9% DivorcedFemales 26.3% Never married45.5% Now married1.5% Separated12.0% Widowed14.6% DivorcedWomen who gave birth in the past 12 months Now married:
38.9% (123)Unmarried:
61.1% (194)
Women who did not give birth in the past 12 months Now married:
43.4% (2,587)Unmarried:
56.6% (3,372)
Marital status - Black or African American population 15 years and over
Males 42.3% Never married46.9% Now married3.8% Separated0.1% Widowed6.8% DivorcedFemales 25.0% Never married50.1% Now married0.0% Separated7.8% Widowed17.0% DivorcedWomen who gave birth in the past 12 months Now married:
0.0% (0)Unmarried:
100.0% (37)
Women who did not give birth in the past 12 months Now married:
58.8% (326)Unmarried:
41.2% (228)
Marital status - American Indian / Alaska Native population 15 years and over
Males 0.0% Never married0.0% Now married0.0% Separated0.0% Widowed100.0% DivorcedFemales 0.0% Never married100.0% Now married0.0% Separated0.0% Widowed0.0% DivorcedMarital status - Asian population 15 years and over
Males 26.2% Never married56.1% Now married7.7% Separated0.0% Widowed10.0% DivorcedFemales 14.4% Never married57.9% Now married7.2% Separated7.6% Widowed13.0% DivorcedWomen who gave birth in the past 12 months Now married:
100.0% (73)Unmarried:
0.0% (0)
Women who did not give birth in the past 12 months Now married:
61.1% (149)Unmarried:
38.9% (95)
Marital status - Other race population 15 years and over
Males 40.2% Never married42.2% Now married1.7% Separated0.0% Widowed15.9% DivorcedFemales 37.5% Never married43.9% Now married1.9% Separated2.5% Widowed14.3% DivorcedWomen who did not give birth in the past 12 months Now married:
46.0% (268)Unmarried:
54.0% (314)
Marital status - Two or more races population 15 years and over
Males 53.1% Never married35.0% Now married4.8% Separated0.8% Widowed6.3% DivorcedFemales 37.6% Never married44.9% Now married0.8% Separated1.9% Widowed14.8% DivorcedWomen who gave birth in the past 12 months Now married:
100.0% (48)Unmarried:
0.0% (0)
Women who did not give birth in the past 12 months Now married:
36.8% (502)Unmarried:
63.2% (864)
Marital status - White alone, not Hispanic / Latino population 15 years and over
Males 38.0% Never married47.1% Now married0.6% Separated3.3% Widowed10.9% DivorcedFemales 25.5% Never married46.1% Now married1.6% Separated12.2% Widowed14.6% DivorcedWomen who gave birth in the past 12 months Now married:
40.4% (128)Unmarried:
59.6% (188)
Women who did not give birth in the past 12 months Now married:
42.8% (2,381)Unmarried:
57.2% (3,183)
Marital status - Hispanic or Latino population 15 years and over
Males 46.3% Never married41.5% Now married3.9% Separated0.0% Widowed8.3% DivorcedFemales 40.4% Never married39.2% Now married1.0% Separated5.2% Widowed14.1% DivorcedWomen who gave birth in the past 12 months Now married:
31.6% (6)Unmarried:
68.4% (13)
Women who did not give birth in the past 12 months Now married:
43.6% (746)Unmarried:
56.4% (965)
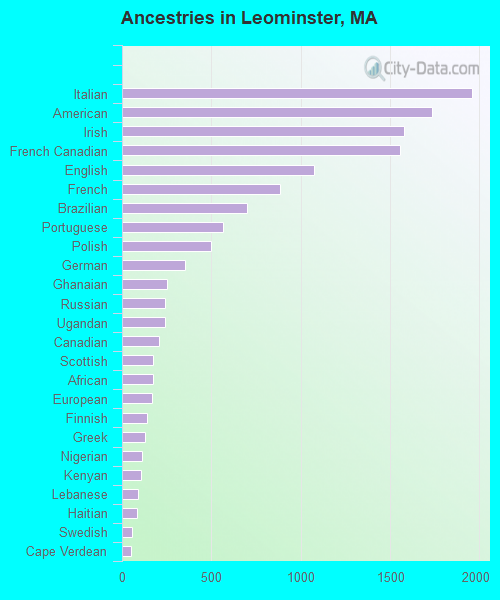
Ancestries in Leominster
1,956 10.2% Italian1,733 9.0% American1,577 8.2% Irish1,558 8.1% French Canadian1,075 5.6% English886 4.6% French699 3.6% Brazilian568 3.0% Portuguese499 2.6% Polish355 1.8% German251 1.3% Ghanaian243 1.3% Russian242 1.3% Ugandan205 1.1% Canadian175 0.9% Scottish171 0.9% African169 0.9% European141 0.7% Finnish128 0.7% Greek110 0.6% Nigerian105 0.5% Kenyan89 0.5% Lebanese86 0.4% Haitian55 0.3% Swedish49 0.3% Cape Verdean47 0.2% Egyptian47 0.2% Scotch-Irish41 0.2% Bulgarian41 0.2% Dutch40 0.2% Ethiopian32 0.2% Ukrainian31 0.2% Czechoslovakian29 0.2% Trinidadian and Tobagonian28 0.1% Armenian28 0.1% Syrian22 0.1% West Indian19 0.10% Albanian19 0.10% British18 0.09% Icelander17 0.09% Eastern European17 0.09% Northern European16 0.08% Norwegian14 0.07% Lithuanian12 0.06% Hungarian6 0.03% Scandinavian5 0.03% Danish5 0.03% Welsh5 0.03% Jamaican1 0.01% Iranian
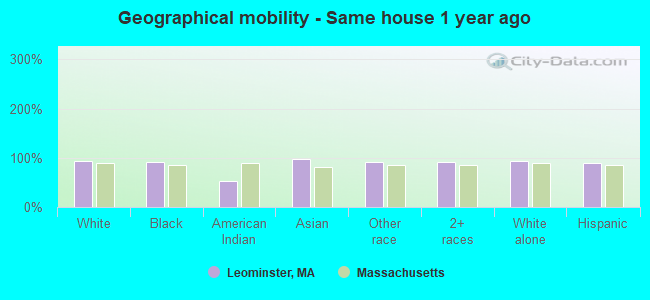
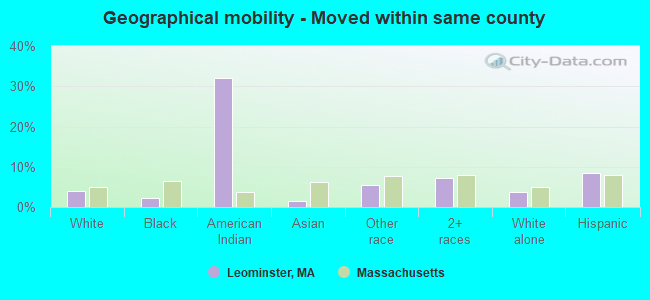
Geographical mobility in Leominster Same house 1 year ago 29,273 92.9% White (Caucasian)2,635 91.1% Black or African American32 52.6% American Indian / Alaska Native1,318 97.6% Asian1,796 91.8% Other race5,640 91.2% Two or more races27,906 93.2% White alone, not Hispanic / Latino5,577 88.5% Hispanic or LatinoMoved within same county 1,270 4.0% White / Caucasian63 2.2% Black or African American19 32.1% American Indian / Alaska Native20 1.5% Asian108 5.5% Other race444 7.2% Two or more races1,080 3.6% White alone, not Hispanic / Latino536 8.5% Hispanic or LatinoMoved within same state 609 1.9% White / Caucasian274 9.5% Black or African American9 0.7% Asian20 1.0% Other race39 0.6% Two or more races539 1.8% White alone, not Hispanic / Latino164 2.6% Hispanic or LatinoMoved from different state 293 0.9% White / Caucasian3 0.1% Black or African American6 0.1% Two or more races309 1.0% White alone, not Hispanic / Latino3 0.1% Hispanic or LatinoMoved from abroad 53 0.2% White11 0.4% Black or African American12 0.9% Asian47 0.2% White alone, not Hispanic / Latino30 0.5% Hispanic or Latino
Children Nativity (place of birth) in Leominster
Children under 6 years - Living with two parents Both parents native 763 99.9% Native1 0.1% Foreign-bornBoth parents foreign-born 446 90.5% Native47 9.5% Foreign-bornOne native, one foreign-born parent 222 100.0% NativeChildren under 6 years - Living with one parent Native parent 739 100.0% NativeForeign-born parent 109 68.9% Native49 31.1% Foreign-bornChildren 6 to 17 years - Living with two parents Both parents native 2,020 100.0% Native1 0.0% Foreign-bornBoth parents foreign-born 657 95.3% Native32 4.7% Foreign-bornOne native, one foreign-born parent 596 100.0% NativeChildren 6 to 17 years - Living with one parent Native parent 1,837 100.0% NativeForeign-born parent 388 52.2% Native356 47.8% Foreign-born
Grandparents responsible for own grandchildren in Leominster
Grandparents (30 to 59 years) White / Caucasian 219 86.9% Responsible for grandchildren33 13.1% Not responsible for grandchildrenBlack or African American 33 100.0% Not responsible for grandchildrenOther race 32 100.0% Not responsible for grandchildrenTwo or more races 31 100.0% Not responsible for grandchildrenWhite alone, not Hispanic / Latino 155 83.8% Responsible for grandchildren30 16.2% Not responsible for grandchildrenHispanic or Latino 62 100.0% Not responsible for grandchildrenGrandparents (60 years and over) White / Caucasian 55 17.0% Responsible for grandchildren269 83.0% Not responsible for grandchildrenBlack or African American 16 100.0% Not responsible for grandchildrenTwo or more races 39 100.0% Not responsible for grandchildrenWhite alone, not Hispanic / Latino 59 19.7% Responsible for grandchildren242 80.3% Not responsible for grandchildrenHispanic or Latino 49 100.0% Not responsible for grandchildren