Races in Lenoir City, Tennessee (TN) Detailed Stats
Data:
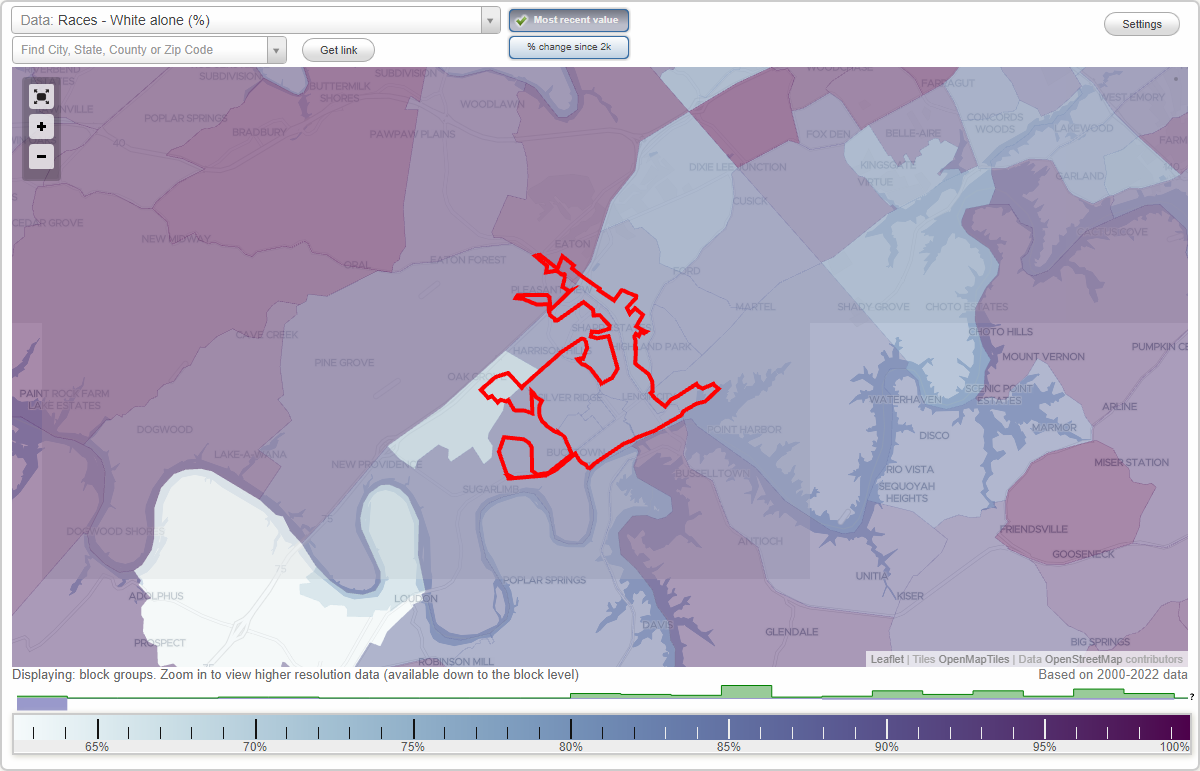
Races - White alone (%)
Races - White alone (% change since 2000)
Races - Black alone (%)
Races - Black alone (% change since 2000)
Races - American Indian alone (%)
Races - American Indian alone (% change since 2000)
Races - Asian alone (%)
Races - Asian alone (% change since 2000)
Races - Hispanic (%)
Races - Hispanic (% change since 2000)
Races - Native Hawaiian and Other Pacific Islander alone (%)
Races - Native Hawaiian and Other Pacific Islander alone (% change since 2000)
Races - Two or more races(%)
Races - Two or more races(% change since 2000)
Races - Other race alone (%)
Races - Other race alone (% change since 2000)
Racial diversity
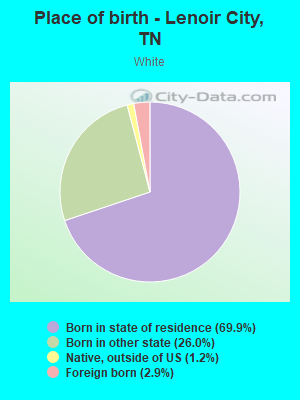
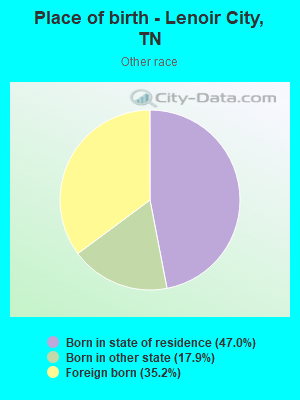
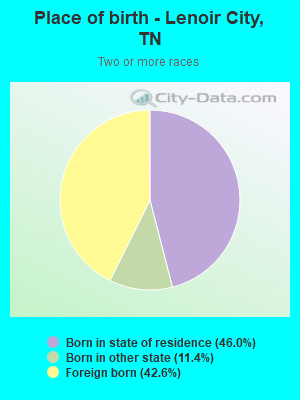
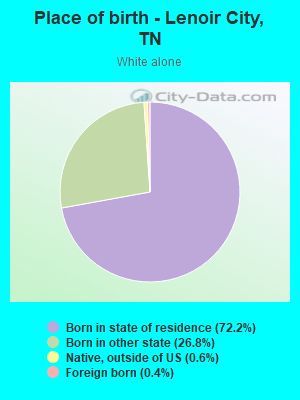
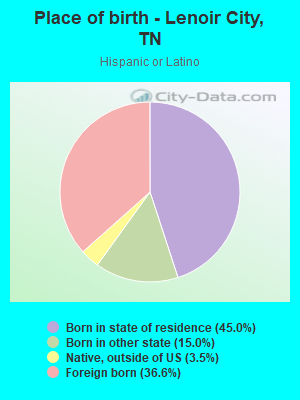
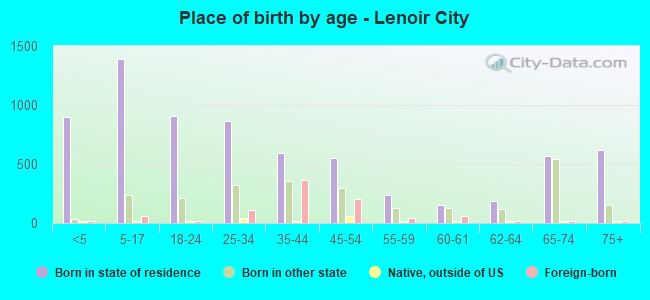
Place of birth - Born in state of residence (%)
Place of birth - Born in state of residence (%) - White
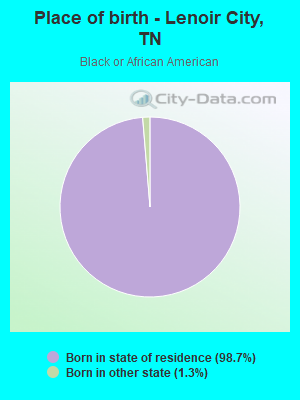
Place of birth - Born in state of residence (%) - Black or African American
Place of birth - Born in state of residence (%) - Asian
Place of birth - Born in state of residence (%) - Hispanic or Latino
Place of birth - Born in state of residence (%) - American Indian and Alaska Native
Place of birth - Born in state of residence (%) - Multirace
Place of birth - Born in state of residence (%) - Other Race
Place of birth - Born in other state (%)
Place of birth - Born in other state (%) - White
Place of birth - Born in other state (%) - Black or African American
Place of birth - Born in other state (%) - Asian
Place of birth - Born in other state (%) - Hispanic or Latino
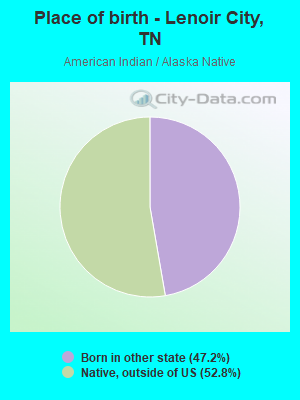
Place of birth - Born in other state (%) - American Indian and Alaska Native
Place of birth - Born in other state (%) - Multirace
Place of birth - Born in other state (%) - Other Race
Place of birth - Native, outside of US (%)
Place of birth - Native, outside of US (%) - White
Place of birth - Native, outside of US (%) - Black or African American
Place of birth - Native, outside of US (%) - Asian
Place of birth - Native, outside of US (%) - Hispanic or Latino
Place of birth - Native, outside of US (%) - American Indian and Alaska Native
Place of birth - Native, outside of US (%) - Multirace
Place of birth - Native, outside of US (%) - Other Race
Place of birth - Foreign born (%)
Place of birth - Foreign born (%) - White
Place of birth - Foreign born (%) - Black or African American
Place of birth - Foreign born (%) - Asian
Place of birth - Foreign born (%) - Hispanic or Latino
Place of birth - Foreign born (%) - American Indian and Alaska Native
Place of birth - Foreign born (%) - Multirace
Place of birth - Foreign born (%) - Other Race
Residents speaking English at home (%)
Residents speaking English at home - Born in the United States (%)
Residents speaking English at home - Native, born elsewhere (%)
Residents speaking English at home - Foreign born (%)
Residents speaking Spanish at home (%)
Residents speaking Spanish at home - Born in the United States (%)
Residents speaking Spanish at home - Native, born elsewhere (%)
Residents speaking Spanish at home - Foreign born (%)
Residents speaking other language at home (%)
Residents speaking other language at home - Born in the United States (%)
Residents speaking other language at home - Native, born elsewhere (%)
Residents speaking other language at home - Foreign born (%)
Marital status - Never married (%)
Marital status - Now married (%)
Marital status - Separated (%)
Marital status - Widowed (%)
Marital status - Divorced (%)
Ancestries Reported - Arab (%)
Ancestries Reported - Czech (%)
Ancestries Reported - Danish (%)
Ancestries Reported - Dutch (%)
Ancestries Reported - English (%)
Ancestries Reported - French (%)
Ancestries Reported - French Canadian (%)
Ancestries Reported - German (%)
Ancestries Reported - Greek (%)
Ancestries Reported - Hungarian (%)
Ancestries Reported - Irish (%)
Ancestries Reported - Italian (%)
Ancestries Reported - Lithuanian (%)
Ancestries Reported - Norwegian (%)
Ancestries Reported - Polish (%)
Ancestries Reported - Portuguese (%)
Ancestries Reported - Russian (%)
Ancestries Reported - Scotch-Irish (%)
Ancestries Reported - Scottish (%)
Ancestries Reported - Slovak (%)
Ancestries Reported - Subsaharan African (%)
Ancestries Reported - Swedish (%)
Ancestries Reported - Swiss (%)
Ancestries Reported - Ukrainian (%)
Ancestries Reported - United States (%)
Ancestries Reported - Welsh (%)
Ancestries Reported - West Indian (%)
Ancestries Reported - Other (%)
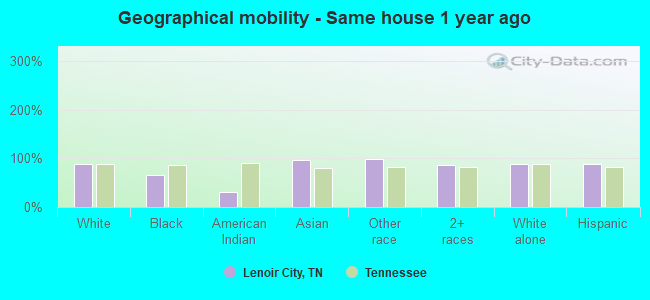
Geographical mobility - Same house 1 year ago (%)
Geographical mobility - Same house 1 year ago (%) - White
Geographical mobility - Same house 1 year ago (%) - Black or African American
Geographical mobility - Same house 1 year ago (%) - Asian
Geographical mobility - Same house 1 year ago (%) - Hispanic or Latino
Geographical mobility - Same house 1 year ago (%) - American Indian and Alaska Native
Geographical mobility - Same house 1 year ago (%) - Multirace
Geographical mobility - Same house 1 year ago (%) - Other Race
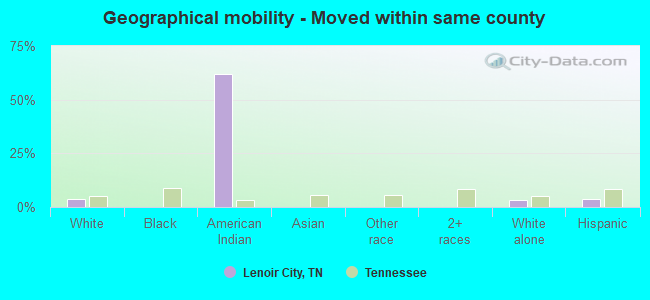
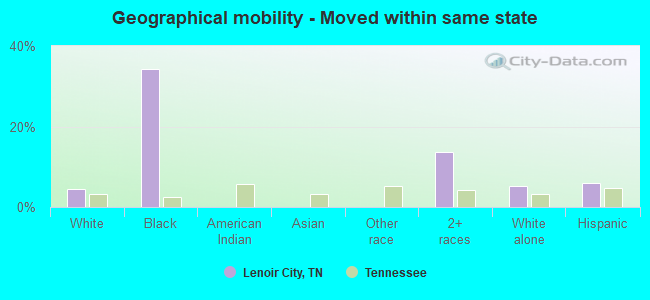
Geographical mobility - Moved within same county (%)
Geographical mobility - Moved within same county (%) - White
Geographical mobility - Moved within same county (%) - Black or African American
Geographical mobility - Moved within same county (%) - Asian
Geographical mobility - Moved within same county (%) - Hispanic or Latino
Geographical mobility - Moved within same county (%) - American Indian and Alaska Native
Geographical mobility - Moved within same county (%) - Multirace
Geographical mobility - Moved within same county (%) - Other Race
Geographical mobility - Moved from different county within same state (%)
Geographical mobility - Moved from different county within same state (%) - White
Geographical mobility - Moved from different county within same state (%) - Black or African American
Geographical mobility - Moved from different county within same state (%) - Asian
Geographical mobility - Moved from different county within same state (%) - Hispanic or Latino
Geographical mobility - Moved from different county within same state (%) - American Indian and Alaska Native
Geographical mobility - Moved from different county within same state (%) - Multirace
Geographical mobility - Moved from different county within same state (%) - Other Race
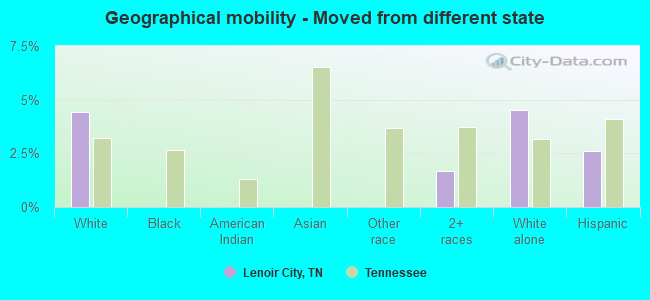
Geographical mobility - Moved from different state (%)
Geographical mobility - Moved from different state (%) - White
Geographical mobility - Moved from different state (%) - Black or African American
Geographical mobility - Moved from different state (%) - Asian
Geographical mobility - Moved from different state (%) - Hispanic or Latino
Geographical mobility - Moved from different state (%) - American Indian and Alaska Native
Geographical mobility - Moved from different state (%) - Multirace
Geographical mobility - Moved from different state (%) - Other Race
Geographical mobility - Moved from abroad (%)
Geographical mobility - Moved from abroad (%) - White
Geographical mobility - Moved from abroad (%) - Black or African American
Geographical mobility - Moved from abroad (%) - Asian
Geographical mobility - Moved from abroad (%) - Hispanic or Latino
Geographical mobility - Moved from abroad (%) - American Indian and Alaska Native
Geographical mobility - Moved from abroad (%) - Multirace
Geographical mobility - Moved from abroad (%) - Other Race
Place of birth for the foreign-born population - Ireland (%)
Place of birth for the foreign-born population - Denmark (%)
Place of birth for the foreign-born population - Norway (%)
Place of birth for the foreign-born population - Sweden (%)
Place of birth for the foreign-born population - United Kingdom (%)
Place of birth for the foreign-born population - England (%)
Place of birth for the foreign-born population - Scotland (%)
Place of birth for the foreign-born population - Other Northern Europe (%)
Place of birth for the foreign-born population - Austria (%)
Place of birth for the foreign-born population - Belgium (%)
Place of birth for the foreign-born population - France (%)
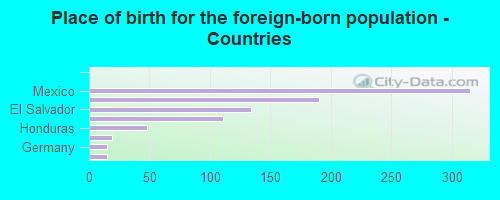
Place of birth for the foreign-born population - Germany (%)
Place of birth for the foreign-born population - Netherlands (%)
Place of birth for the foreign-born population - Switzerland (%)
Place of birth for the foreign-born population - Other Western Europe (%)
Place of birth for the foreign-born population - Greece (%)
Place of birth for the foreign-born population - Italy (%)
Place of birth for the foreign-born population - Portugal (%)
Place of birth for the foreign-born population - Spain (%)
Place of birth for the foreign-born population - Other Southern Europe (%)
Place of birth for the foreign-born population - Albania (%)
Place of birth for the foreign-born population - Belarus (%)
Place of birth for the foreign-born population - Bosnia and Herzegovina (%)
Place of birth for the foreign-born population - Bulgaria (%)
Place of birth for the foreign-born population - Croatia (%)
Place of birth for the foreign-born population - Czechoslovakia (%)
Place of birth for the foreign-born population - Hungary (%)
Place of birth for the foreign-born population - Latvia (%)
Place of birth for the foreign-born population - Lithuania (%)
Place of birth for the foreign-born population - North Macedonia (Macedonia) (%)
Place of birth for the foreign-born population - Moldova (%)
Place of birth for the foreign-born population - Poland (%)
Place of birth for the foreign-born population - Romania (%)
Place of birth for the foreign-born population - Russia (%)
Place of birth for the foreign-born population - Serbia (%)
Place of birth for the foreign-born population - Ukraine (%)
Place of birth for the foreign-born population - Other Eastern Europe (%)
Place of birth for the foreign-born population - China (%)
Place of birth for the foreign-born population - Hong Kong (%)
Place of birth for the foreign-born population - Taiwan (%)
Place of birth for the foreign-born population - Japan (%)
Place of birth for the foreign-born population - Korea (%)
Place of birth for the foreign-born population - Other Eastern Asia (%)
Place of birth for the foreign-born population - Afghanistan (%)
Place of birth for the foreign-born population - Bangladesh (%)
Place of birth for the foreign-born population - India (%)
Place of birth for the foreign-born population - Iran (%)
Place of birth for the foreign-born population - Kazakhstan (%)
Place of birth for the foreign-born population - Nepal (%)
Place of birth for the foreign-born population - Pakistan (%)
Place of birth for the foreign-born population - Sri Lanka (%)
Place of birth for the foreign-born population - Uzbekistan (%)
Place of birth for the foreign-born population - Other South Central Asia (%)
Place of birth for the foreign-born population - Burma (%)
Place of birth for the foreign-born population - Cambodia (%)
Place of birth for the foreign-born population - Indonesia (%)
Place of birth for the foreign-born population - Laos (%)
Place of birth for the foreign-born population - Malaysia (%)
Place of birth for the foreign-born population - Philippines (%)
Place of birth for the foreign-born population - Singapore (%)
Place of birth for the foreign-born population - Thailand (%)
Place of birth for the foreign-born population - Vietnam (%)
Place of birth for the foreign-born population - Other South Eastern Asia (%)
Place of birth for the foreign-born population - Armenia (%)
Place of birth for the foreign-born population - Iraq (%)
Place of birth for the foreign-born population - Israel (%)
Place of birth for the foreign-born population - Jordan (%)
Place of birth for the foreign-born population - Kuwait (%)
Place of birth for the foreign-born population - Lebanon (%)
Place of birth for the foreign-born population - Saudi Arabia (%)
Place of birth for the foreign-born population - Syria (%)
Place of birth for the foreign-born population - Turkey (%)
Place of birth for the foreign-born population - Yemen (%)
Place of birth for the foreign-born population - Other Western Asia (%)
Place of birth for the foreign-born population - Eritrea (%)
Place of birth for the foreign-born population - Ethiopia (%)
Place of birth for the foreign-born population - Kenya (%)
Place of birth for the foreign-born population - Somalia (%)
Place of birth for the foreign-born population - Uganda (%)
Place of birth for the foreign-born population - Zimbabwe (%)
Place of birth for the foreign-born population - Other Eastern Africa (%)
Place of birth for the foreign-born population - Cameroon (%)
Place of birth for the foreign-born population - Congo (%)
Place of birth for the foreign-born population - Democratic Republic of Congo (Zaire) (%)
Place of birth for the foreign-born population - Other Middle Africa (%)
Place of birth for the foreign-born population - Egypt (%)
Place of birth for the foreign-born population - Morocco (%)
Place of birth for the foreign-born population - Sudan (%)
Place of birth for the foreign-born population - Other Northern Africa (%)
Place of birth for the foreign-born population - South Africa (%)
Place of birth for the foreign-born population - Other Southern Africa (%)
Place of birth for the foreign-born population - Cabo Verde (%)
Place of birth for the foreign-born population - Ghana (%)
Place of birth for the foreign-born population - Liberia (%)
Place of birth for the foreign-born population - Nigeria (%)
Place of birth for the foreign-born population - Senegal (%)
Place of birth for the foreign-born population - Sierra Leone (%)
Place of birth for the foreign-born population - Other Western Africa (%)
Place of birth for the foreign-born population - Australia (%)
Place of birth for the foreign-born population - New Zealand (%)
Place of birth for the foreign-born population - Fiji (%)
Place of birth for the foreign-born population - Micronesia (%)
Place of birth for the foreign-born population - Bahamas (%)
Place of birth for the foreign-born population - Barbados (%)
Place of birth for the foreign-born population - Cuba (%)
Place of birth for the foreign-born population - Dominica (%)
Place of birth for the foreign-born population - Dominican Republic (%)
Place of birth for the foreign-born population - Grenada (%)
Place of birth for the foreign-born population - Haiti (%)
Place of birth for the foreign-born population - Jamaica (%)
Place of birth for the foreign-born population - St. Vincent and the Grenadines (%)
Place of birth for the foreign-born population - Trinidad and Tobago (%)
Place of birth for the foreign-born population - West Indies (%)
Place of birth for the foreign-born population - Other Caribbean (%)
Place of birth for the foreign-born population - Belize (%)
Place of birth for the foreign-born population - Costa Rica (%)
Place of birth for the foreign-born population - El Salvador (%)
Place of birth for the foreign-born population - Guatemala (%)
Place of birth for the foreign-born population - Honduras (%)
Place of birth for the foreign-born population - Mexico (%)
Place of birth for the foreign-born population - Nicaragua (%)
Place of birth for the foreign-born population - Panama (%)
Place of birth for the foreign-born population - Other Central America (%)
Place of birth for the foreign-born population - Argentina (%)
Place of birth for the foreign-born population - Bolivia (%)
Place of birth for the foreign-born population - Brazil (%)
Place of birth for the foreign-born population - Chile (%)
Place of birth for the foreign-born population - Colombia (%)
Place of birth for the foreign-born population - Ecuador (%)
Place of birth for the foreign-born population - Guyana (%)
Place of birth for the foreign-born population - Peru (%)
Place of birth for the foreign-born population - Uruguay (%)
Place of birth for the foreign-born population - Venezuela (%)
Place of birth for the foreign-born population - Other South America (%)
Place of birth for the foreign-born population - Canada (%)
Place of birth for the foreign-born population - Other Northern America (%)
Place of birth for the foreign-born population - Other (%)
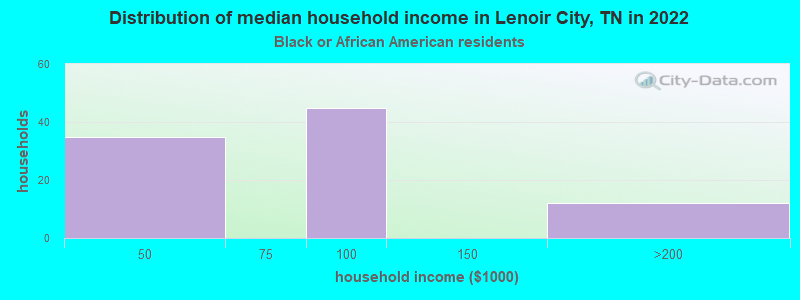
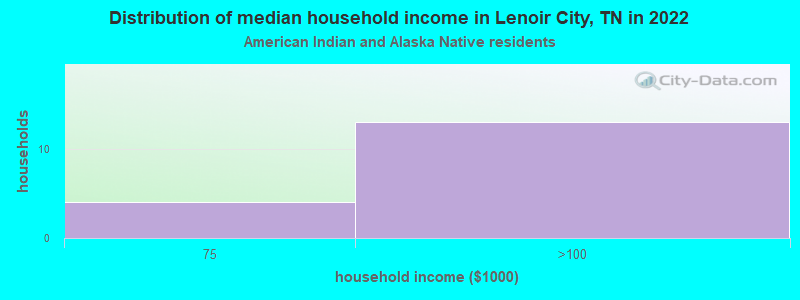
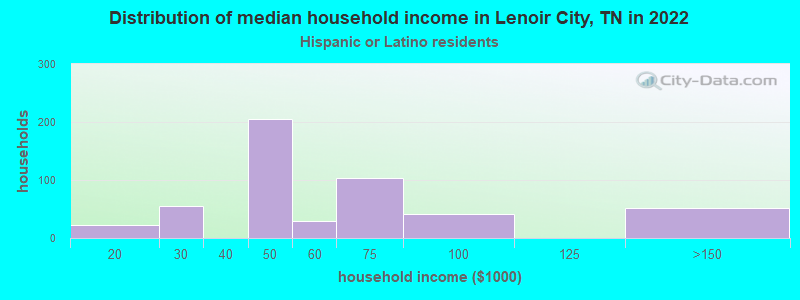
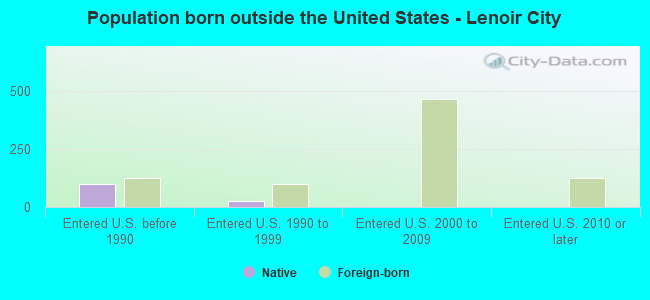
According to 2022 data, the most numerous races in Lenoir City, TN are White alone (7,908 residents), Black alone (78 residents), and Hispanic (2,237 residents). 83.7% of Lenoir City residents speak English at home. 8.1% of Lenoir City, TN residents are foreign-born (7.4% born in Latin America), which is 38.4% greater than the foreign-born rate of 5.0% across the entire state of Tennessee.
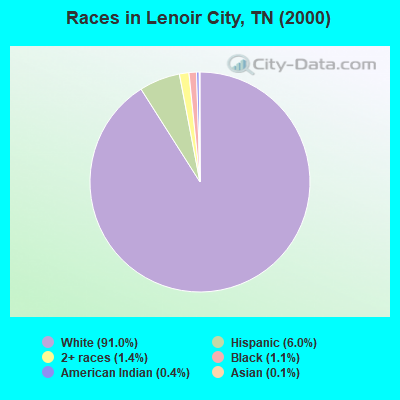
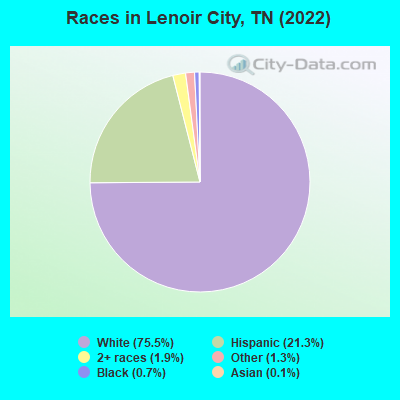
Race distribution in Lenoir City
2000 2022
4,505,930 79.2% White alone 928,204 16.3% Black alone 123,838 2.2% Hispanic 54,824 1.0% Two or more races 56,077 1.0% Asian alone 13,820 0.2% American Indian alone 4,780 0.08% Other race alone 1,810 0.03% Native Hawaiian and Other
5,070,026 71.9% White alone 1,089,738 15.5% Black alone 442,629 6.3% Hispanic 279,381 4.0% Two or more races 131,817 1.9% Asian alone 26,972 0.4% Other race alone 6,387 0.09% American Indian alone 4,389 0.06% Native Hawaiian and Other
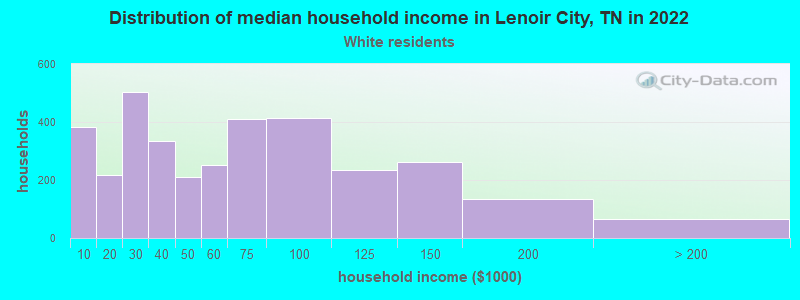
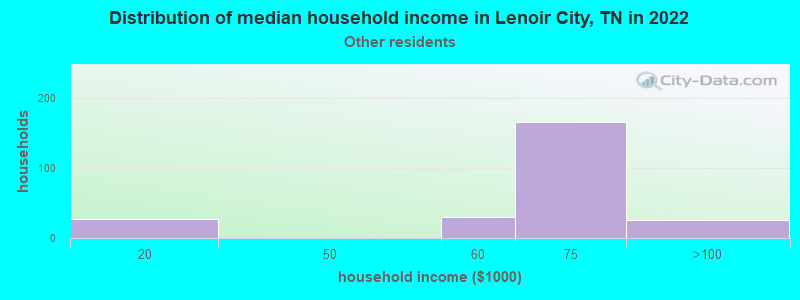
Income and house value in Lenoir City Median household income in 2022 $53,630 White non-Hispanic householders$96,182 Black householders$60,881 Some other race householders$46,732 Two or more races householders$51,385 Hispanic or Latino race householdersMedian 2022 house value $242,201 White Non-Hispanic householders$244,079 Black or African American householders$279,001 Two or more races householders
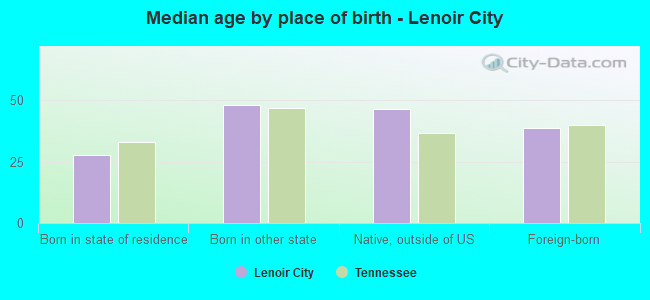
Median age by race in Lenoir City
37.2 Median age for White residents33.3 39.7 41.7 Median age for Black or African American residents41.8 -677,839,850.3 -681,948,423.4 Median age for American Indian / Alaska Native residents-633,911,367.4 -801,477,376.9 -685,288,639.9 Median age for Asian residents-662,846,226.7 -686,648,500.7 -885,813,147.9 Median age for Native Hawaiian / Pacific Islander residents-951,707,890.7 -735,930,735.2 28.7 Median age for Other race residents26.9 48.4 26.0 Median age for Two or more races residents31.8 20.3 39.5 Median age for White alone residents38.4 39.9 19.8 Median age for Hispanic or Latino residents20.2 19.0
Owner/renter occupied households by race in Lenoir City
House owners and renters - White residents 2,204 64.4% Owner occupied1,218 35.6% Renter occupiedHouse owners and renters - Black or African American residents 52 65.1% Owner occupied28 34.9% Renter occupiedHouse owners and renters - American Indian / Alaska Native residents 5 27.7% Owner occupied13 72.3% Renter occupiedHouse owners and renters - Other race residents 167 66.9% Owner occupied82 33.1% Renter occupiedHouse owners and renters - Two or more races residents 53 15.8% Owner occupied281 84.2% Renter occupiedHouse owners and renters - White alone residents 2,075 64.0% Owner occupied1,167 36.0% Renter occupiedHouse owners and renters - Hispanic or Latino residents 172 34.2% Owner occupied332 65.8% Renter occupied
Language usage in Lenoir City
English speakers - Total 83.7% of residents of Lenoir City speak English at home.
14.8% of residents speak Spanish at home 654 46.5% Speak English very well753 53.5% Speak English less than very well1.9% of residents speak other language at home 178 100.0% Speak English very well
English speakers - Born in the United States 95.3% of residents of Lenoir City speak English at home.
4.5% of residents speak Spanish at home 65 58.0% Speak English very well47 42.0% Speak English less than very well0.3% of residents speak other language at home 8 100.0% Speak English very well
English speakers - Native, born elsewhere 49.6% of residents of Lenoir City speak English at home.
48.0% of residents speak Spanish at home 61 100.0% Speak English very well
English speakers - Foreign-born 14.9% of residents of Lenoir City speak English at home.
85.9% of residents speak Spanish at home 92 12.6% Speak English very well638 87.4% Speak English less than very well1.9% of residents speak other language at home 16 100.0% Speak English very well
White (Caucasian) - Speak only English Native:
93.6% (7,330)Foreign-born:
12.1% (31)
White (Caucasian) - Speak another language Native:
5.6% (438)Foreign-born:
81.7% (208)
Other race - Speak another language Native:
79.9% (203)Foreign-born:
100.0% (129)
Two or more races - Speak only English Native:
71.4% (438)Foreign-born:
27.8% (172)
Two or more races - Speak another language Native:
30.6% (188)Foreign-born:
72.5% (449)
White alone - Speak only English Native:
99.5% (7,164)Foreign-born:
96.7% (33)
Hispanic or Latino - Speak only English Native:
38.7% (443)Foreign-born:
11.0% (89)
Hispanic or Latino - Speak another language Native:
60.0% (688)Foreign-born:
88.7% (724)
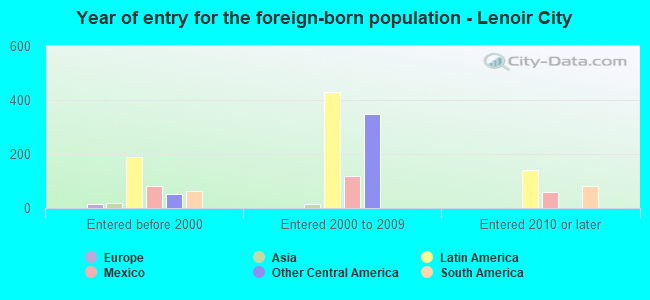
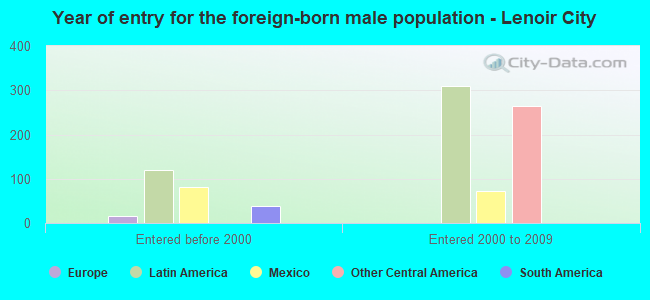
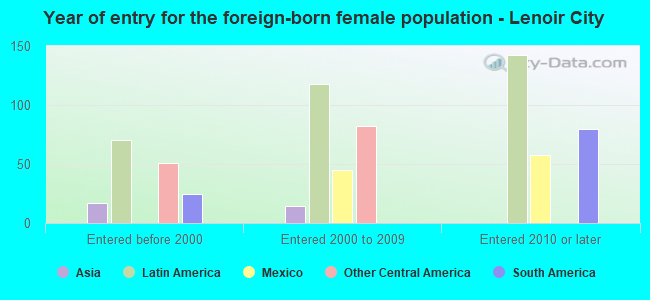
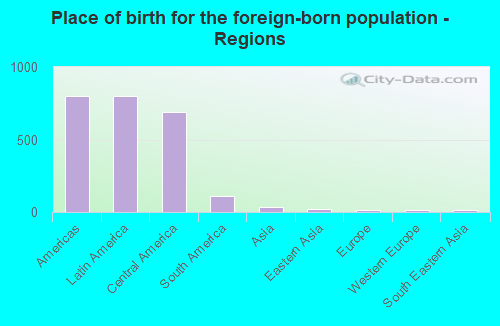
Foreign-born residents in Lenoir City 851 residents are foreign born (7.4% Latin America ).
This city:
8.1%Tennessee:
5.4%
Marital status for residents in Lenoir City Marital status - White (Caucasian) population 15 years and over
Males 39.6% Never married47.3% Now married0.0% Separated3.7% Widowed9.5% DivorcedFemales 27.3% Never married39.3% Now married3.7% Separated15.7% Widowed14.0% DivorcedWomen who gave birth in the past 12 months Now married:
84.9% (45)Unmarried:
15.1% (8)
Women who did not give birth in the past 12 months Now married:
40.9% (816)Unmarried:
59.1% (1,177)
Marital status - Black or African American population 15 years and over
Males 35.4% Never married12.7% Now married0.0% Separated0.0% Widowed51.9% DivorcedFemales 0.0% Never married0.0% Now married0.0% Separated100.0% Widowed0.0% DivorcedMarital status - American Indian / Alaska Native population 15 years and over
Males 0.0% Never married0.0% Now married0.0% Separated0.0% Widowed100.0% DivorcedFemales 0.0% Never married0.0% Now married100.0% Separated0.0% Widowed0.0% DivorcedWomen who did not give birth in the past 12 months Now married:
100.0% (15)Unmarried:
0.0% (0)
Marital status - Other race population 15 years and over
Males 61.5% Never married38.5% Now married0.0% Separated0.0% Widowed0.0% DivorcedFemales 0.0% Never married100.0% Now married0.0% Separated0.0% Widowed0.0% DivorcedWomen who did not give birth in the past 12 months Now married:
100.0% (58)Unmarried:
0.0% (0)
Marital status - Two or more races population 15 years and over
Males 39.0% Never married56.7% Now married4.4% Separated0.0% Widowed0.0% DivorcedFemales 68.9% Never married30.7% Now married0.0% Separated0.5% Widowed0.0% DivorcedWomen who did not give birth in the past 12 months Now married:
11.0% (27)Unmarried:
89.0% (217)
Marital status - White alone, not Hispanic / Latino population 15 years and over
Males 35.3% Never married49.6% Now married0.0% Separated4.3% Widowed10.8% DivorcedFemales 25.5% Never married41.1% Now married2.5% Separated15.6% Widowed15.2% DivorcedWomen who gave birth in the past 12 months Now married:
84.9% (45)Unmarried:
15.1% (8)
Women who did not give birth in the past 12 months Now married:
41.4% (737)Unmarried:
58.6% (1,043)
Marital status - Hispanic or Latino population 15 years and over
Males 55.5% Never married44.5% Now married0.0% Separated0.0% Widowed0.0% DivorcedFemales 50.0% Never married28.6% Now married12.2% Separated9.2% Widowed0.0% DivorcedWomen who did not give birth in the past 12 months Now married:
37.3% (191)Unmarried:
62.7% (320)
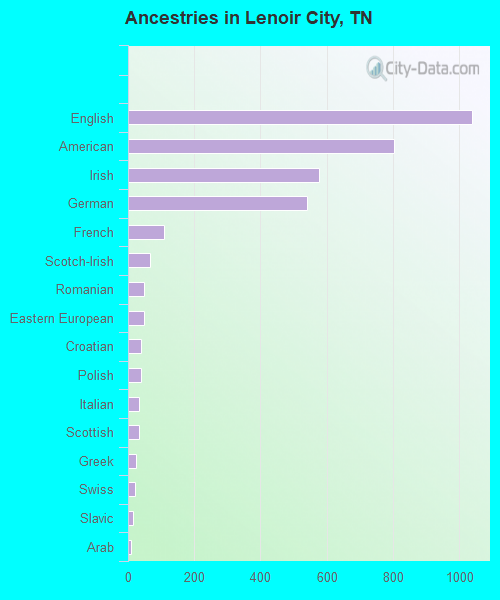
Ancestries in Lenoir City
1,038 18.0% English802 13.9% American576 10.0% Irish539 9.4% German110 1.9% French66 1.1% Scotch-Irish49 0.9% Romanian47 0.8% Eastern European40 0.7% Croatian40 0.7% Polish34 0.6% Italian32 0.6% Scottish24 0.4% Greek21 0.4% Swiss14 0.2% Slavic10 0.2% Arab5 0.09% European
Children Nativity (place of birth) in Lenoir City
Children under 6 years - Living with two parents Both parents native 462 100.0% NativeOne native, one foreign-born parent 146 100.0% NativeChildren under 6 years - Living with one parent Native parent 391 100.0% NativeChildren 6 to 17 years - Living with two parents Both parents native 870 100.0% NativeBoth parents foreign-born 133 65.9% Native69 34.1% Foreign-bornOne native, one foreign-born parent 124 100.0% NativeChildren 6 to 17 years - Living with one parent Native parent 171 100.0% NativeForeign-born parent 44 51.1% Native42 48.9% Foreign-born
Grandparents responsible for own grandchildren in Lenoir City
Grandparents (30 to 59 years) White / Caucasian 35 41.6% Responsible for grandchildren49 58.4% Not responsible for grandchildrenTwo or more races 144 100.0% Responsible for grandchildrenWhite alone, not Hispanic / Latino 35 41.1% Responsible for grandchildren50 58.9% Not responsible for grandchildrenHispanic or Latino 81 100.0% Responsible for grandchildrenGrandparents (60 years and over) White / Caucasian 46 59.8% Responsible for grandchildren31 40.2% Not responsible for grandchildrenWhite alone, not Hispanic / Latino 46 59.9% Responsible for grandchildren31 40.1% Not responsible for grandchildren