Races in Lehi, Utah (UT) Detailed Stats
Data:
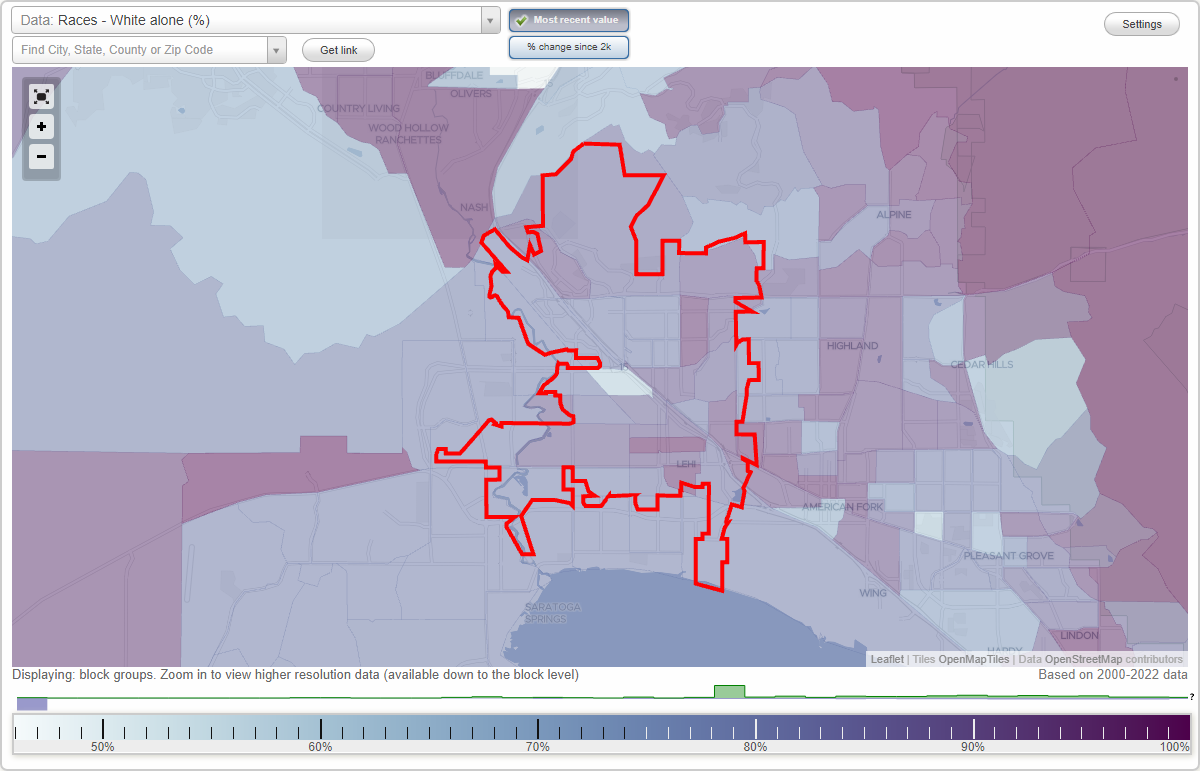
Races - White alone (%)
Races - White alone (% change since 2000)
Races - Black alone (%)
Races - Black alone (% change since 2000)
Races - American Indian alone (%)
Races - American Indian alone (% change since 2000)
Races - Asian alone (%)
Races - Asian alone (% change since 2000)
Races - Hispanic (%)
Races - Hispanic (% change since 2000)
Races - Native Hawaiian and Other Pacific Islander alone (%)
Races - Native Hawaiian and Other Pacific Islander alone (% change since 2000)
Races - Two or more races(%)
Races - Two or more races(% change since 2000)
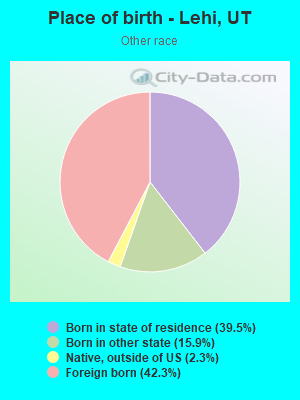
Races - Other race alone (%)
Races - Other race alone (% change since 2000)
Racial diversity
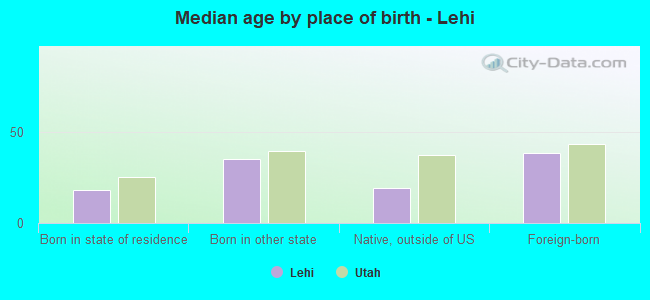
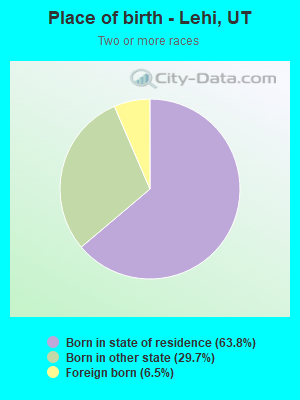
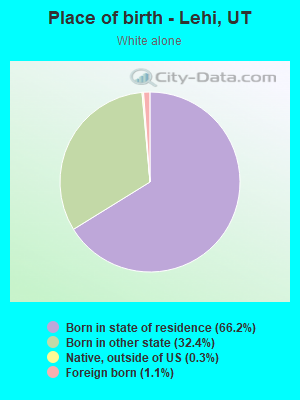
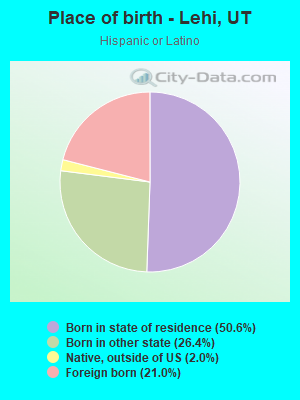
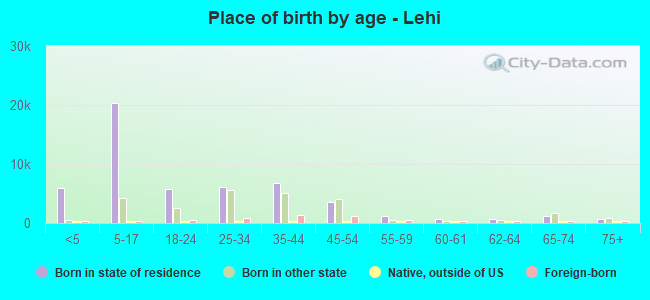
Place of birth - Born in state of residence (%)
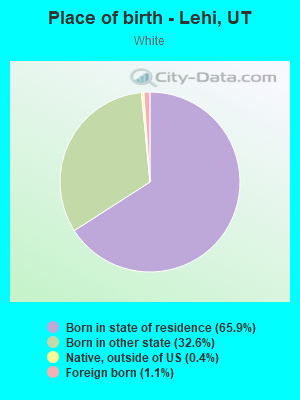
Place of birth - Born in state of residence (%) - White
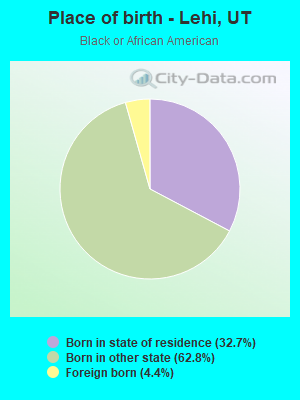
Place of birth - Born in state of residence (%) - Black or African American
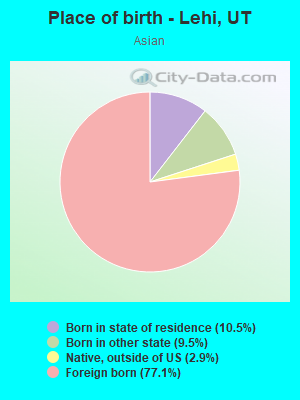
Place of birth - Born in state of residence (%) - Asian
Place of birth - Born in state of residence (%) - Hispanic or Latino
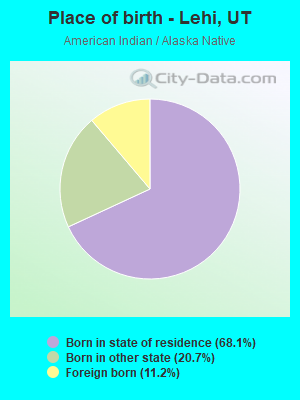
Place of birth - Born in state of residence (%) - American Indian and Alaska Native
Place of birth - Born in state of residence (%) - Multirace
Place of birth - Born in state of residence (%) - Other Race
Place of birth - Born in other state (%)
Place of birth - Born in other state (%) - White
Place of birth - Born in other state (%) - Black or African American
Place of birth - Born in other state (%) - Asian
Place of birth - Born in other state (%) - Hispanic or Latino
Place of birth - Born in other state (%) - American Indian and Alaska Native
Place of birth - Born in other state (%) - Multirace
Place of birth - Born in other state (%) - Other Race
Place of birth - Native, outside of US (%)
Place of birth - Native, outside of US (%) - White
Place of birth - Native, outside of US (%) - Black or African American
Place of birth - Native, outside of US (%) - Asian
Place of birth - Native, outside of US (%) - Hispanic or Latino
Place of birth - Native, outside of US (%) - American Indian and Alaska Native
Place of birth - Native, outside of US (%) - Multirace
Place of birth - Native, outside of US (%) - Other Race
Place of birth - Foreign born (%)
Place of birth - Foreign born (%) - White
Place of birth - Foreign born (%) - Black or African American
Place of birth - Foreign born (%) - Asian
Place of birth - Foreign born (%) - Hispanic or Latino
Place of birth - Foreign born (%) - American Indian and Alaska Native
Place of birth - Foreign born (%) - Multirace
Place of birth - Foreign born (%) - Other Race
Residents speaking English at home (%)
Residents speaking English at home - Born in the United States (%)
Residents speaking English at home - Native, born elsewhere (%)
Residents speaking English at home - Foreign born (%)
Residents speaking Spanish at home (%)
Residents speaking Spanish at home - Born in the United States (%)
Residents speaking Spanish at home - Native, born elsewhere (%)
Residents speaking Spanish at home - Foreign born (%)
Residents speaking other language at home (%)
Residents speaking other language at home - Born in the United States (%)
Residents speaking other language at home - Native, born elsewhere (%)
Residents speaking other language at home - Foreign born (%)
Marital status - Never married (%)
Marital status - Now married (%)
Marital status - Separated (%)
Marital status - Widowed (%)
Marital status - Divorced (%)
Ancestries Reported - Arab (%)
Ancestries Reported - Czech (%)
Ancestries Reported - Danish (%)
Ancestries Reported - Dutch (%)
Ancestries Reported - English (%)
Ancestries Reported - French (%)
Ancestries Reported - French Canadian (%)
Ancestries Reported - German (%)
Ancestries Reported - Greek (%)
Ancestries Reported - Hungarian (%)
Ancestries Reported - Irish (%)
Ancestries Reported - Italian (%)
Ancestries Reported - Lithuanian (%)
Ancestries Reported - Norwegian (%)
Ancestries Reported - Polish (%)
Ancestries Reported - Portuguese (%)
Ancestries Reported - Russian (%)
Ancestries Reported - Scotch-Irish (%)
Ancestries Reported - Scottish (%)
Ancestries Reported - Slovak (%)
Ancestries Reported - Subsaharan African (%)
Ancestries Reported - Swedish (%)
Ancestries Reported - Swiss (%)
Ancestries Reported - Ukrainian (%)
Ancestries Reported - United States (%)
Ancestries Reported - Welsh (%)
Ancestries Reported - West Indian (%)
Ancestries Reported - Other (%)
Geographical mobility - Same house 1 year ago (%)
Geographical mobility - Same house 1 year ago (%) - White
Geographical mobility - Same house 1 year ago (%) - Black or African American
Geographical mobility - Same house 1 year ago (%) - Asian
Geographical mobility - Same house 1 year ago (%) - Hispanic or Latino
Geographical mobility - Same house 1 year ago (%) - American Indian and Alaska Native
Geographical mobility - Same house 1 year ago (%) - Multirace
Geographical mobility - Same house 1 year ago (%) - Other Race
Geographical mobility - Moved within same county (%)
Geographical mobility - Moved within same county (%) - White
Geographical mobility - Moved within same county (%) - Black or African American
Geographical mobility - Moved within same county (%) - Asian
Geographical mobility - Moved within same county (%) - Hispanic or Latino
Geographical mobility - Moved within same county (%) - American Indian and Alaska Native
Geographical mobility - Moved within same county (%) - Multirace
Geographical mobility - Moved within same county (%) - Other Race
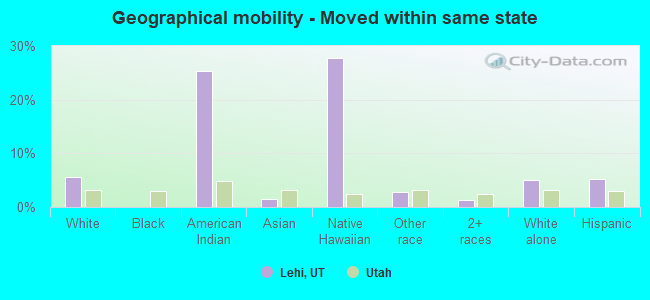
Geographical mobility - Moved from different county within same state (%)
Geographical mobility - Moved from different county within same state (%) - White
Geographical mobility - Moved from different county within same state (%) - Black or African American
Geographical mobility - Moved from different county within same state (%) - Asian
Geographical mobility - Moved from different county within same state (%) - Hispanic or Latino
Geographical mobility - Moved from different county within same state (%) - American Indian and Alaska Native
Geographical mobility - Moved from different county within same state (%) - Multirace
Geographical mobility - Moved from different county within same state (%) - Other Race
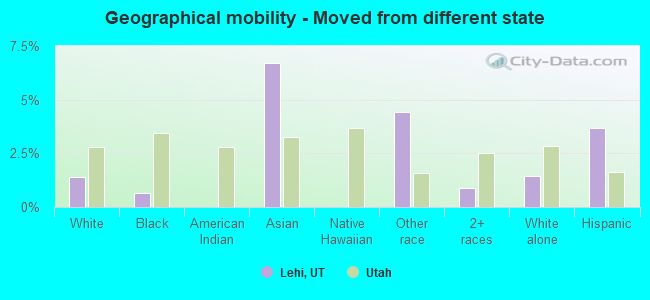
Geographical mobility - Moved from different state (%)
Geographical mobility - Moved from different state (%) - White
Geographical mobility - Moved from different state (%) - Black or African American
Geographical mobility - Moved from different state (%) - Asian
Geographical mobility - Moved from different state (%) - Hispanic or Latino
Geographical mobility - Moved from different state (%) - American Indian and Alaska Native
Geographical mobility - Moved from different state (%) - Multirace
Geographical mobility - Moved from different state (%) - Other Race
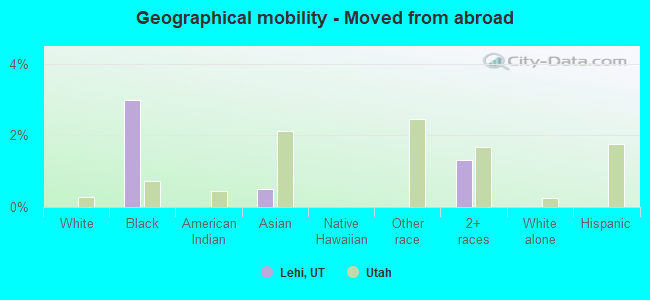
Geographical mobility - Moved from abroad (%)
Geographical mobility - Moved from abroad (%) - White
Geographical mobility - Moved from abroad (%) - Black or African American
Geographical mobility - Moved from abroad (%) - Asian
Geographical mobility - Moved from abroad (%) - Hispanic or Latino
Geographical mobility - Moved from abroad (%) - American Indian and Alaska Native
Geographical mobility - Moved from abroad (%) - Multirace
Geographical mobility - Moved from abroad (%) - Other Race
Place of birth for the foreign-born population - Ireland (%)
Place of birth for the foreign-born population - Denmark (%)
Place of birth for the foreign-born population - Norway (%)
Place of birth for the foreign-born population - Sweden (%)
Place of birth for the foreign-born population - United Kingdom (%)
Place of birth for the foreign-born population - England (%)
Place of birth for the foreign-born population - Scotland (%)
Place of birth for the foreign-born population - Other Northern Europe (%)
Place of birth for the foreign-born population - Austria (%)
Place of birth for the foreign-born population - Belgium (%)
Place of birth for the foreign-born population - France (%)
Place of birth for the foreign-born population - Germany (%)
Place of birth for the foreign-born population - Netherlands (%)
Place of birth for the foreign-born population - Switzerland (%)
Place of birth for the foreign-born population - Other Western Europe (%)
Place of birth for the foreign-born population - Greece (%)
Place of birth for the foreign-born population - Italy (%)
Place of birth for the foreign-born population - Portugal (%)
Place of birth for the foreign-born population - Spain (%)
Place of birth for the foreign-born population - Other Southern Europe (%)
Place of birth for the foreign-born population - Albania (%)
Place of birth for the foreign-born population - Belarus (%)
Place of birth for the foreign-born population - Bosnia and Herzegovina (%)
Place of birth for the foreign-born population - Bulgaria (%)
Place of birth for the foreign-born population - Croatia (%)
Place of birth for the foreign-born population - Czechoslovakia (%)
Place of birth for the foreign-born population - Hungary (%)
Place of birth for the foreign-born population - Latvia (%)
Place of birth for the foreign-born population - Lithuania (%)
Place of birth for the foreign-born population - North Macedonia (Macedonia) (%)
Place of birth for the foreign-born population - Moldova (%)
Place of birth for the foreign-born population - Poland (%)
Place of birth for the foreign-born population - Romania (%)
Place of birth for the foreign-born population - Russia (%)
Place of birth for the foreign-born population - Serbia (%)
Place of birth for the foreign-born population - Ukraine (%)
Place of birth for the foreign-born population - Other Eastern Europe (%)
Place of birth for the foreign-born population - China (%)
Place of birth for the foreign-born population - Hong Kong (%)
Place of birth for the foreign-born population - Taiwan (%)
Place of birth for the foreign-born population - Japan (%)
Place of birth for the foreign-born population - Korea (%)
Place of birth for the foreign-born population - Other Eastern Asia (%)
Place of birth for the foreign-born population - Afghanistan (%)
Place of birth for the foreign-born population - Bangladesh (%)
Place of birth for the foreign-born population - India (%)
Place of birth for the foreign-born population - Iran (%)
Place of birth for the foreign-born population - Kazakhstan (%)
Place of birth for the foreign-born population - Nepal (%)
Place of birth for the foreign-born population - Pakistan (%)
Place of birth for the foreign-born population - Sri Lanka (%)
Place of birth for the foreign-born population - Uzbekistan (%)
Place of birth for the foreign-born population - Other South Central Asia (%)
Place of birth for the foreign-born population - Burma (%)
Place of birth for the foreign-born population - Cambodia (%)
Place of birth for the foreign-born population - Indonesia (%)
Place of birth for the foreign-born population - Laos (%)
Place of birth for the foreign-born population - Malaysia (%)
Place of birth for the foreign-born population - Philippines (%)
Place of birth for the foreign-born population - Singapore (%)
Place of birth for the foreign-born population - Thailand (%)
Place of birth for the foreign-born population - Vietnam (%)
Place of birth for the foreign-born population - Other South Eastern Asia (%)
Place of birth for the foreign-born population - Armenia (%)
Place of birth for the foreign-born population - Iraq (%)
Place of birth for the foreign-born population - Israel (%)
Place of birth for the foreign-born population - Jordan (%)
Place of birth for the foreign-born population - Kuwait (%)
Place of birth for the foreign-born population - Lebanon (%)
Place of birth for the foreign-born population - Saudi Arabia (%)
Place of birth for the foreign-born population - Syria (%)
Place of birth for the foreign-born population - Turkey (%)
Place of birth for the foreign-born population - Yemen (%)
Place of birth for the foreign-born population - Other Western Asia (%)
Place of birth for the foreign-born population - Eritrea (%)
Place of birth for the foreign-born population - Ethiopia (%)
Place of birth for the foreign-born population - Kenya (%)
Place of birth for the foreign-born population - Somalia (%)
Place of birth for the foreign-born population - Uganda (%)
Place of birth for the foreign-born population - Zimbabwe (%)
Place of birth for the foreign-born population - Other Eastern Africa (%)
Place of birth for the foreign-born population - Cameroon (%)
Place of birth for the foreign-born population - Congo (%)
Place of birth for the foreign-born population - Democratic Republic of Congo (Zaire) (%)
Place of birth for the foreign-born population - Other Middle Africa (%)
Place of birth for the foreign-born population - Egypt (%)
Place of birth for the foreign-born population - Morocco (%)
Place of birth for the foreign-born population - Sudan (%)
Place of birth for the foreign-born population - Other Northern Africa (%)
Place of birth for the foreign-born population - South Africa (%)
Place of birth for the foreign-born population - Other Southern Africa (%)
Place of birth for the foreign-born population - Cabo Verde (%)
Place of birth for the foreign-born population - Ghana (%)
Place of birth for the foreign-born population - Liberia (%)
Place of birth for the foreign-born population - Nigeria (%)
Place of birth for the foreign-born population - Senegal (%)
Place of birth for the foreign-born population - Sierra Leone (%)
Place of birth for the foreign-born population - Other Western Africa (%)
Place of birth for the foreign-born population - Australia (%)
Place of birth for the foreign-born population - New Zealand (%)
Place of birth for the foreign-born population - Fiji (%)
Place of birth for the foreign-born population - Micronesia (%)
Place of birth for the foreign-born population - Bahamas (%)
Place of birth for the foreign-born population - Barbados (%)
Place of birth for the foreign-born population - Cuba (%)
Place of birth for the foreign-born population - Dominica (%)
Place of birth for the foreign-born population - Dominican Republic (%)
Place of birth for the foreign-born population - Grenada (%)
Place of birth for the foreign-born population - Haiti (%)
Place of birth for the foreign-born population - Jamaica (%)
Place of birth for the foreign-born population - St. Vincent and the Grenadines (%)
Place of birth for the foreign-born population - Trinidad and Tobago (%)
Place of birth for the foreign-born population - West Indies (%)
Place of birth for the foreign-born population - Other Caribbean (%)
Place of birth for the foreign-born population - Belize (%)
Place of birth for the foreign-born population - Costa Rica (%)
Place of birth for the foreign-born population - El Salvador (%)
Place of birth for the foreign-born population - Guatemala (%)
Place of birth for the foreign-born population - Honduras (%)
Place of birth for the foreign-born population - Mexico (%)
Place of birth for the foreign-born population - Nicaragua (%)
Place of birth for the foreign-born population - Panama (%)
Place of birth for the foreign-born population - Other Central America (%)
Place of birth for the foreign-born population - Argentina (%)
Place of birth for the foreign-born population - Bolivia (%)
Place of birth for the foreign-born population - Brazil (%)
Place of birth for the foreign-born population - Chile (%)
Place of birth for the foreign-born population - Colombia (%)
Place of birth for the foreign-born population - Ecuador (%)
Place of birth for the foreign-born population - Guyana (%)
Place of birth for the foreign-born population - Peru (%)
Place of birth for the foreign-born population - Uruguay (%)
Place of birth for the foreign-born population - Venezuela (%)
Place of birth for the foreign-born population - Other South America (%)
Place of birth for the foreign-born population - Canada (%)
Place of birth for the foreign-born population - Other Northern America (%)
Place of birth for the foreign-born population - Other (%)
Latest news about races in Lehi, UT collected exclusively by city-data.com from local newspapers, TV, and radio stations
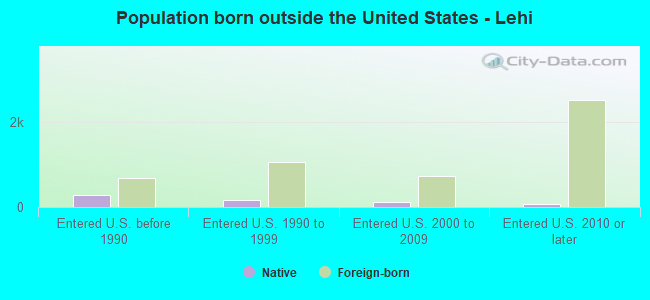
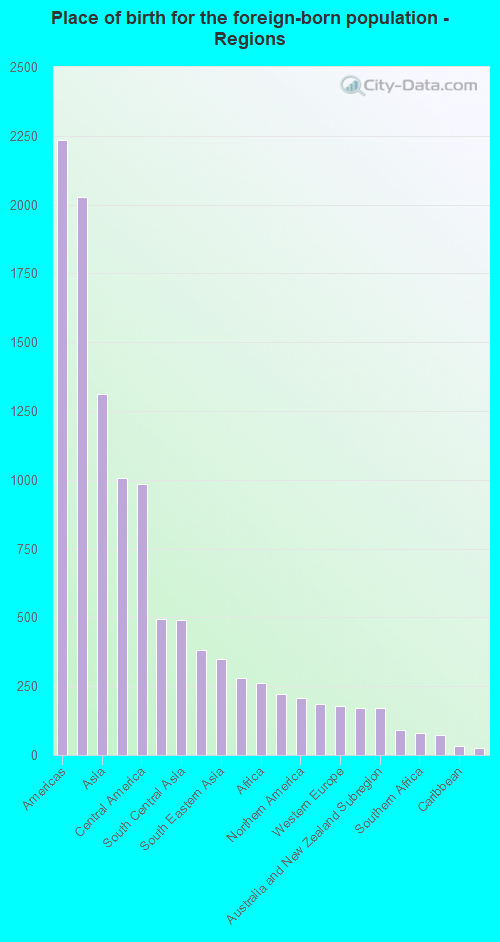
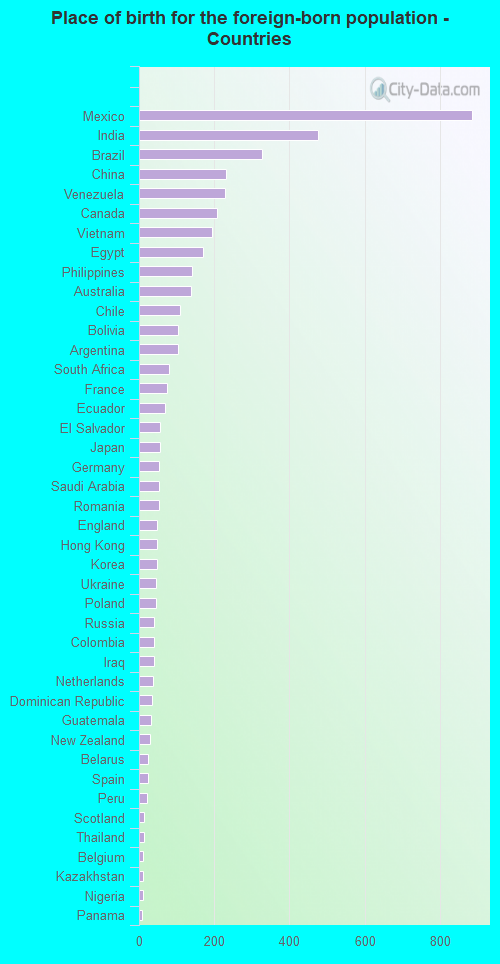
According to 2022 data, the most numerous races in Lehi, UT are White alone (68,752 residents), Hispanic (7,676 residents), and Two or more races (3,372 residents). 88.7% of Lehi residents speak English at home. 5.5% of Lehi, UT residents are foreign-born (2.5% born in Latin America, 1.6% born in Asia, 0.6% born in Europe), which is 44.9% less than the foreign-born rate of 8.0% across the entire state of Utah.
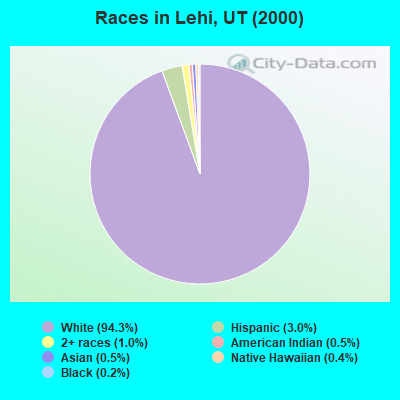
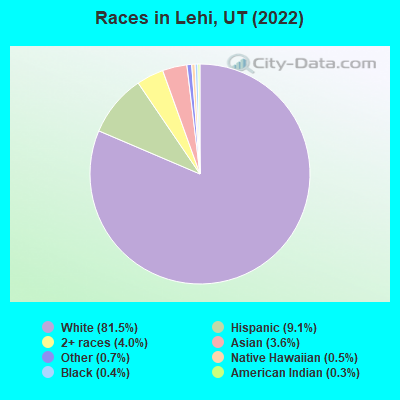
Race distribution in Lehi
2000 2022
1,904,265 85.3% White alone 201,559 9.0% Hispanic 36,483 1.6% Asian alone 31,308 1.4% Two or more races 26,663 1.2% American Indian alone 14,806 0.7% Native Hawaiian and Other 16,137 0.7% Black alone 1,948 0.09% Other race alone
2,557,466 75.6% White alone 512,086 15.1% Hispanic 119,308 3.5% Two or more races 82,388 2.4% Asian alone 36,978 1.1% Native Hawaiian and Other 34,873 1.0% Black alone 22,803 0.7% American Indian alone 14,898 0.4% Other race alone
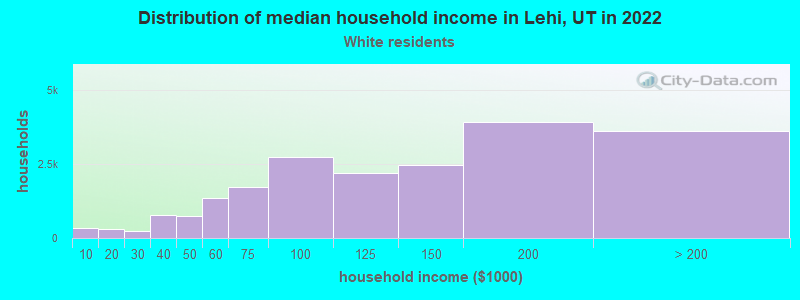
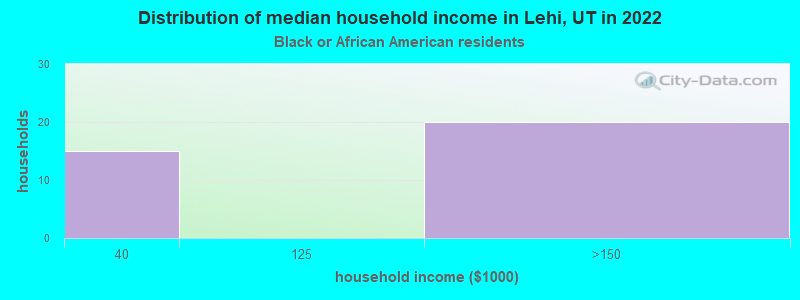
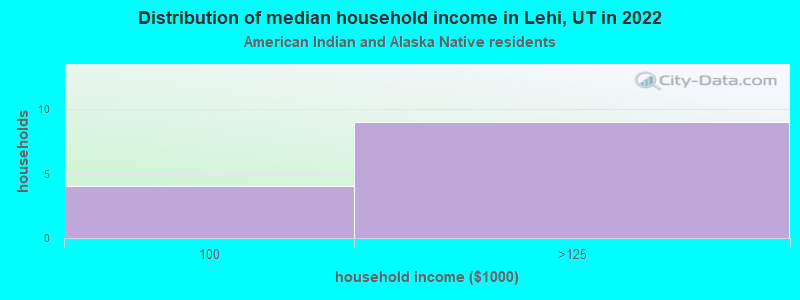
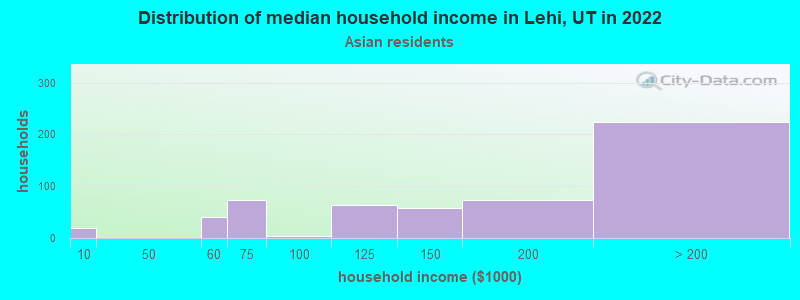
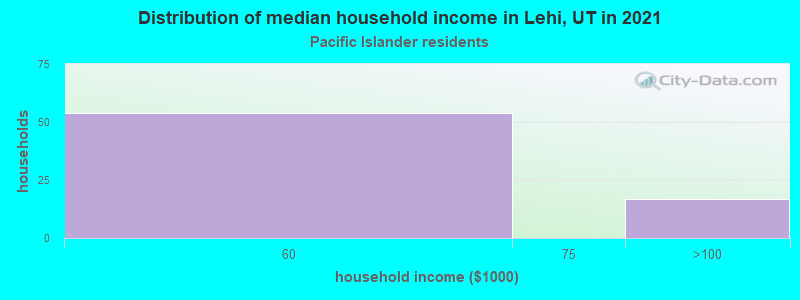
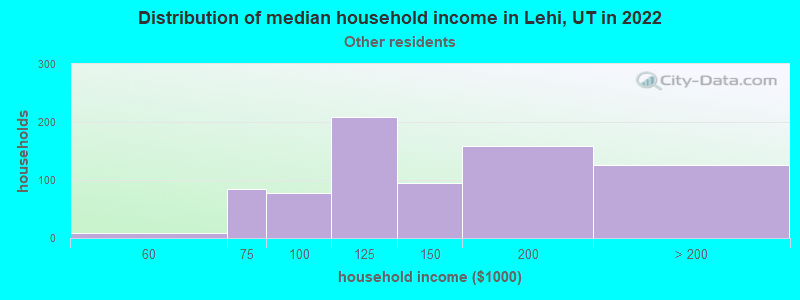
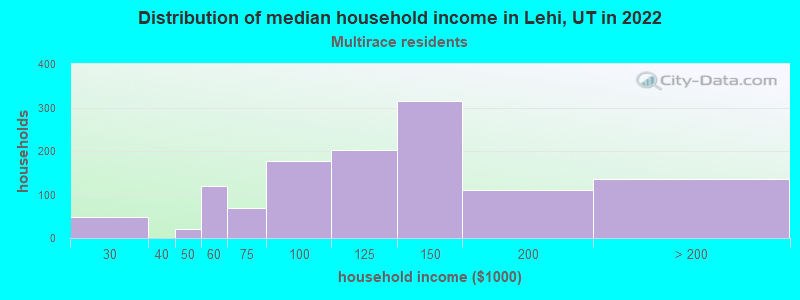
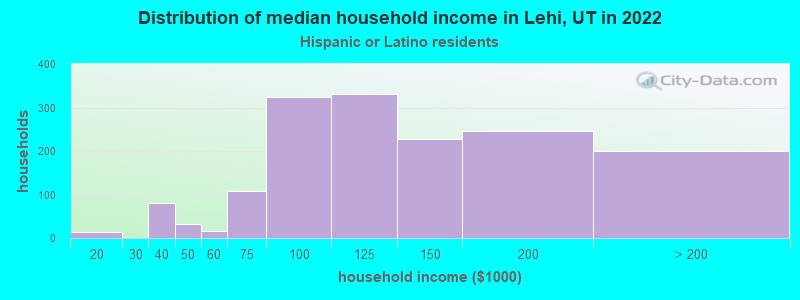
Income and house value in Lehi Median household income in 2022 $122,711 White non-Hispanic householders$156,044 Asian householders$133,057 Some other race householders$119,516 Two or more races householders$119,738 Hispanic or Latino race householdersMedian 2022 house value $627,587 White Non-Hispanic householders$576,553 American Indian or Alaska Native householders $579,927 Asian householders$685,368 Native Hawaiian and other Pacific Islander householders$579,927 Some other race householders$579,927 Two or more races householders$595,532 Hispanic or Latino householders
Median age by race in Lehi
25.9 Median age for White residents25.5 26.3 9.9 Median age for Black or African American residents9.5 15.5 22.0 Median age for American Indian / Alaska Native residents6.3 24.2 31.4 Median age for Asian residents27.7 38.1 25.4 Median age for Native Hawaiian / Pacific Islander residents31.3 18.3 31.8 Median age for Other race residents30.2 35.6 12.0 Median age for Two or more races residents10.2 15.7 26.4 Median age for White alone residents25.9 26.7 20.0 Median age for Hispanic or Latino residents19.5 20.9
Owner/renter occupied households by race in Lehi
House owners and renters - White residents 16,165 79.0% Owner occupied4,285 21.0% Renter occupiedHouse owners and renters - Black or African American residents 47 100.0% Owner occupiedHouse owners and renters - American Indian / Alaska Native residents 10 100.0% Owner occupiedHouse owners and renters - Asian residents 662 83.6% Owner occupied130 16.4% Renter occupiedHouse owners and renters - Native Hawaiian / Pacific Islander residents 86 87.9% Owner occupied12 12.1% Renter occupiedHouse owners and renters - Other race residents 528 58.2% Owner occupied379 41.8% Renter occupiedHouse owners and renters - Two or more races residents 1,036 82.6% Owner occupied218 17.4% Renter occupiedHouse owners and renters - White alone residents 15,837 79.2% Owner occupied4,171 20.8% Renter occupiedHouse owners and renters - Hispanic or Latino residents 1,047 65.4% Owner occupied554 34.6% Renter occupied
Language usage in Lehi
English speakers - Total 88.7% of residents of Lehi speak English at home.
5.8% of residents speak Spanish at home 3,404 75.2% Speak English very well1,124 24.8% Speak English less than very well5.5% of residents speak other language at home 3,041 70.9% Speak English very well1,246 29.1% Speak English less than very well
English speakers - Born in the United States 92.8% of residents of Lehi speak English at home.
4.8% of residents speak Spanish at home 1,235 100.0% Speak English very well2.4% of residents speak other language at home 601 100.0% Speak English very well
English speakers - Native, born elsewhere 65.9% of residents of Lehi speak English at home.
34.1% of residents speak other language at home 243 100.0% Speak English less than very well
English speakers - Foreign-born 25.6% of residents of Lehi speak English at home.
32.8% of residents speak Spanish at home 911 56.5% Speak English very well701 43.5% Speak English less than very well41.6% of residents speak other language at home 1,105 53.9% Speak English very well944 46.1% Speak English less than very well
White (Caucasian) - Speak only English Native:
95.5% (62,810)Foreign-born:
62.2% (483)
White (Caucasian) - Speak another language Native:
4.5% (2,959)Foreign-born:
37.8% (293)
Black or African American - Speak only English Native:
100.0% (348)Foreign-born:
65.4% (11)
American Indian / Alaska Native - Speak another language Native:
28.0% (25)Foreign-born:
96.1% (19)
Asian - Speak only English Native:
46.0% (406)Foreign-born:
25.3% (556)
Asian - Speak another language Native:
54.0% (477)Foreign-born:
74.7% (1,640)
Native Hawaiian / Pacific Islander - Speak only English Native:
55.3% (116)Foreign-born:
80.3% (116)
Native Hawaiian / Pacific Islander - Speak another language Native:
34.6% (73)Foreign-born:
32.3% (47)
Other race - Speak only English Native:
46.1% (822)Foreign-born:
3.9% (53)
Other race - Speak another language Native:
53.9% (960)Foreign-born:
96.1% (1,313)
Two or more races - Speak only English Native:
82.2% (3,263)Foreign-born:
10.7% (40)
Two or more races - Speak another language Native:
17.8% (706)Foreign-born:
89.3% (334)
White alone - Speak only English Native:
95.8% (60,778)Foreign-born:
62.2% (483)
White alone - Speak another language Native:
4.2% (2,683)Foreign-born:
37.8% (293)
Hispanic or Latino - Speak another language Native:
28.9% (1,515)Foreign-born:
100.0% (1,612)
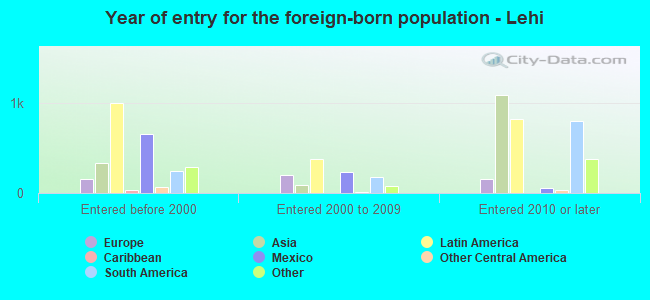
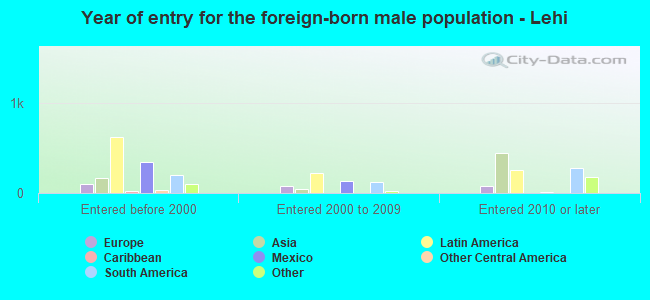
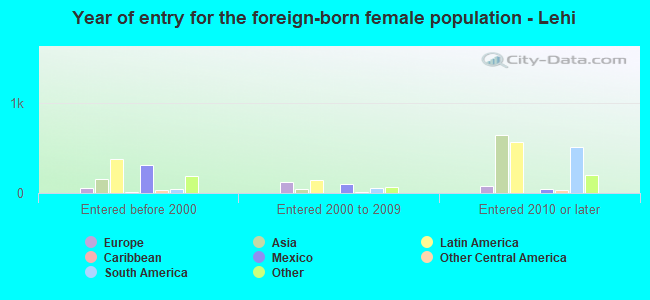
Foreign-born residents in Lehi 4,491 residents are foreign born (2.5% Latin America , 1.6% Asia , 0.6% Europe ).
Marital status for residents in Lehi Marital status - White (Caucasian) population 15 years and over
Males 30.5% Never married60.9% Now married0.0% Separated1.6% Widowed7.0% DivorcedFemales 28.4% Never married57.6% Now married0.0% Separated5.6% Widowed8.5% DivorcedWomen who gave birth in the past 12 months Now married:
100.0% (885)Unmarried:
0.0% (0)
Women who did not give birth in the past 12 months Now married:
54.5% (10,042)Unmarried:
45.5% (8,371)
Marital status - Black or African American population 15 years and over
Males 24.0% Never married68.7% Now married0.0% Separated0.0% Widowed7.3% DivorcedFemales 28.5% Never married27.7% Now married43.8% Separated0.0% Widowed0.0% DivorcedWomen who did not give birth in the past 12 months Now married:
71.5% (103)Unmarried:
28.5% (41)
Marital status - American Indian / Alaska Native population 15 years and over
Males 14.3% Never married85.7% Now married0.0% Separated0.0% Widowed0.0% DivorcedFemales 12.5% Never married71.4% Now married0.0% Separated0.0% Widowed16.1% DivorcedWomen who gave birth in the past 12 months Now married:
100.0% (5)Unmarried:
0.0% (0)
Women who did not give birth in the past 12 months Now married:
79.4% (29)Unmarried:
20.6% (8)
Marital status - Asian population 15 years and over
Males 28.8% Never married71.2% Now married0.0% Separated0.0% Widowed0.0% DivorcedFemales 23.3% Never married71.0% Now married0.0% Separated2.7% Widowed3.0% DivorcedWomen who gave birth in the past 12 months Now married:
100.0% (31)Unmarried:
0.0% (0)
Women who did not give birth in the past 12 months Now married:
65.5% (407)Unmarried:
34.5% (214)
Marital status - Native Hawaiian / Pacific Islander population 15 years and over
Males 53.2% Never married46.8% Now married0.0% Separated0.0% Widowed0.0% DivorcedFemales 16.2% Never married57.1% Now married0.0% Separated0.0% Widowed26.7% DivorcedWomen who did not give birth in the past 12 months Now married:
57.1% (99)Unmarried:
42.9% (74)
Marital status - Other race population 15 years and over
Males 42.0% Never married57.3% Now married0.6% Separated0.0% Widowed0.1% DivorcedFemales 24.8% Never married74.7% Now married0.0% Separated0.0% Widowed0.5% DivorcedWomen who gave birth in the past 12 months Now married:
100.0% (111)Unmarried:
0.0% (0)
Women who did not give birth in the past 12 months Now married:
60.4% (388)Unmarried:
39.6% (254)
Marital status - Two or more races population 15 years and over
Males 33.0% Never married64.6% Now married0.0% Separated0.0% Widowed2.4% DivorcedFemales 28.0% Never married64.9% Now married0.0% Separated0.9% Widowed6.2% DivorcedWomen who gave birth in the past 12 months Now married:
100.0% (41)Unmarried:
0.0% (0)
Women who did not give birth in the past 12 months Now married:
64.2% (659)Unmarried:
35.8% (367)
Marital status - White alone, not Hispanic / Latino population 15 years and over
Males 30.1% Never married61.2% Now married0.0% Separated1.6% Widowed7.1% DivorcedFemales 28.4% Never married57.3% Now married0.0% Separated5.7% Widowed8.6% DivorcedWomen who gave birth in the past 12 months Now married:
100.0% (835)Unmarried:
0.0% (0)
Women who did not give birth in the past 12 months Now married:
54.5% (9,847)Unmarried:
45.5% (8,208)
Marital status - Hispanic or Latino population 15 years and over
Males 30.8% Never married65.4% Now married0.3% Separated0.0% Widowed3.5% DivorcedFemales 27.8% Never married63.9% Now married3.6% Separated2.3% Widowed2.3% DivorcedWomen who gave birth in the past 12 months Now married:
100.0% (91)Unmarried:
0.0% (0)
Women who did not give birth in the past 12 months Now married:
48.2% (801)Unmarried:
51.8% (861)
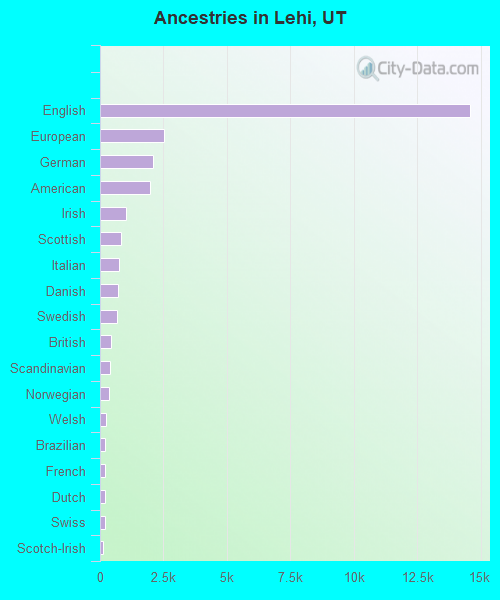
Ancestries in Lehi
14,595 41.8% English2,502 7.2% European2,076 5.9% German1,967 5.6% American1,021 2.9% Irish824 2.4% Scottish745 2.1% Italian719 2.1% Danish686 2.0% Swedish439 1.3% British401 1.1% Scandinavian339 1.0% Norwegian225 0.6% Welsh215 0.6% Brazilian212 0.6% French210 0.6% Dutch182 0.5% Swiss135 0.4% Scotch-Irish110 0.3% Egyptian92 0.3% Ukrainian75 0.2% Polish75 0.2% Greek72 0.2% Northern European67 0.2% French Canadian52 0.1% Russian43 0.1% Canadian26 0.07% Portuguese24 0.07% Romanian24 0.07% Lebanese20 0.06% Cajun20 0.06% Iraqi19 0.05% Armenian15 0.04% Belgian11 0.03% Basque11 0.03% Yugoslavian10 0.03% Hungarian7 0.02% Lithuanian7 0.02% African3 0.01% Eastern European
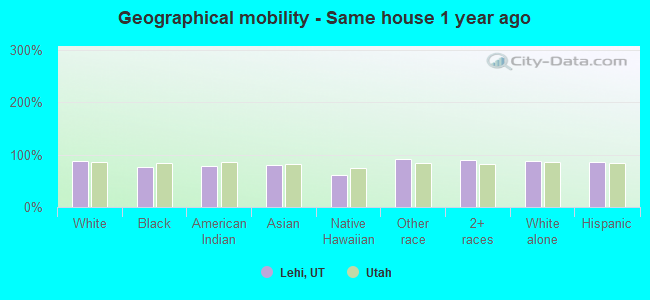
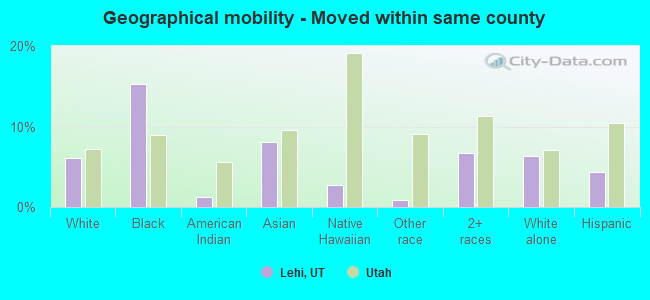
Geographical mobility in Lehi Same house 1 year ago 61,338 86.8% White (Caucasian)286 76.9% Black or African American100 78.7% American Indian / Alaska Native1,496 79.8% Asian208 60.1% Native Hawaiian / Pacific Islander2,442 91.0% Other race4,743 90.2% Two or more races59,443 87.2% White alone, not Hispanic / Latino5,537 86.1% Hispanic or LatinoMoved within same county 4,342 6.1% White / Caucasian57 15.3% Black or African American2 1.2% American Indian / Alaska Native151 8.0% Asian9 2.7% Native Hawaiian / Pacific Islander23 0.9% Other race353 6.7% Two or more races4,342 6.4% White alone, not Hispanic / Latino281 4.4% Hispanic or LatinoMoved within same state 4,005 5.7% White / Caucasian32 25.4% American Indian / Alaska Native27 1.5% Asian96 27.8% Native Hawaiian / Pacific Islander76 2.8% Other race72 1.4% Two or more races3,417 5.0% White alone, not Hispanic / Latino331 5.2% Hispanic or LatinoMoved from different state 985 1.4% White / Caucasian2 0.6% Black or African American126 6.7% Asian119 4.4% Other race46 0.9% Two or more races985 1.4% White alone, not Hispanic / Latino238 3.7% Hispanic or LatinoMoved from abroad 11 3.0% Black or African American9 0.5% Asian69 1.3% Two or more races
Children Nativity (place of birth) in Lehi
Children under 6 years - Living with two parents Both parents native 7,299 99.6% Native28 0.4% Foreign-bornBoth parents foreign-born 188 84.9% Native33 15.1% Foreign-bornOne native, one foreign-born parent 822 100.0% NativeChildren under 6 years - Living with one parent Native parent 471 100.0% NativeForeign-born parent 31 100.0% NativeChildren 6 to 17 years - Living with two parents Both parents native 17,012 100.0% Native6 0.0% Foreign-bornBoth parents foreign-born 399 61.7% Native248 38.3% Foreign-bornOne native, one foreign-born parent 905 89.8% Native102 10.2% Foreign-bornChildren 6 to 17 years - Living with one parent Native parent 1,150 100.0% NativeForeign-born parent 144 57.5% Native107 42.5% Foreign-born
Grandparents responsible for own grandchildren in Lehi
Grandparents (30 to 59 years) White / Caucasian 58 15.5% Responsible for grandchildren316 84.5% Not responsible for grandchildrenAsian 5 100.0% Responsible for grandchildrenOther race 3 100.0% Not responsible for grandchildrenTwo or more races 20 100.0% Not responsible for grandchildrenWhite alone, not Hispanic / Latino 62 14.6% Responsible for grandchildren365 85.4% Not responsible for grandchildrenHispanic or Latino 17 100.0% Not responsible for grandchildrenGrandparents (60 years and over) White / Caucasian 59 13.8% Responsible for grandchildren366 86.2% Not responsible for grandchildrenAsian 10 100.0% Not responsible for grandchildrenTwo or more races 25 100.0% Not responsible for grandchildrenWhite alone, not Hispanic / Latino 60 15.0% Responsible for grandchildren341 85.0% Not responsible for grandchildrenHispanic or Latino 57 100.0% Not responsible for grandchildren