Races in Lawrence, Massachusetts (MA) Detailed Stats
Data:
Races - White alone (%)
Races - White alone (% change since 2000)
Races - Black alone (%)
Races - Black alone (% change since 2000)
Races - American Indian alone (%)
Races - American Indian alone (% change since 2000)
Races - Asian alone (%)
Races - Asian alone (% change since 2000)
Races - Hispanic (%)
Races - Hispanic (% change since 2000)
Races - Native Hawaiian and Other Pacific Islander alone (%)
Races - Native Hawaiian and Other Pacific Islander alone (% change since 2000)
Races - Two or more races(%)
Races - Two or more races(% change since 2000)
Races - Other race alone (%)
Races - Other race alone (% change since 2000)
Racial diversity
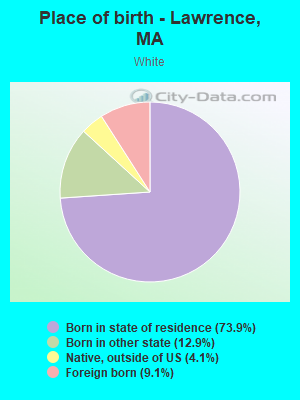
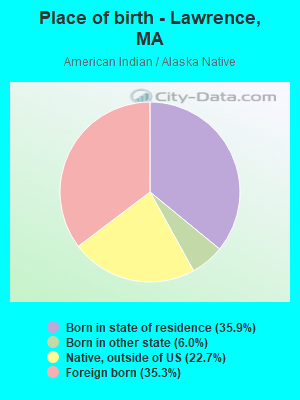
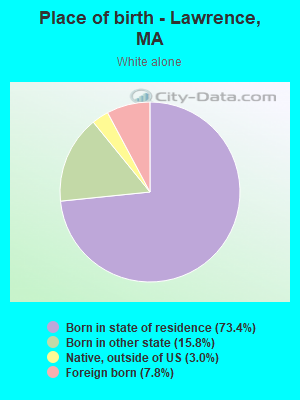
Place of birth - Born in state of residence (%)
Place of birth - Born in state of residence (%) - White
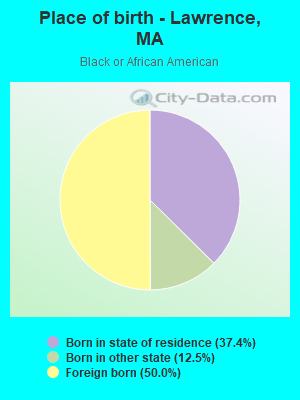
Place of birth - Born in state of residence (%) - Black or African American
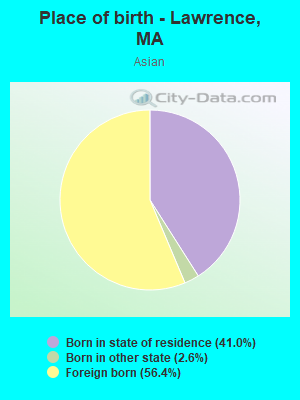
Place of birth - Born in state of residence (%) - Asian
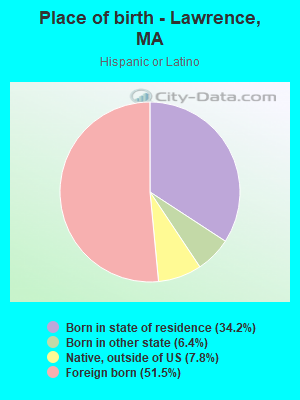
Place of birth - Born in state of residence (%) - Hispanic or Latino
Place of birth - Born in state of residence (%) - American Indian and Alaska Native
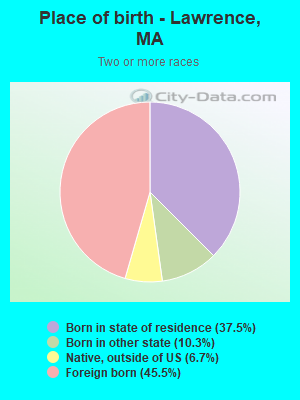
Place of birth - Born in state of residence (%) - Multirace
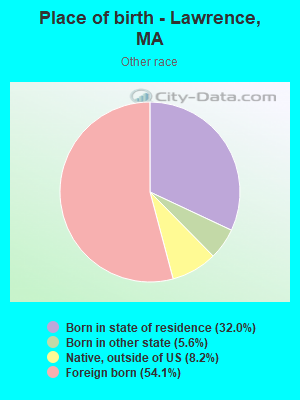
Place of birth - Born in state of residence (%) - Other Race
Place of birth - Born in other state (%)
Place of birth - Born in other state (%) - White
Place of birth - Born in other state (%) - Black or African American
Place of birth - Born in other state (%) - Asian
Place of birth - Born in other state (%) - Hispanic or Latino
Place of birth - Born in other state (%) - American Indian and Alaska Native
Place of birth - Born in other state (%) - Multirace
Place of birth - Born in other state (%) - Other Race
Place of birth - Native, outside of US (%)
Place of birth - Native, outside of US (%) - White
Place of birth - Native, outside of US (%) - Black or African American
Place of birth - Native, outside of US (%) - Asian
Place of birth - Native, outside of US (%) - Hispanic or Latino
Place of birth - Native, outside of US (%) - American Indian and Alaska Native
Place of birth - Native, outside of US (%) - Multirace
Place of birth - Native, outside of US (%) - Other Race
Place of birth - Foreign born (%)
Place of birth - Foreign born (%) - White
Place of birth - Foreign born (%) - Black or African American
Place of birth - Foreign born (%) - Asian
Place of birth - Foreign born (%) - Hispanic or Latino
Place of birth - Foreign born (%) - American Indian and Alaska Native
Place of birth - Foreign born (%) - Multirace
Place of birth - Foreign born (%) - Other Race
Residents speaking English at home (%)
Residents speaking English at home - Born in the United States (%)
Residents speaking English at home - Native, born elsewhere (%)
Residents speaking English at home - Foreign born (%)
Residents speaking Spanish at home (%)
Residents speaking Spanish at home - Born in the United States (%)
Residents speaking Spanish at home - Native, born elsewhere (%)
Residents speaking Spanish at home - Foreign born (%)
Residents speaking other language at home (%)
Residents speaking other language at home - Born in the United States (%)
Residents speaking other language at home - Native, born elsewhere (%)
Residents speaking other language at home - Foreign born (%)
Marital status - Never married (%)
Marital status - Now married (%)
Marital status - Separated (%)
Marital status - Widowed (%)
Marital status - Divorced (%)
Ancestries Reported - Arab (%)
Ancestries Reported - Czech (%)
Ancestries Reported - Danish (%)
Ancestries Reported - Dutch (%)
Ancestries Reported - English (%)
Ancestries Reported - French (%)
Ancestries Reported - French Canadian (%)
Ancestries Reported - German (%)
Ancestries Reported - Greek (%)
Ancestries Reported - Hungarian (%)
Ancestries Reported - Irish (%)
Ancestries Reported - Italian (%)
Ancestries Reported - Lithuanian (%)
Ancestries Reported - Norwegian (%)
Ancestries Reported - Polish (%)
Ancestries Reported - Portuguese (%)
Ancestries Reported - Russian (%)
Ancestries Reported - Scotch-Irish (%)
Ancestries Reported - Scottish (%)
Ancestries Reported - Slovak (%)
Ancestries Reported - Subsaharan African (%)
Ancestries Reported - Swedish (%)
Ancestries Reported - Swiss (%)
Ancestries Reported - Ukrainian (%)
Ancestries Reported - United States (%)
Ancestries Reported - Welsh (%)
Ancestries Reported - West Indian (%)
Ancestries Reported - Other (%)
Geographical mobility - Same house 1 year ago (%)
Geographical mobility - Same house 1 year ago (%) - White
Geographical mobility - Same house 1 year ago (%) - Black or African American
Geographical mobility - Same house 1 year ago (%) - Asian
Geographical mobility - Same house 1 year ago (%) - Hispanic or Latino
Geographical mobility - Same house 1 year ago (%) - American Indian and Alaska Native
Geographical mobility - Same house 1 year ago (%) - Multirace
Geographical mobility - Same house 1 year ago (%) - Other Race
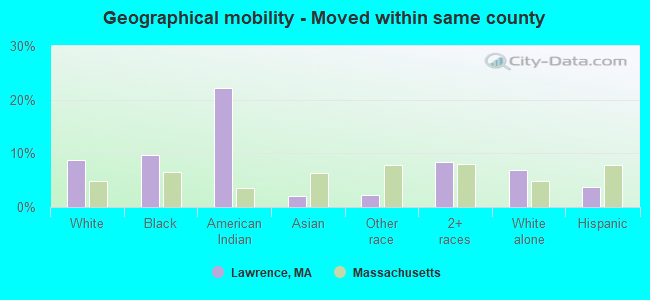
Geographical mobility - Moved within same county (%)
Geographical mobility - Moved within same county (%) - White
Geographical mobility - Moved within same county (%) - Black or African American
Geographical mobility - Moved within same county (%) - Asian
Geographical mobility - Moved within same county (%) - Hispanic or Latino
Geographical mobility - Moved within same county (%) - American Indian and Alaska Native
Geographical mobility - Moved within same county (%) - Multirace
Geographical mobility - Moved within same county (%) - Other Race
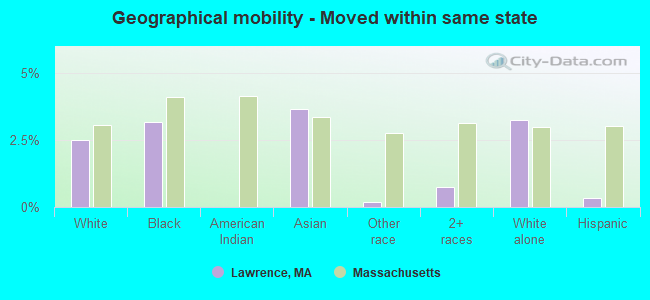
Geographical mobility - Moved from different county within same state (%)
Geographical mobility - Moved from different county within same state (%) - White
Geographical mobility - Moved from different county within same state (%) - Black or African American
Geographical mobility - Moved from different county within same state (%) - Asian
Geographical mobility - Moved from different county within same state (%) - Hispanic or Latino
Geographical mobility - Moved from different county within same state (%) - American Indian and Alaska Native
Geographical mobility - Moved from different county within same state (%) - Multirace
Geographical mobility - Moved from different county within same state (%) - Other Race
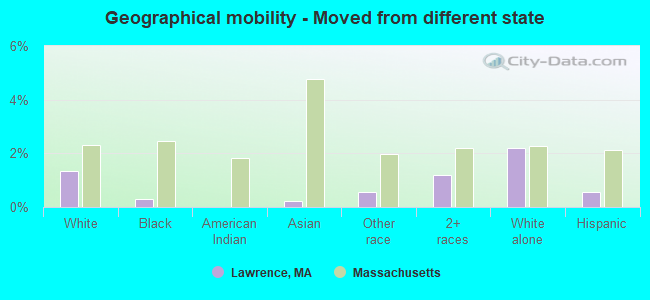
Geographical mobility - Moved from different state (%)
Geographical mobility - Moved from different state (%) - White
Geographical mobility - Moved from different state (%) - Black or African American
Geographical mobility - Moved from different state (%) - Asian
Geographical mobility - Moved from different state (%) - Hispanic or Latino
Geographical mobility - Moved from different state (%) - American Indian and Alaska Native
Geographical mobility - Moved from different state (%) - Multirace
Geographical mobility - Moved from different state (%) - Other Race
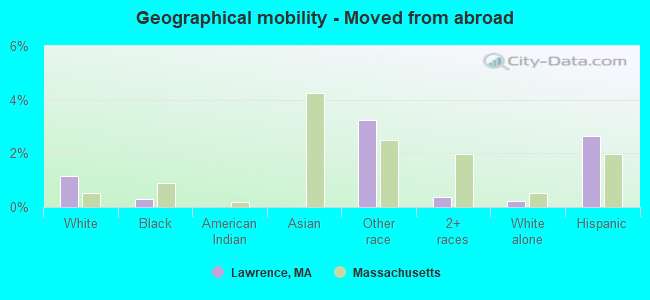
Geographical mobility - Moved from abroad (%)
Geographical mobility - Moved from abroad (%) - White
Geographical mobility - Moved from abroad (%) - Black or African American
Geographical mobility - Moved from abroad (%) - Asian
Geographical mobility - Moved from abroad (%) - Hispanic or Latino
Geographical mobility - Moved from abroad (%) - American Indian and Alaska Native
Geographical mobility - Moved from abroad (%) - Multirace
Geographical mobility - Moved from abroad (%) - Other Race
Place of birth for the foreign-born population - Ireland (%)
Place of birth for the foreign-born population - Denmark (%)
Place of birth for the foreign-born population - Norway (%)
Place of birth for the foreign-born population - Sweden (%)
Place of birth for the foreign-born population - United Kingdom (%)
Place of birth for the foreign-born population - England (%)
Place of birth for the foreign-born population - Scotland (%)
Place of birth for the foreign-born population - Other Northern Europe (%)
Place of birth for the foreign-born population - Austria (%)
Place of birth for the foreign-born population - Belgium (%)
Place of birth for the foreign-born population - France (%)
Place of birth for the foreign-born population - Germany (%)
Place of birth for the foreign-born population - Netherlands (%)
Place of birth for the foreign-born population - Switzerland (%)
Place of birth for the foreign-born population - Other Western Europe (%)
Place of birth for the foreign-born population - Greece (%)
Place of birth for the foreign-born population - Italy (%)
Place of birth for the foreign-born population - Portugal (%)
Place of birth for the foreign-born population - Spain (%)
Place of birth for the foreign-born population - Other Southern Europe (%)
Place of birth for the foreign-born population - Albania (%)
Place of birth for the foreign-born population - Belarus (%)
Place of birth for the foreign-born population - Bosnia and Herzegovina (%)
Place of birth for the foreign-born population - Bulgaria (%)
Place of birth for the foreign-born population - Croatia (%)
Place of birth for the foreign-born population - Czechoslovakia (%)
Place of birth for the foreign-born population - Hungary (%)
Place of birth for the foreign-born population - Latvia (%)
Place of birth for the foreign-born population - Lithuania (%)
Place of birth for the foreign-born population - North Macedonia (Macedonia) (%)
Place of birth for the foreign-born population - Moldova (%)
Place of birth for the foreign-born population - Poland (%)
Place of birth for the foreign-born population - Romania (%)
Place of birth for the foreign-born population - Russia (%)
Place of birth for the foreign-born population - Serbia (%)
Place of birth for the foreign-born population - Ukraine (%)
Place of birth for the foreign-born population - Other Eastern Europe (%)
Place of birth for the foreign-born population - China (%)
Place of birth for the foreign-born population - Hong Kong (%)
Place of birth for the foreign-born population - Taiwan (%)
Place of birth for the foreign-born population - Japan (%)
Place of birth for the foreign-born population - Korea (%)
Place of birth for the foreign-born population - Other Eastern Asia (%)
Place of birth for the foreign-born population - Afghanistan (%)
Place of birth for the foreign-born population - Bangladesh (%)
Place of birth for the foreign-born population - India (%)
Place of birth for the foreign-born population - Iran (%)
Place of birth for the foreign-born population - Kazakhstan (%)
Place of birth for the foreign-born population - Nepal (%)
Place of birth for the foreign-born population - Pakistan (%)
Place of birth for the foreign-born population - Sri Lanka (%)
Place of birth for the foreign-born population - Uzbekistan (%)
Place of birth for the foreign-born population - Other South Central Asia (%)
Place of birth for the foreign-born population - Burma (%)
Place of birth for the foreign-born population - Cambodia (%)
Place of birth for the foreign-born population - Indonesia (%)
Place of birth for the foreign-born population - Laos (%)
Place of birth for the foreign-born population - Malaysia (%)
Place of birth for the foreign-born population - Philippines (%)
Place of birth for the foreign-born population - Singapore (%)
Place of birth for the foreign-born population - Thailand (%)
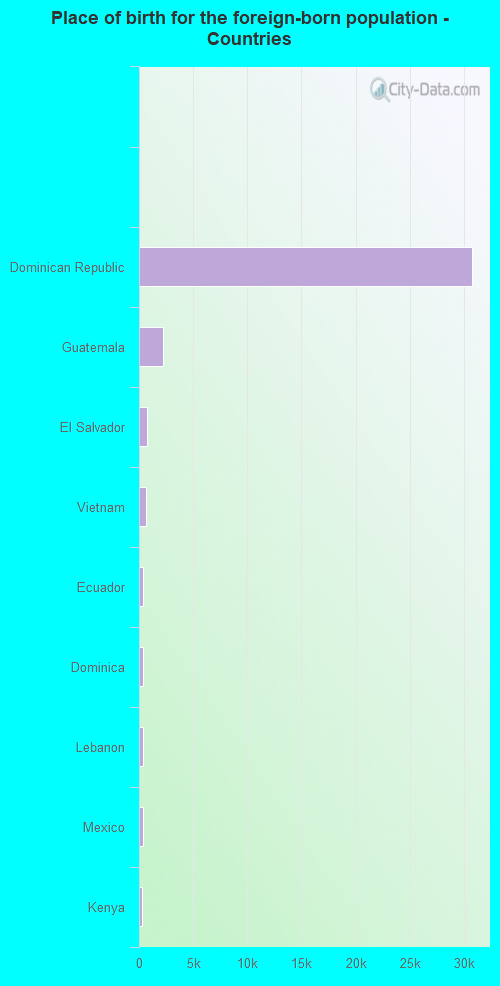
Place of birth for the foreign-born population - Vietnam (%)
Place of birth for the foreign-born population - Other South Eastern Asia (%)
Place of birth for the foreign-born population - Armenia (%)
Place of birth for the foreign-born population - Iraq (%)
Place of birth for the foreign-born population - Israel (%)
Place of birth for the foreign-born population - Jordan (%)
Place of birth for the foreign-born population - Kuwait (%)
Place of birth for the foreign-born population - Lebanon (%)
Place of birth for the foreign-born population - Saudi Arabia (%)
Place of birth for the foreign-born population - Syria (%)
Place of birth for the foreign-born population - Turkey (%)
Place of birth for the foreign-born population - Yemen (%)
Place of birth for the foreign-born population - Other Western Asia (%)
Place of birth for the foreign-born population - Eritrea (%)
Place of birth for the foreign-born population - Ethiopia (%)
Place of birth for the foreign-born population - Kenya (%)
Place of birth for the foreign-born population - Somalia (%)
Place of birth for the foreign-born population - Uganda (%)
Place of birth for the foreign-born population - Zimbabwe (%)
Place of birth for the foreign-born population - Other Eastern Africa (%)
Place of birth for the foreign-born population - Cameroon (%)
Place of birth for the foreign-born population - Congo (%)
Place of birth for the foreign-born population - Democratic Republic of Congo (Zaire) (%)
Place of birth for the foreign-born population - Other Middle Africa (%)
Place of birth for the foreign-born population - Egypt (%)
Place of birth for the foreign-born population - Morocco (%)
Place of birth for the foreign-born population - Sudan (%)
Place of birth for the foreign-born population - Other Northern Africa (%)
Place of birth for the foreign-born population - South Africa (%)
Place of birth for the foreign-born population - Other Southern Africa (%)
Place of birth for the foreign-born population - Cabo Verde (%)
Place of birth for the foreign-born population - Ghana (%)
Place of birth for the foreign-born population - Liberia (%)
Place of birth for the foreign-born population - Nigeria (%)
Place of birth for the foreign-born population - Senegal (%)
Place of birth for the foreign-born population - Sierra Leone (%)
Place of birth for the foreign-born population - Other Western Africa (%)
Place of birth for the foreign-born population - Australia (%)
Place of birth for the foreign-born population - New Zealand (%)
Place of birth for the foreign-born population - Fiji (%)
Place of birth for the foreign-born population - Micronesia (%)
Place of birth for the foreign-born population - Bahamas (%)
Place of birth for the foreign-born population - Barbados (%)
Place of birth for the foreign-born population - Cuba (%)
Place of birth for the foreign-born population - Dominica (%)
Place of birth for the foreign-born population - Dominican Republic (%)
Place of birth for the foreign-born population - Grenada (%)
Place of birth for the foreign-born population - Haiti (%)
Place of birth for the foreign-born population - Jamaica (%)
Place of birth for the foreign-born population - St. Vincent and the Grenadines (%)
Place of birth for the foreign-born population - Trinidad and Tobago (%)
Place of birth for the foreign-born population - West Indies (%)
Place of birth for the foreign-born population - Other Caribbean (%)
Place of birth for the foreign-born population - Belize (%)
Place of birth for the foreign-born population - Costa Rica (%)
Place of birth for the foreign-born population - El Salvador (%)
Place of birth for the foreign-born population - Guatemala (%)
Place of birth for the foreign-born population - Honduras (%)
Place of birth for the foreign-born population - Mexico (%)
Place of birth for the foreign-born population - Nicaragua (%)
Place of birth for the foreign-born population - Panama (%)
Place of birth for the foreign-born population - Other Central America (%)
Place of birth for the foreign-born population - Argentina (%)
Place of birth for the foreign-born population - Bolivia (%)
Place of birth for the foreign-born population - Brazil (%)
Place of birth for the foreign-born population - Chile (%)
Place of birth for the foreign-born population - Colombia (%)
Place of birth for the foreign-born population - Ecuador (%)
Place of birth for the foreign-born population - Guyana (%)
Place of birth for the foreign-born population - Peru (%)
Place of birth for the foreign-born population - Uruguay (%)
Place of birth for the foreign-born population - Venezuela (%)
Place of birth for the foreign-born population - Other South America (%)
Place of birth for the foreign-born population - Canada (%)
Place of birth for the foreign-born population - Other Northern America (%)
Place of birth for the foreign-born population - Other (%)
Latest news about races in Lawrence, MA collected exclusively by city-data.com from local newspapers, TV, and radio stations
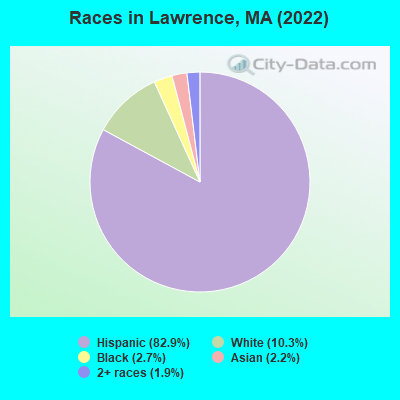
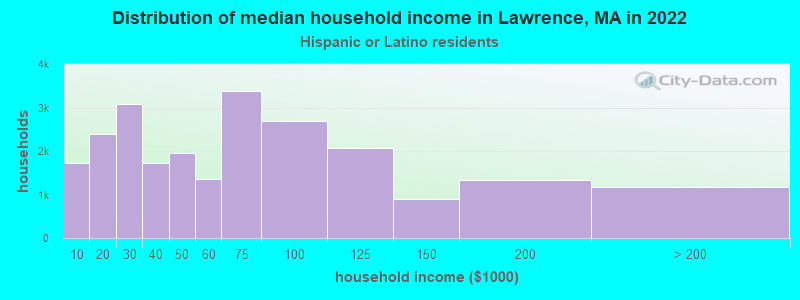
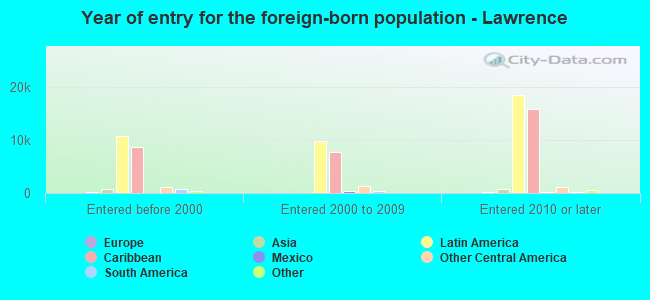
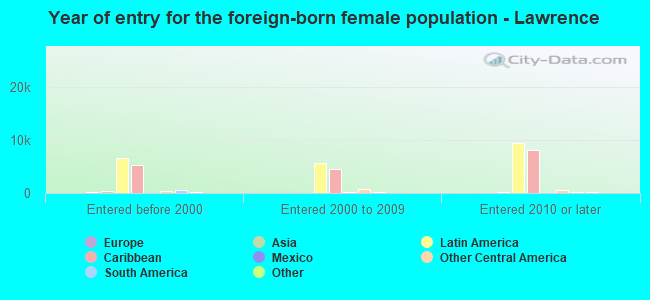
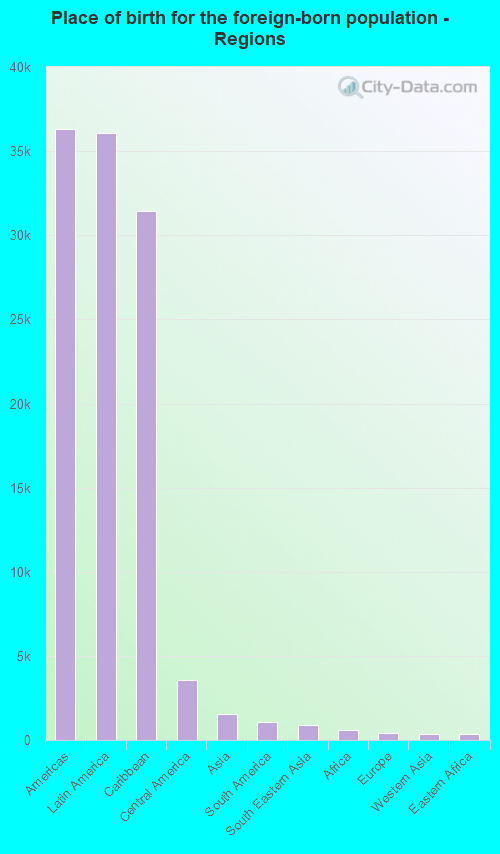
According to 2022 data, the most numerous races in Lawrence, MA are White alone (9,094 residents), Hispanic (72,904 residents), and Asian alone (1,920 residents). 23.0% of Lawrence residents speak English at home. 44.1% of Lawrence, MA residents are foreign-born (39.9% born in Latin America), which is 59.2% greater than the foreign-born rate of 18.0% across the entire state of Massachusetts.
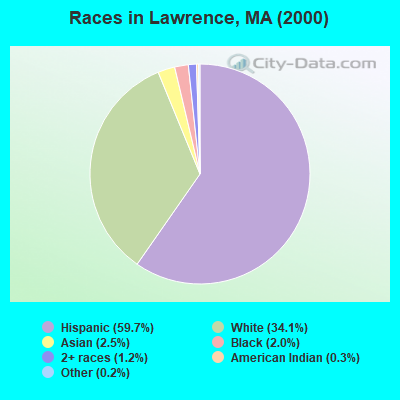
Race distribution in Lawrence
2000 2022
5,198,359 81.9% White alone 428,729 6.8% Hispanic 318,329 5.0% Black alone 236,786 3.7% Asian alone 110,338 1.7% Two or more races 43,586 0.7% Other race alone 11,264 0.2% American Indian alone 1,706 0.03% Native Hawaiian and Other
4,676,627 67.0% White alone 911,038 13.0% Hispanic 501,463 7.2% Asian alone 459,740 6.6% Black alone 341,889 4.9% Two or more races 84,403 1.2% Other race alone 5,838 0.08% American Indian alone 976 0.01% Native Hawaiian and Other
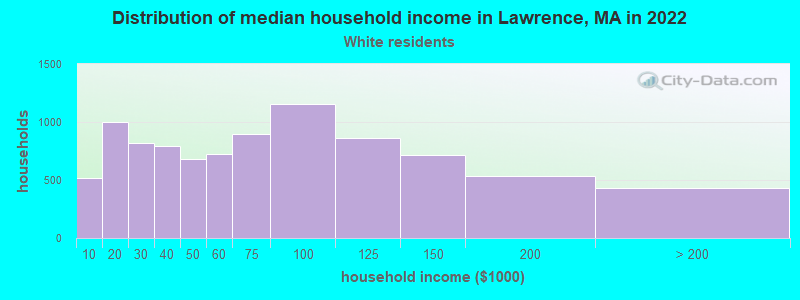
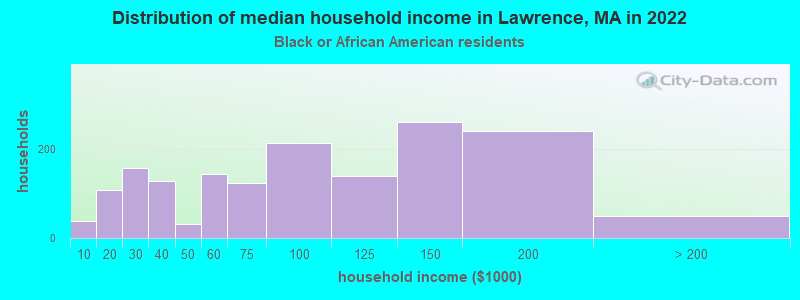
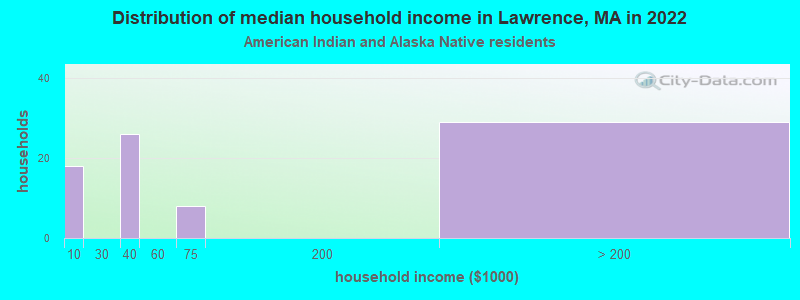
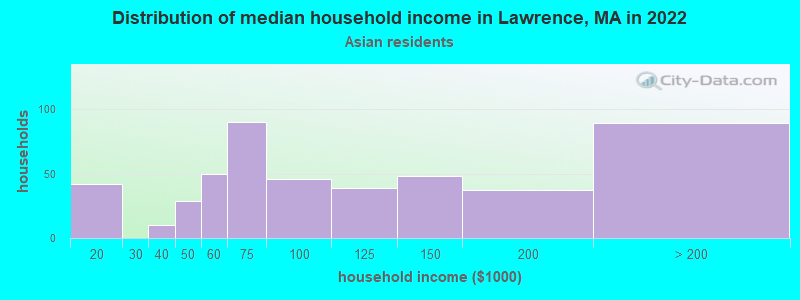
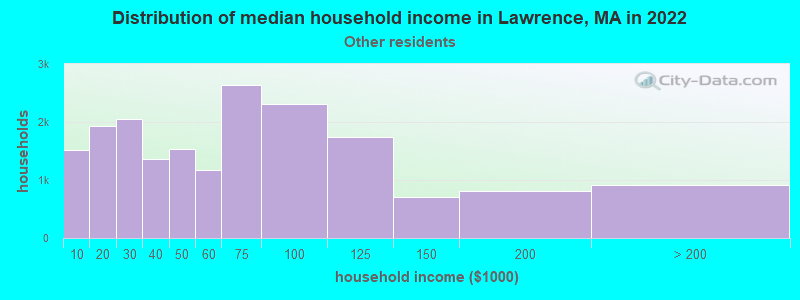
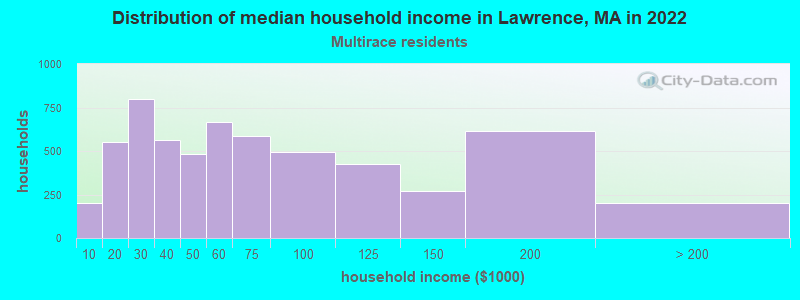
Income and house value in Lawrence Median household income in 2022 $52,220 White non-Hispanic householders$72,985 Black householders$68,462 Asian householders$58,980 Some other race householders$61,903 Two or more races householders$58,435 Hispanic or Latino race householdersMedian 2022 house value $418,217 White Non-Hispanic householders$383,425 Black or African American householders$463,410 American Indian or Alaska Native householders $347,557 Asian householders$383,067 Some other race householders$464,128 Two or more races householders$365,491 Hispanic or Latino householders
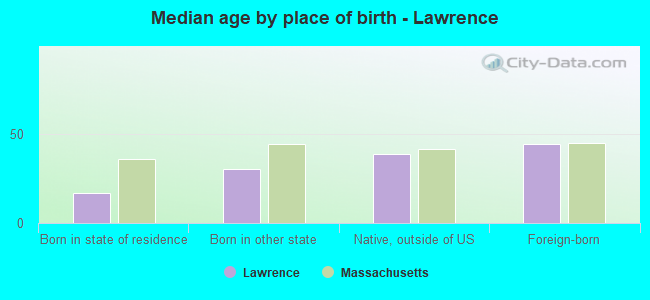
Median age by race in Lawrence
53.3 Median age for White residents56.6 51.4 22.6 Median age for Black or African American residents22.7 19.9 -666,666,666.0 Median age for American Indian / Alaska Native residents-666,666,666.0 -666,666,666.0 30.4 Median age for Asian residents37.1 24.9 -666,666,666.0 Median age for Native Hawaiian / Pacific Islander residents-666,666,666.0 -666,666,666.0 30.3 Median age for Other race residents27.4 33.3 29.0 Median age for Two or more races residents15.5 32.7 56.4 Median age for White alone residents59.2 52.8 29.1 Median age for Hispanic or Latino residents26.0 33.1
Owner/renter occupied households by race in Lawrence
House owners and renters - White residents 2,457 50.6% Owner occupied2,397 49.4% Renter occupiedHouse owners and renters - Black or African American residents 230 23.6% Owner occupied743 76.4% Renter occupiedHouse owners and renters - American Indian / Alaska Native residents 44 54.0% Owner occupied37 46.0% Renter occupiedHouse owners and renters - Asian residents 352 58.1% Owner occupied254 41.9% Renter occupiedHouse owners and renters - Other race residents 4,144 22.2% Owner occupied14,537 77.8% Renter occupiedHouse owners and renters - Two or more races residents 1,466 30.8% Owner occupied3,293 69.2% Renter occupiedHouse owners and renters - White alone residents 2,248 54.3% Owner occupied1,894 45.7% Renter occupiedHouse owners and renters - Hispanic or Latino residents 5,667 23.9% Owner occupied18,083 76.1% Renter occupied
Language usage in Lawrence
English speakers - Total 23.0% of residents of Lawrence speak English at home.
72.0% of residents speak Spanish at home 24,200 41.1% Speak English very well34,708 58.9% Speak English less than very well5.1% of residents speak other language at home 2,638 63.6% Speak English very well1,510 36.4% Speak English less than very well
English speakers - Born in the United States 47.0% of residents of Lawrence speak English at home.
51.3% of residents speak Spanish at home 2,765 82.6% Speak English very well584 17.4% Speak English less than very well1.7% of residents speak other language at home 111 100.0% Speak English very well
English speakers - Native, born elsewhere 8.7% of residents of Lawrence speak English at home.
91.3% of residents speak Spanish at home 2,776 50.7% Speak English very well2,698 49.3% Speak English less than very well
English speakers - Foreign-born 5.9% of residents of Lawrence speak English at home.
86.8% of residents speak Spanish at home 7,592 21.4% Speak English very well27,917 78.6% Speak English less than very well7.3% of residents speak other language at home 1,618 54.2% Speak English very well1,365 45.8% Speak English less than very well
White (Caucasian) - Speak only English Native:
81.7% (7,748)Foreign-born:
28.7% (290)
White (Caucasian) - Speak another language Native:
18.3% (1,734)Foreign-born:
71.3% (719)
Black or African American - Speak only English Native:
69.6% (1,236)Foreign-born:
13.8% (334)
Black or African American - Speak another language Native:
28.0% (498)Foreign-born:
82.2% (1,987)
American Indian / Alaska Native - Speak only English Native:
39.3% (58)Foreign-born:
3.4% (7)
American Indian / Alaska Native - Speak another language Native:
69.5% (103)Foreign-born:
100.0% (205)
Asian - Speak only English Native:
42.7% (336)Foreign-born:
9.8% (115)
Asian - Speak another language Native:
54.5% (429)Foreign-born:
90.9% (1,064)
Other race - Speak only English Native:
17.0% (3,831)Foreign-born:
5.9% (1,788)
Other race - Speak another language Native:
83.0% (18,693)Foreign-born:
94.1% (28,523)
Two or more races - Speak only English Native:
44.6% (2,633)Foreign-born:
3.1% (189)
Two or more races - Speak another language Native:
55.4% (3,272)Foreign-born:
96.9% (5,976)
White alone - Speak only English Native:
90.7% (7,407)Foreign-born:
40.8% (290)
White alone - Speak another language Native:
9.3% (763)Foreign-born:
59.2% (420)
Hispanic or Latino - Speak only English Native:
25.6% (7,755)Foreign-born:
5.5% (2,055)
Hispanic or Latino - Speak another language Native:
74.4% (22,540)Foreign-born:
94.5% (35,411)
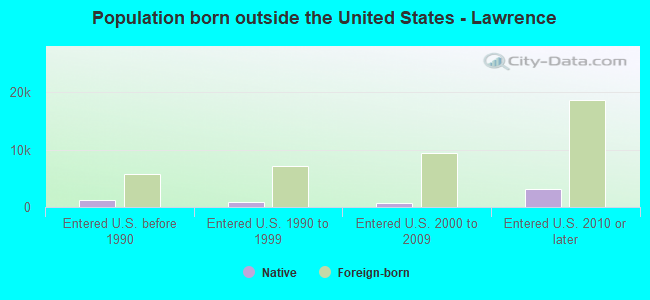
Foreign-born residents in Lawrence 38,879 residents are foreign born (39.9% Latin America ).
This city:
44.1%Massachusetts:
17.6%
Marital status for residents in Lawrence Marital status - White (Caucasian) population 15 years and over
Males 40.8% Never married40.8% Now married3.5% Separated6.5% Widowed8.3% DivorcedFemales 55.7% Never married24.0% Now married3.2% Separated2.8% Widowed14.3% DivorcedWomen who gave birth in the past 12 months Now married:
34.4% (134)Unmarried:
65.6% (256)
Women who did not give birth in the past 12 months Now married:
27.8% (1,199)Unmarried:
72.2% (3,108)
Marital status - Black or African American population 15 years and over
Males 33.5% Never married34.1% Now married11.3% Separated3.3% Widowed17.8% DivorcedFemales 48.7% Never married36.9% Now married2.3% Separated6.7% Widowed5.4% DivorcedWomen who gave birth in the past 12 months Now married:
50.6% (36)Unmarried:
49.4% (36)
Women who did not give birth in the past 12 months Now married:
33.8% (323)Unmarried:
66.2% (632)
Marital status - American Indian / Alaska Native population 15 years and over
Males 6.1% Never married50.0% Now married0.0% Separated0.0% Widowed43.9% DivorcedFemales 20.0% Never married45.7% Now married0.0% Separated0.0% Widowed34.3% DivorcedWomen who did not give birth in the past 12 months Now married:
14.0% (7)Unmarried:
86.0% (44)
Marital status - Asian population 15 years and over
Males 64.6% Never married33.1% Now married0.0% Separated0.8% Widowed1.5% DivorcedFemales 43.1% Never married42.4% Now married0.0% Separated6.7% Widowed7.8% DivorcedWomen who gave birth in the past 12 months Now married:
100.0% (12)Unmarried:
0.0% (0)
Women who did not give birth in the past 12 months Now married:
17.8% (56)Unmarried:
82.2% (257)
Marital status - Other race population 15 years and over
Males 48.5% Never married39.4% Now married3.8% Separated1.9% Widowed6.4% DivorcedFemales 53.9% Never married28.5% Now married3.2% Separated3.2% Widowed11.2% DivorcedWomen who gave birth in the past 12 months Now married:
48.8% (265)Unmarried:
51.2% (278)
Women who did not give birth in the past 12 months Now married:
27.6% (4,405)Unmarried:
72.4% (11,550)
Marital status - Two or more races population 15 years and over
Males 45.4% Never married47.7% Now married2.5% Separated0.5% Widowed3.9% DivorcedFemales 61.0% Never married28.6% Now married0.0% Separated0.7% Widowed9.7% DivorcedWomen who gave birth in the past 12 months Now married:
28.7% (55)Unmarried:
71.3% (136)
Women who did not give birth in the past 12 months Now married:
33.9% (1,367)Unmarried:
66.1% (2,672)
Marital status - White alone, not Hispanic / Latino population 15 years and over
Males 40.4% Never married44.2% Now married3.0% Separated7.0% Widowed5.5% DivorcedFemales 55.7% Never married26.1% Now married3.0% Separated3.5% Widowed11.7% DivorcedWomen who gave birth in the past 12 months Now married:
17.9% (27)Unmarried:
82.1% (125)
Women who did not give birth in the past 12 months Now married:
34.7% (619)Unmarried:
65.3% (1,165)
Marital status - Hispanic or Latino population 15 years and over
Males 47.2% Never married40.0% Now married4.6% Separated1.7% Widowed6.6% DivorcedFemales 55.7% Never married27.6% Now married2.6% Separated2.7% Widowed11.5% DivorcedWomen who gave birth in the past 12 months Now married:
31.0% (265)Unmarried:
69.0% (591)
Women who did not give birth in the past 12 months Now married:
27.3% (5,607)Unmarried:
72.7% (14,961)
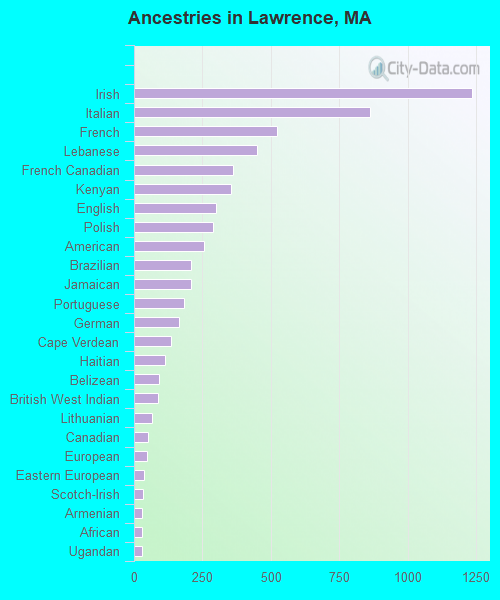
Ancestries in Lawrence
1,236 1.8% Irish863 1.3% Italian524 0.8% French451 0.7% Lebanese363 0.5% French Canadian353 0.5% Kenyan298 0.4% English288 0.4% Polish255 0.4% American210 0.3% Brazilian208 0.3% Jamaican181 0.3% Portuguese164 0.2% German136 0.2% Cape Verdean115 0.2% Haitian91 0.1% Belizean87 0.1% British West Indian64 0.10% Lithuanian52 0.08% Canadian46 0.07% European35 0.05% Eastern European34 0.05% Scotch-Irish31 0.05% Armenian30 0.04% African28 0.04% Ugandan23 0.03% Ukrainian22 0.03% Swedish20 0.03% Greek19 0.03% Dutch17 0.03% Ethiopian17 0.03% West Indian13 0.02% Ghanaian13 0.02% British8 0.01% Iranian8 0.01% Norwegian6 0.01% Russian6 0.01% Scottish5 0.01% Finnish
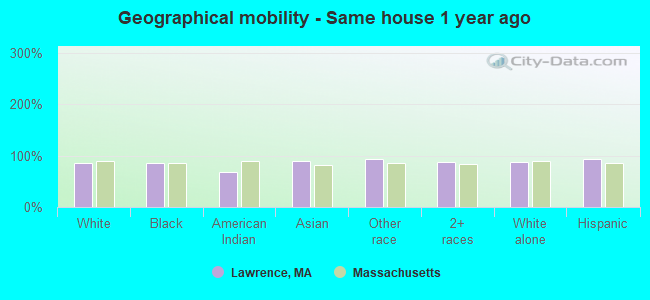
Geographical mobility in Lawrence Same house 1 year ago 17,956 85.8% White (Caucasian)3,860 86.6% Black or African American234 68.2% American Indian / Alaska Native1,838 90.6% Asian52,461 93.8% Other race14,959 88.1% Two or more races9,612 87.2% White alone, not Hispanic / Latino67,361 92.7% Hispanic or LatinoMoved within same county 1,834 8.8% White / Caucasian428 9.6% Black or African American76 22.2% American Indian / Alaska Native40 2.0% Asian1,220 2.2% Other race1,410 8.3% Two or more races756 6.9% White alone, not Hispanic / Latino2,745 3.8% Hispanic or LatinoMoved within same state 519 2.5% White / Caucasian141 3.2% Black or African American74 3.7% Asian103 0.2% Other race129 0.8% Two or more races356 3.2% White alone, not Hispanic / Latino231 0.3% Hispanic or LatinoMoved from different state 278 1.3% White / Caucasian13 0.3% Black or African American5 0.2% Asian311 0.6% Other race203 1.2% Two or more races241 2.2% White alone, not Hispanic / Latino394 0.5% Hispanic or LatinoMoved from abroad 238 1.1% White14 0.3% Black or African American1,811 3.2% Other race63 0.4% Two or more races26 0.2% White alone, not Hispanic / Latino1,929 2.7% Hispanic or Latino
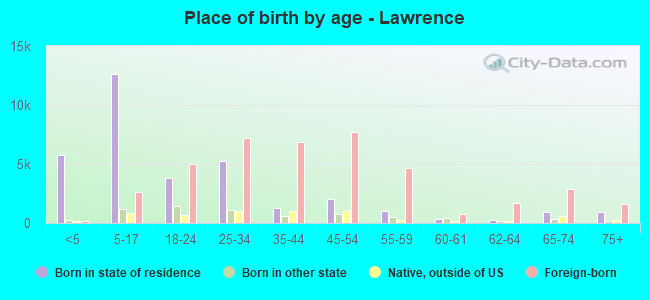
Children Nativity (place of birth) in Lawrence
Children under 6 years - Living with two parents Both parents foreign-born 1,146 93.3% Native82 6.7% Foreign-bornOne native, one foreign-born parent 315 100.0% NativeChildren under 6 years - Living with one parent Native parent 2,545 100.0% NativeForeign-born parent 2,675 100.0% NativeChildren 6 to 17 years - Living with two parents Both parents native 784 100.0% NativeBoth parents foreign-born 2,648 77.7% Native762 22.3% Foreign-bornOne native, one foreign-born parent 484 100.0% NativeChildren 6 to 17 years - Living with one parent Native parent 1,879 100.0% NativeForeign-born parent 7,043 56.6% Native5,400 43.4% Foreign-born
Grandparents responsible for own grandchildren in Lawrence
Grandparents (30 to 59 years) White / Caucasian 120 37.4% Responsible for grandchildren200 62.6% Not responsible for grandchildrenBlack or African American 32 24.2% Responsible for grandchildren102 75.8% Not responsible for grandchildrenAsian 10 100.0% Not responsible for grandchildrenOther race 493 29.5% Responsible for grandchildren1,176 70.5% Not responsible for grandchildrenTwo or more races 41 23.8% Responsible for grandchildren133 76.2% Not responsible for grandchildrenWhite alone, not Hispanic / Latino 85 100.0% Not responsible for grandchildrenHispanic or Latino 493 24.2% Responsible for grandchildren1,543 75.8% Not responsible for grandchildrenGrandparents (60 years and over) White / Caucasian 16 7.7% Responsible for grandchildren193 92.3% Not responsible for grandchildrenBlack or African American 61 71.6% Responsible for grandchildren24 28.4% Not responsible for grandchildrenAsian 32 100.0% Not responsible for grandchildrenOther race 560 47.7% Responsible for grandchildren615 52.3% Not responsible for grandchildrenTwo or more races 90 28.1% Responsible for grandchildren229 71.9% Not responsible for grandchildrenWhite alone, not Hispanic / Latino 9 5.5% Responsible for grandchildren159 94.5% Not responsible for grandchildrenHispanic or Latino 645 39.8% Responsible for grandchildren975 60.2% Not responsible for grandchildren