Races in Laughlin, Nevada (NV) Detailed Stats
Data:
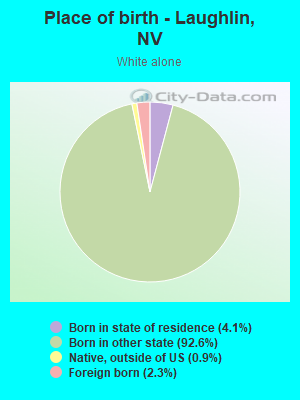
Races - White alone (%)
Races - White alone (% change since 2000)
Races - Black alone (%)
Races - Black alone (% change since 2000)
Races - American Indian alone (%)
Races - American Indian alone (% change since 2000)
Races - Asian alone (%)
Races - Asian alone (% change since 2000)
Races - Hispanic (%)
Races - Hispanic (% change since 2000)
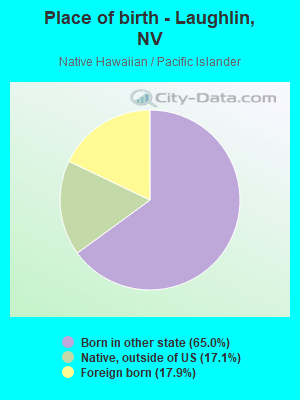
Races - Native Hawaiian and Other Pacific Islander alone (%)
Races - Native Hawaiian and Other Pacific Islander alone (% change since 2000)
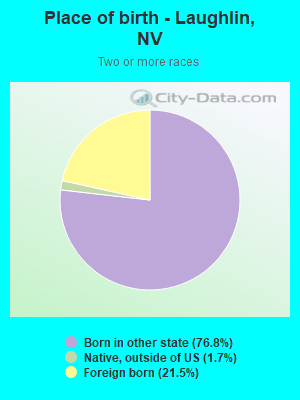
Races - Two or more races(%)
Races - Two or more races(% change since 2000)
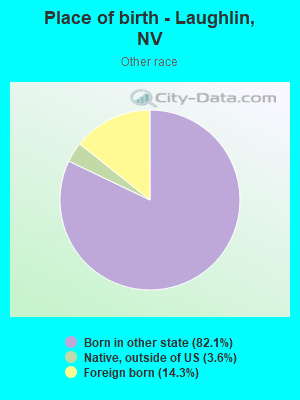
Races - Other race alone (%)
Races - Other race alone (% change since 2000)
Racial diversity
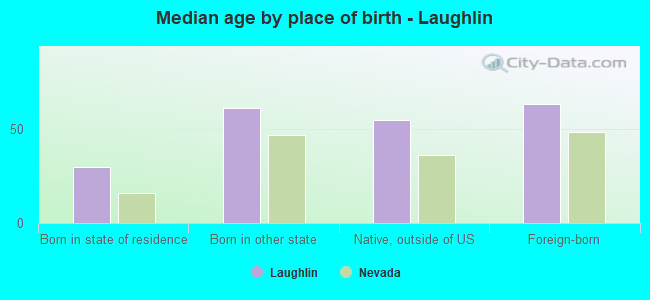
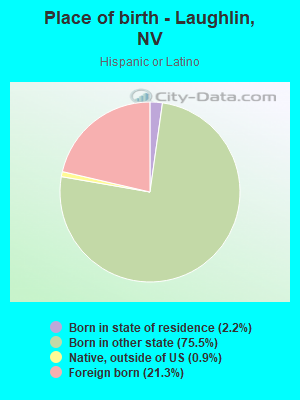
Place of birth - Born in state of residence (%)
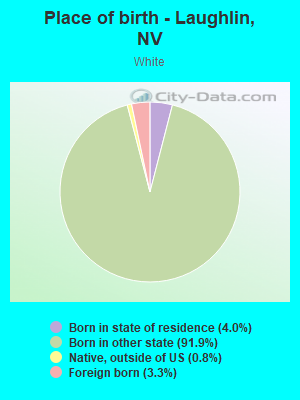
Place of birth - Born in state of residence (%) - White
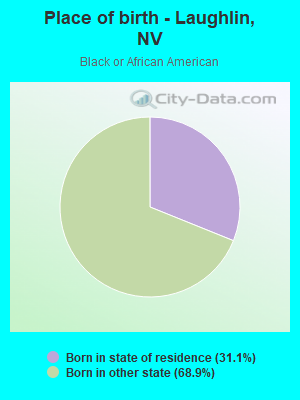
Place of birth - Born in state of residence (%) - Black or African American
Place of birth - Born in state of residence (%) - Asian
Place of birth - Born in state of residence (%) - Hispanic or Latino
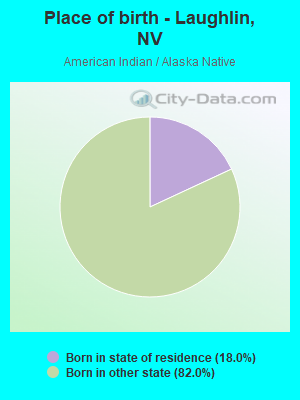
Place of birth - Born in state of residence (%) - American Indian and Alaska Native
Place of birth - Born in state of residence (%) - Multirace
Place of birth - Born in state of residence (%) - Other Race
Place of birth - Born in other state (%)
Place of birth - Born in other state (%) - White
Place of birth - Born in other state (%) - Black or African American
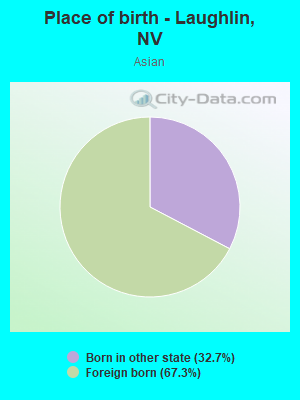
Place of birth - Born in other state (%) - Asian
Place of birth - Born in other state (%) - Hispanic or Latino
Place of birth - Born in other state (%) - American Indian and Alaska Native
Place of birth - Born in other state (%) - Multirace
Place of birth - Born in other state (%) - Other Race
Place of birth - Native, outside of US (%)
Place of birth - Native, outside of US (%) - White
Place of birth - Native, outside of US (%) - Black or African American
Place of birth - Native, outside of US (%) - Asian
Place of birth - Native, outside of US (%) - Hispanic or Latino
Place of birth - Native, outside of US (%) - American Indian and Alaska Native
Place of birth - Native, outside of US (%) - Multirace
Place of birth - Native, outside of US (%) - Other Race
Place of birth - Foreign born (%)
Place of birth - Foreign born (%) - White
Place of birth - Foreign born (%) - Black or African American
Place of birth - Foreign born (%) - Asian
Place of birth - Foreign born (%) - Hispanic or Latino
Place of birth - Foreign born (%) - American Indian and Alaska Native
Place of birth - Foreign born (%) - Multirace
Place of birth - Foreign born (%) - Other Race
Residents speaking English at home (%)
Residents speaking English at home - Born in the United States (%)
Residents speaking English at home - Native, born elsewhere (%)
Residents speaking English at home - Foreign born (%)
Residents speaking Spanish at home (%)
Residents speaking Spanish at home - Born in the United States (%)
Residents speaking Spanish at home - Native, born elsewhere (%)
Residents speaking Spanish at home - Foreign born (%)
Residents speaking other language at home (%)
Residents speaking other language at home - Born in the United States (%)
Residents speaking other language at home - Native, born elsewhere (%)
Residents speaking other language at home - Foreign born (%)
Marital status - Never married (%)
Marital status - Now married (%)
Marital status - Separated (%)
Marital status - Widowed (%)
Marital status - Divorced (%)
Ancestries Reported - Arab (%)
Ancestries Reported - Czech (%)
Ancestries Reported - Danish (%)
Ancestries Reported - Dutch (%)
Ancestries Reported - English (%)
Ancestries Reported - French (%)
Ancestries Reported - French Canadian (%)
Ancestries Reported - German (%)
Ancestries Reported - Greek (%)
Ancestries Reported - Hungarian (%)
Ancestries Reported - Irish (%)
Ancestries Reported - Italian (%)
Ancestries Reported - Lithuanian (%)
Ancestries Reported - Norwegian (%)
Ancestries Reported - Polish (%)
Ancestries Reported - Portuguese (%)
Ancestries Reported - Russian (%)
Ancestries Reported - Scotch-Irish (%)
Ancestries Reported - Scottish (%)
Ancestries Reported - Slovak (%)
Ancestries Reported - Subsaharan African (%)
Ancestries Reported - Swedish (%)
Ancestries Reported - Swiss (%)
Ancestries Reported - Ukrainian (%)
Ancestries Reported - United States (%)
Ancestries Reported - Welsh (%)
Ancestries Reported - West Indian (%)
Ancestries Reported - Other (%)
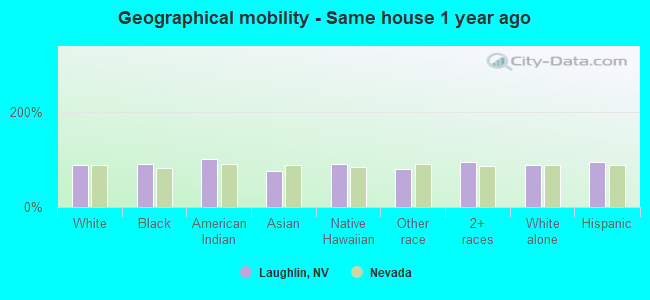
Geographical mobility - Same house 1 year ago (%)
Geographical mobility - Same house 1 year ago (%) - White
Geographical mobility - Same house 1 year ago (%) - Black or African American
Geographical mobility - Same house 1 year ago (%) - Asian
Geographical mobility - Same house 1 year ago (%) - Hispanic or Latino
Geographical mobility - Same house 1 year ago (%) - American Indian and Alaska Native
Geographical mobility - Same house 1 year ago (%) - Multirace
Geographical mobility - Same house 1 year ago (%) - Other Race
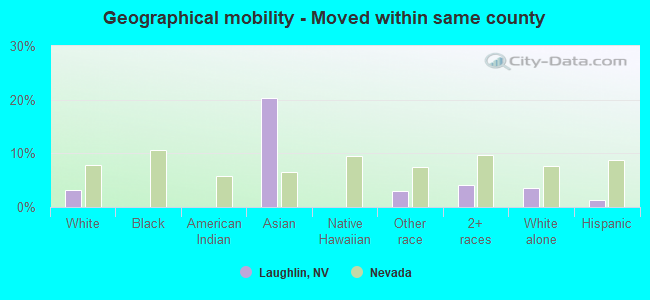
Geographical mobility - Moved within same county (%)
Geographical mobility - Moved within same county (%) - White
Geographical mobility - Moved within same county (%) - Black or African American
Geographical mobility - Moved within same county (%) - Asian
Geographical mobility - Moved within same county (%) - Hispanic or Latino
Geographical mobility - Moved within same county (%) - American Indian and Alaska Native
Geographical mobility - Moved within same county (%) - Multirace
Geographical mobility - Moved within same county (%) - Other Race
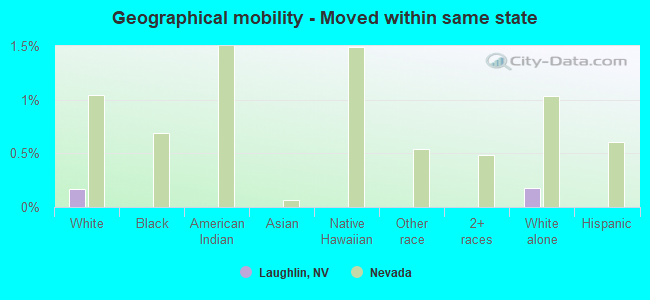
Geographical mobility - Moved from different county within same state (%)
Geographical mobility - Moved from different county within same state (%) - White
Geographical mobility - Moved from different county within same state (%) - Black or African American
Geographical mobility - Moved from different county within same state (%) - Asian
Geographical mobility - Moved from different county within same state (%) - Hispanic or Latino
Geographical mobility - Moved from different county within same state (%) - American Indian and Alaska Native
Geographical mobility - Moved from different county within same state (%) - Multirace
Geographical mobility - Moved from different county within same state (%) - Other Race
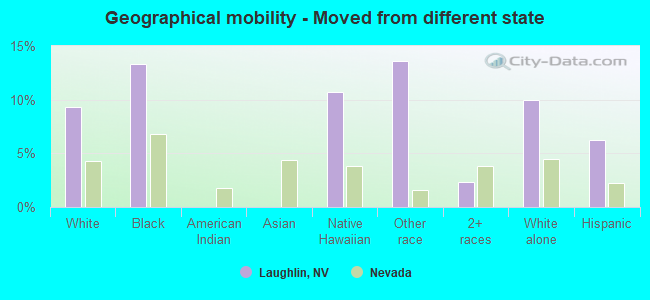
Geographical mobility - Moved from different state (%)
Geographical mobility - Moved from different state (%) - White
Geographical mobility - Moved from different state (%) - Black or African American
Geographical mobility - Moved from different state (%) - Asian
Geographical mobility - Moved from different state (%) - Hispanic or Latino
Geographical mobility - Moved from different state (%) - American Indian and Alaska Native
Geographical mobility - Moved from different state (%) - Multirace
Geographical mobility - Moved from different state (%) - Other Race
Geographical mobility - Moved from abroad (%)
Geographical mobility - Moved from abroad (%) - White
Geographical mobility - Moved from abroad (%) - Black or African American
Geographical mobility - Moved from abroad (%) - Asian
Geographical mobility - Moved from abroad (%) - Hispanic or Latino
Geographical mobility - Moved from abroad (%) - American Indian and Alaska Native
Geographical mobility - Moved from abroad (%) - Multirace
Geographical mobility - Moved from abroad (%) - Other Race
Place of birth for the foreign-born population - Ireland (%)
Place of birth for the foreign-born population - Denmark (%)
Place of birth for the foreign-born population - Norway (%)
Place of birth for the foreign-born population - Sweden (%)
Place of birth for the foreign-born population - United Kingdom (%)
Place of birth for the foreign-born population - England (%)
Place of birth for the foreign-born population - Scotland (%)
Place of birth for the foreign-born population - Other Northern Europe (%)
Place of birth for the foreign-born population - Austria (%)
Place of birth for the foreign-born population - Belgium (%)
Place of birth for the foreign-born population - France (%)
Place of birth for the foreign-born population - Germany (%)
Place of birth for the foreign-born population - Netherlands (%)
Place of birth for the foreign-born population - Switzerland (%)
Place of birth for the foreign-born population - Other Western Europe (%)
Place of birth for the foreign-born population - Greece (%)
Place of birth for the foreign-born population - Italy (%)
Place of birth for the foreign-born population - Portugal (%)
Place of birth for the foreign-born population - Spain (%)
Place of birth for the foreign-born population - Other Southern Europe (%)
Place of birth for the foreign-born population - Albania (%)
Place of birth for the foreign-born population - Belarus (%)
Place of birth for the foreign-born population - Bosnia and Herzegovina (%)
Place of birth for the foreign-born population - Bulgaria (%)
Place of birth for the foreign-born population - Croatia (%)
Place of birth for the foreign-born population - Czechoslovakia (%)
Place of birth for the foreign-born population - Hungary (%)
Place of birth for the foreign-born population - Latvia (%)
Place of birth for the foreign-born population - Lithuania (%)
Place of birth for the foreign-born population - North Macedonia (Macedonia) (%)
Place of birth for the foreign-born population - Moldova (%)
Place of birth for the foreign-born population - Poland (%)
Place of birth for the foreign-born population - Romania (%)
Place of birth for the foreign-born population - Russia (%)
Place of birth for the foreign-born population - Serbia (%)
Place of birth for the foreign-born population - Ukraine (%)
Place of birth for the foreign-born population - Other Eastern Europe (%)
Place of birth for the foreign-born population - China (%)
Place of birth for the foreign-born population - Hong Kong (%)
Place of birth for the foreign-born population - Taiwan (%)
Place of birth for the foreign-born population - Japan (%)
Place of birth for the foreign-born population - Korea (%)
Place of birth for the foreign-born population - Other Eastern Asia (%)
Place of birth for the foreign-born population - Afghanistan (%)
Place of birth for the foreign-born population - Bangladesh (%)
Place of birth for the foreign-born population - India (%)
Place of birth for the foreign-born population - Iran (%)
Place of birth for the foreign-born population - Kazakhstan (%)
Place of birth for the foreign-born population - Nepal (%)
Place of birth for the foreign-born population - Pakistan (%)
Place of birth for the foreign-born population - Sri Lanka (%)
Place of birth for the foreign-born population - Uzbekistan (%)
Place of birth for the foreign-born population - Other South Central Asia (%)
Place of birth for the foreign-born population - Burma (%)
Place of birth for the foreign-born population - Cambodia (%)
Place of birth for the foreign-born population - Indonesia (%)
Place of birth for the foreign-born population - Laos (%)
Place of birth for the foreign-born population - Malaysia (%)
Place of birth for the foreign-born population - Philippines (%)
Place of birth for the foreign-born population - Singapore (%)
Place of birth for the foreign-born population - Thailand (%)
Place of birth for the foreign-born population - Vietnam (%)
Place of birth for the foreign-born population - Other South Eastern Asia (%)
Place of birth for the foreign-born population - Armenia (%)
Place of birth for the foreign-born population - Iraq (%)
Place of birth for the foreign-born population - Israel (%)
Place of birth for the foreign-born population - Jordan (%)
Place of birth for the foreign-born population - Kuwait (%)
Place of birth for the foreign-born population - Lebanon (%)
Place of birth for the foreign-born population - Saudi Arabia (%)
Place of birth for the foreign-born population - Syria (%)
Place of birth for the foreign-born population - Turkey (%)
Place of birth for the foreign-born population - Yemen (%)
Place of birth for the foreign-born population - Other Western Asia (%)
Place of birth for the foreign-born population - Eritrea (%)
Place of birth for the foreign-born population - Ethiopia (%)
Place of birth for the foreign-born population - Kenya (%)
Place of birth for the foreign-born population - Somalia (%)
Place of birth for the foreign-born population - Uganda (%)
Place of birth for the foreign-born population - Zimbabwe (%)
Place of birth for the foreign-born population - Other Eastern Africa (%)
Place of birth for the foreign-born population - Cameroon (%)
Place of birth for the foreign-born population - Congo (%)
Place of birth for the foreign-born population - Democratic Republic of Congo (Zaire) (%)
Place of birth for the foreign-born population - Other Middle Africa (%)
Place of birth for the foreign-born population - Egypt (%)
Place of birth for the foreign-born population - Morocco (%)
Place of birth for the foreign-born population - Sudan (%)
Place of birth for the foreign-born population - Other Northern Africa (%)
Place of birth for the foreign-born population - South Africa (%)
Place of birth for the foreign-born population - Other Southern Africa (%)
Place of birth for the foreign-born population - Cabo Verde (%)
Place of birth for the foreign-born population - Ghana (%)
Place of birth for the foreign-born population - Liberia (%)
Place of birth for the foreign-born population - Nigeria (%)
Place of birth for the foreign-born population - Senegal (%)
Place of birth for the foreign-born population - Sierra Leone (%)
Place of birth for the foreign-born population - Other Western Africa (%)
Place of birth for the foreign-born population - Australia (%)
Place of birth for the foreign-born population - New Zealand (%)
Place of birth for the foreign-born population - Fiji (%)
Place of birth for the foreign-born population - Micronesia (%)
Place of birth for the foreign-born population - Bahamas (%)
Place of birth for the foreign-born population - Barbados (%)
Place of birth for the foreign-born population - Cuba (%)
Place of birth for the foreign-born population - Dominica (%)
Place of birth for the foreign-born population - Dominican Republic (%)
Place of birth for the foreign-born population - Grenada (%)
Place of birth for the foreign-born population - Haiti (%)
Place of birth for the foreign-born population - Jamaica (%)
Place of birth for the foreign-born population - St. Vincent and the Grenadines (%)
Place of birth for the foreign-born population - Trinidad and Tobago (%)
Place of birth for the foreign-born population - West Indies (%)
Place of birth for the foreign-born population - Other Caribbean (%)
Place of birth for the foreign-born population - Belize (%)
Place of birth for the foreign-born population - Costa Rica (%)
Place of birth for the foreign-born population - El Salvador (%)
Place of birth for the foreign-born population - Guatemala (%)
Place of birth for the foreign-born population - Honduras (%)
Place of birth for the foreign-born population - Mexico (%)
Place of birth for the foreign-born population - Nicaragua (%)
Place of birth for the foreign-born population - Panama (%)
Place of birth for the foreign-born population - Other Central America (%)
Place of birth for the foreign-born population - Argentina (%)
Place of birth for the foreign-born population - Bolivia (%)
Place of birth for the foreign-born population - Brazil (%)
Place of birth for the foreign-born population - Chile (%)
Place of birth for the foreign-born population - Colombia (%)
Place of birth for the foreign-born population - Ecuador (%)
Place of birth for the foreign-born population - Guyana (%)
Place of birth for the foreign-born population - Peru (%)
Place of birth for the foreign-born population - Uruguay (%)
Place of birth for the foreign-born population - Venezuela (%)
Place of birth for the foreign-born population - Other South America (%)
Place of birth for the foreign-born population - Canada (%)
Place of birth for the foreign-born population - Other Northern America (%)
Place of birth for the foreign-born population - Other (%)
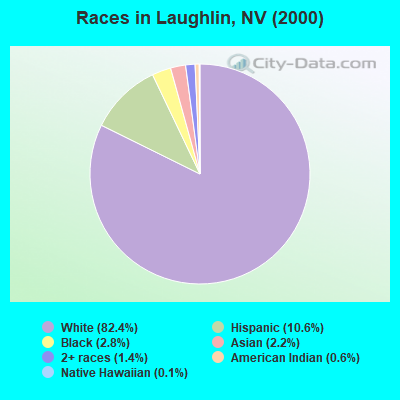
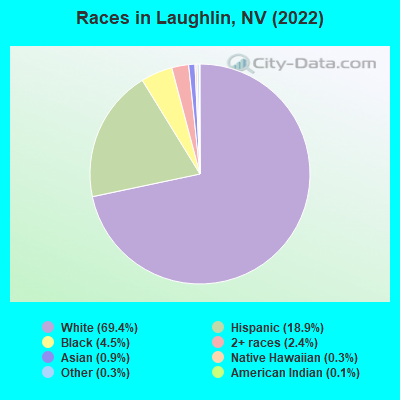
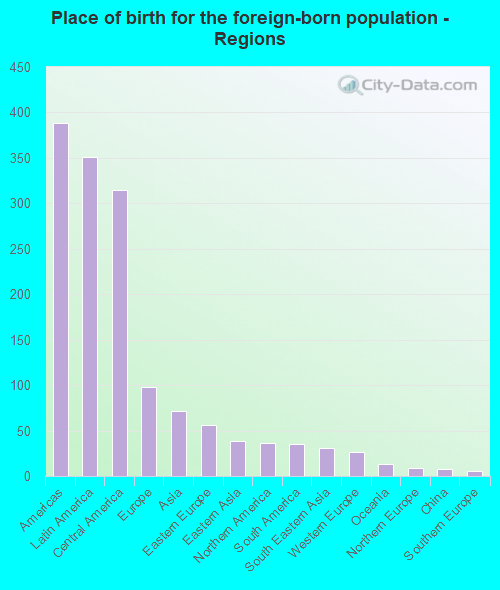
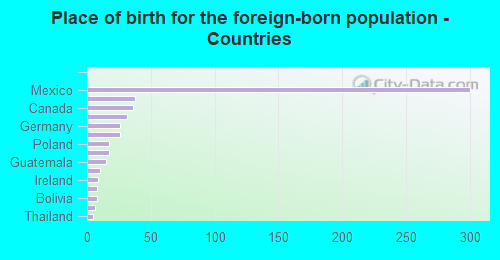
According to 2022 data, the most numerous races in Laughlin, NV are White alone (5,819 residents), Hispanic (1,588 residents), and Black alone (377 residents). 90.5% of Laughlin residents speak English at home. 6.8% of Laughlin, NV residents are foreign-born (4.2% born in Latin America, 1.2% born in Europe, 0.8% born in Asia), which is 164.5% less than the foreign-born rate of 18.0% across the entire state of Nevada.
Race distribution in Laughlin
2000 2022
1,303,001 65.2% White alone 393,970 19.7% Hispanic 131,509 6.6% Black alone 88,593 4.4% Asian alone 49,231 2.5% Two or more races 21,397 1.1% American Indian alone 7,769 0.4% Native Hawaiian and Other 2,787 0.1% Other race alone
1,410,145 44.4% White alone 961,357 30.3% Hispanic 286,471 9.0% Black alone 281,149 8.8% Asian alone 182,151 5.7% Two or more races 20,102 0.6% Native Hawaiian and Other 18,781 0.6% Other race alone 17,616 0.6% American Indian alone
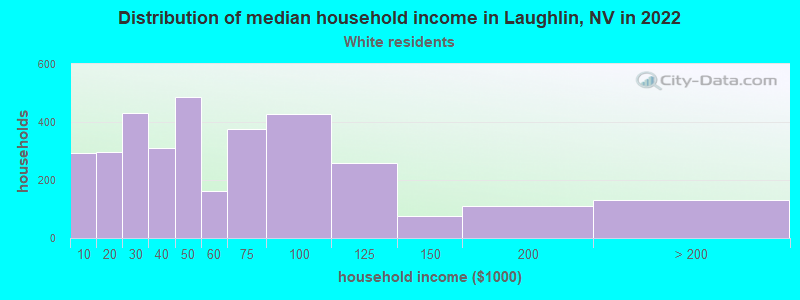
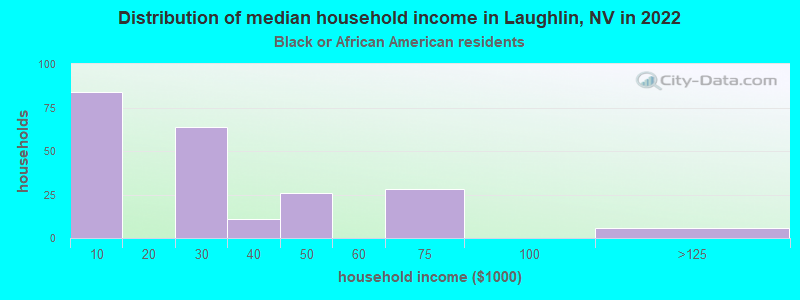
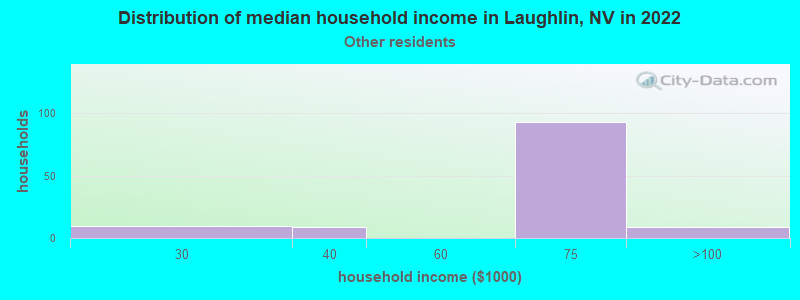
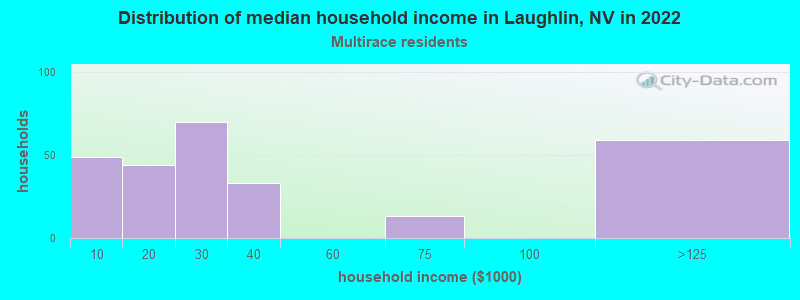
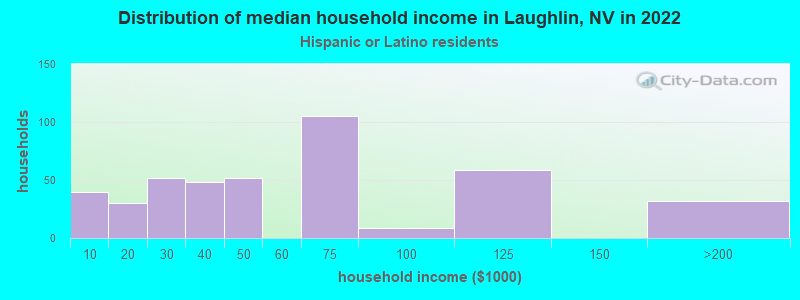
Income and house value in Laughlin Median household income in 2022 $45,496 White non-Hispanic householders$23,922 Black householders$67,356 Some other race householders$22,580 Two or more races householders$44,130 Hispanic or Latino race householdersMedian 2022 house value $312,060 White Non-Hispanic householders$305,832 Black or African American householders $361,438 Asian householders$444,847 Some other race householders$305,832 Two or more races householders$274,471 Hispanic or Latino householders
Median age by race in Laughlin
65.7 Median age for White residents64.7 66.7 40.8 Median age for Black or African American residents41.2 30.4 68.2 Median age for American Indian / Alaska Native residents-662,824,206.8 -660,886,319.2 56.5 Median age for Asian residents-651,996,739.4 56.4 13.5 Median age for Native Hawaiian / Pacific Islander residents-681,295,715.1 58.7 58.3 Median age for Other race residents48.4 62.4 37.6 Median age for Two or more races residents38.9 43.1 64.5 Median age for White alone residents63.8 65.3 45.5 Median age for Hispanic or Latino residents37.0 52.9
Owner/renter occupied households by race in Laughlin
House owners and renters - White residents 1,843 54.7% Owner occupied1,526 45.3% Renter occupiedHouse owners and renters - Black or African American residents 45 21.0% Owner occupied171 79.0% Renter occupiedHouse owners and renters - American Indian / Alaska Native residents 9 62.6% Owner occupied5 37.4% Renter occupiedHouse owners and renters - Native Hawaiian / Pacific Islander residents 12 100.0% Renter occupiedHouse owners and renters - Other race residents 91 79.5% Owner occupied24 20.5% Renter occupiedHouse owners and renters - Two or more races residents 56 20.5% Owner occupied219 79.5% Renter occupiedHouse owners and renters - White alone residents 1,857 54.7% Owner occupied1,538 45.3% Renter occupiedHouse owners and renters - Hispanic or Latino residents 183 41.1% Owner occupied263 58.9% Renter occupied
Language usage in Laughlin
English speakers - Total 90.5% of residents of Laughlin speak English at home.
6.2% of residents speak Spanish at home 405 79.7% Speak English very well103 20.3% Speak English less than very well2.7% of residents speak other language at home 175 79.2% Speak English very well46 20.8% Speak English less than very well
English speakers - Born in the United States 94.9% of residents of Laughlin speak English at home.
3.9% of residents speak Spanish at home 274 100.0% Speak English very well1.1% of residents speak other language at home 64 83.1% Speak English very well13 16.9% Speak English less than very well
English speakers - Native, born elsewhere 83.7% of residents of Laughlin speak English at home.
12.0% of residents speak other language at home 11 100.0% Speak English less than very well
English speakers - Foreign-born 37.8% of residents of Laughlin speak English at home.
36.8% of residents speak Spanish at home 108 51.4% Speak English very well102 48.6% Speak English less than very well23.5% of residents speak other language at home 109 81.3% Speak English very well25 18.7% Speak English less than very well
White (Caucasian) - Speak only English Native:
99.8% (5,664)Foreign-born:
60.9% (121)
White (Caucasian) - Speak another language Native:
2.5% (141)Foreign-born:
49.2% (98)
Asian - Speak only English Native:
53.9% (14)Foreign-born:
21.0% (11)
Asian - Speak another language Native:
44.3% (11)Foreign-born:
79.2% (41)
Native Hawaiian / Pacific Islander - Speak only English Native:
93.6% (71)Foreign-born:
100.0% (16)
Other race - Speak only English Native:
83.5% (312)Foreign-born:
65.8% (41)
Two or more races - Speak another language Native:
26.8% (167)Foreign-born:
100.0% (185)
White alone - Speak only English Native:
97.6% (5,488)Foreign-born:
48.7% (66)
White alone - Speak another language Native:
2.3% (129)Foreign-born:
50.9% (69)
Hispanic or Latino - Speak only English Native:
79.8% (952)Foreign-born:
30.2% (103)
Hispanic or Latino - Speak another language Native:
20.8% (248)Foreign-born:
61.3% (209)
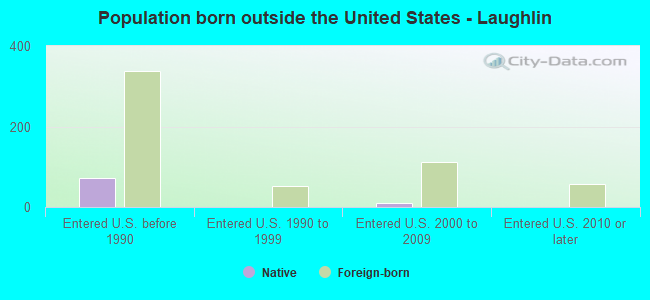
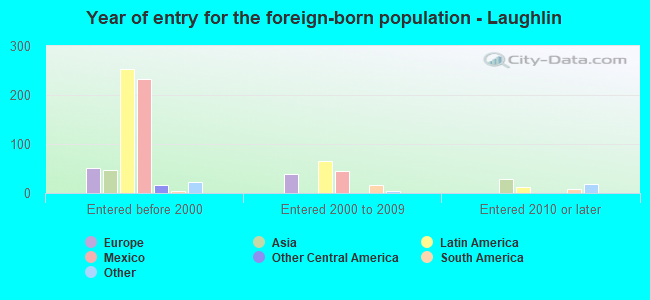
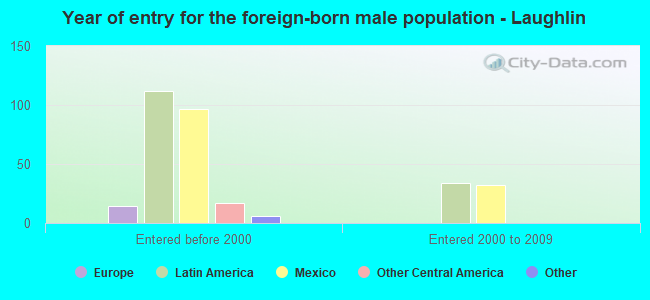
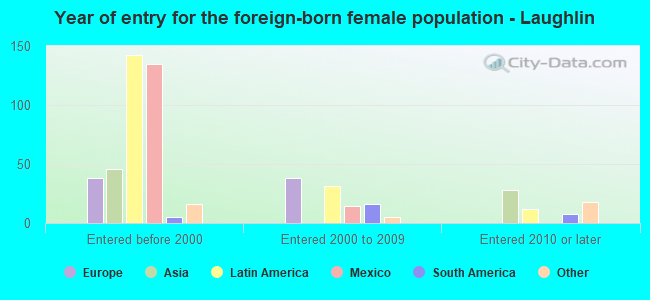
Foreign-born residents in Laughlin 571 residents are foreign born (4.2% Latin America , 1.2% Europe , 0.8% Asia ).
This city:
6.8%Nevada:
19.1%
Marital status for residents in Laughlin Marital status - White (Caucasian) population 15 years and over
Males 22.6% Never married41.0% Now married1.4% Separated7.0% Widowed27.9% DivorcedFemales 15.5% Never married45.8% Now married5.2% Separated15.9% Widowed17.6% DivorcedWomen who gave birth in the past 12 months Now married:
0.0% (0)Unmarried:
100.0% (48)
Women who did not give birth in the past 12 months Now married:
50.1% (286)Unmarried:
49.9% (284)
Marital status - Black or African American population 15 years and over
Males 54.0% Never married39.1% Now married0.0% Separated0.0% Widowed6.9% DivorcedFemales 70.1% Never married21.0% Now married0.0% Separated8.9% Widowed0.0% DivorcedWomen who did not give birth in the past 12 months Now married:
0.0% (0)Unmarried:
100.0% (123)
Marital status - American Indian / Alaska Native population 15 years and over
Males 0.0% Never married100.0% Now married0.0% Separated0.0% Widowed0.0% DivorcedFemales 0.0% Never married0.0% Now married0.0% Separated0.0% Widowed100.0% DivorcedMarital status - Asian population 15 years and over
Males 100.0% Never married0.0% Now married0.0% Separated0.0% Widowed0.0% DivorcedFemales 16.3% Never married83.7% Now married0.0% Separated0.0% Widowed0.0% DivorcedWomen who did not give birth in the past 12 months Now married:
100.0% (19)Unmarried:
0.0% (0)
Marital status - Other race population 15 years and over
Males 15.0% Never married39.9% Now married0.0% Separated0.0% Widowed45.1% DivorcedFemales 37.7% Never married17.0% Now married0.0% Separated26.0% Widowed19.3% DivorcedWomen who did not give birth in the past 12 months Now married:
0.0% (0)Unmarried:
100.0% (57)
Marital status - Two or more races population 15 years and over
Males 77.8% Never married2.3% Now married0.0% Separated15.0% Widowed4.9% DivorcedFemales 36.9% Never married28.6% Now married0.0% Separated22.0% Widowed12.5% DivorcedWomen who did not give birth in the past 12 months Now married:
25.2% (36)Unmarried:
74.8% (106)
Marital status - White alone, not Hispanic / Latino population 15 years and over
Males 19.3% Never married42.1% Now married1.6% Separated7.9% Widowed29.0% DivorcedFemales 16.2% Never married45.3% Now married5.2% Separated16.0% Widowed17.3% DivorcedWomen who gave birth in the past 12 months Now married:
0.0% (0)Unmarried:
100.0% (54)
Women who did not give birth in the past 12 months Now married:
50.4% (271)Unmarried:
49.6% (267)
Marital status - Hispanic or Latino population 15 years and over
Males 48.7% Never married26.0% Now married0.0% Separated5.8% Widowed19.5% DivorcedFemales 26.9% Never married31.8% Now married2.2% Separated22.9% Widowed16.2% DivorcedWomen who did not give birth in the past 12 months Now married:
30.8% (72)Unmarried:
69.2% (163)
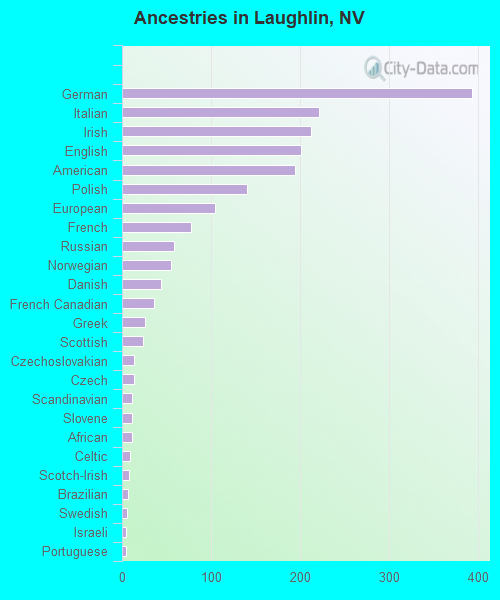
Ancestries in Laughlin
393 10.8% German221 6.1% Italian213 5.8% Irish201 5.5% English194 5.3% American141 3.9% Polish105 2.9% European78 2.1% French59 1.6% Russian55 1.5% Norwegian44 1.2% Danish36 1.0% French Canadian26 0.7% Greek24 0.7% Scottish14 0.4% Czechoslovakian13 0.4% Czech11 0.3% Scandinavian11 0.3% Slovene11 0.3% African9 0.2% Celtic8 0.2% Scotch-Irish7 0.2% Brazilian6 0.2% Swedish5 0.1% Israeli4 0.1% Portuguese
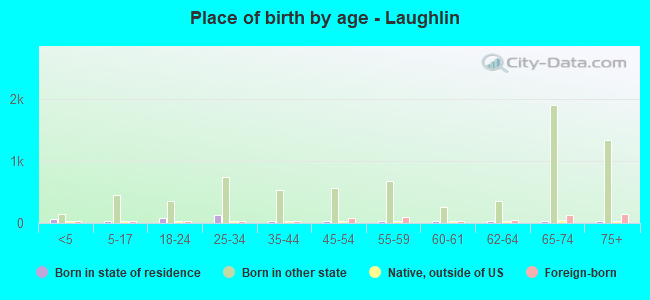
Children Nativity (place of birth) in Laughlin
Children under 6 years - Living with two parents Both parents native 96 100.0% NativeChildren under 6 years - Living with one parent Native parent 207 100.0% Native
Children 6 to 17 years - Living with two parents Both parents native 103 100.0% NativeOne native, one foreign-born parent 24 100.0% NativeChildren 6 to 17 years - Living with one parent Native parent 213 100.0% Native
Grandparents responsible for own grandchildren in Laughlin
Grandparents (30 to 59 years) White / Caucasian 55 100.0% Not responsible for grandchildrenWhite alone, not Hispanic / Latino 10 100.0% Not responsible for grandchildrenHispanic or Latino 68 100.0% Not responsible for grandchildren
Grandparents (60 years and over) White / Caucasian 20 100.0% Responsible for grandchildrenWhite alone, not Hispanic / Latino 25 100.0% Responsible for grandchildrenHispanic or Latino 30 100.0% Not responsible for grandchildren