Races in Landover Hills, Maryland (MD) Detailed Stats
Data:
Races - White alone (%)
Races - White alone (% change since 2000)
Races - Black alone (%)
Races - Black alone (% change since 2000)
Races - American Indian alone (%)
Races - American Indian alone (% change since 2000)
Races - Asian alone (%)
Races - Asian alone (% change since 2000)
Races - Hispanic (%)
Races - Hispanic (% change since 2000)
Races - Native Hawaiian and Other Pacific Islander alone (%)
Races - Native Hawaiian and Other Pacific Islander alone (% change since 2000)
Races - Two or more races(%)
Races - Two or more races(% change since 2000)
Races - Other race alone (%)
Races - Other race alone (% change since 2000)
Racial diversity
Place of birth - Born in state of residence (%)
Place of birth - Born in state of residence (%) - White
Place of birth - Born in state of residence (%) - Black or African American
Place of birth - Born in state of residence (%) - Asian
Place of birth - Born in state of residence (%) - Hispanic or Latino
Place of birth - Born in state of residence (%) - American Indian and Alaska Native
Place of birth - Born in state of residence (%) - Multirace
Place of birth - Born in state of residence (%) - Other Race
Place of birth - Born in other state (%)
Place of birth - Born in other state (%) - White
Place of birth - Born in other state (%) - Black or African American
Place of birth - Born in other state (%) - Asian
Place of birth - Born in other state (%) - Hispanic or Latino
Place of birth - Born in other state (%) - American Indian and Alaska Native
Place of birth - Born in other state (%) - Multirace
Place of birth - Born in other state (%) - Other Race
Place of birth - Native, outside of US (%)
Place of birth - Native, outside of US (%) - White
Place of birth - Native, outside of US (%) - Black or African American
Place of birth - Native, outside of US (%) - Asian
Place of birth - Native, outside of US (%) - Hispanic or Latino
Place of birth - Native, outside of US (%) - American Indian and Alaska Native
Place of birth - Native, outside of US (%) - Multirace
Place of birth - Native, outside of US (%) - Other Race
Place of birth - Foreign born (%)
Place of birth - Foreign born (%) - White
Place of birth - Foreign born (%) - Black or African American
Place of birth - Foreign born (%) - Asian
Place of birth - Foreign born (%) - Hispanic or Latino
Place of birth - Foreign born (%) - American Indian and Alaska Native
Place of birth - Foreign born (%) - Multirace
Place of birth - Foreign born (%) - Other Race
Residents speaking English at home (%)
Residents speaking English at home - Born in the United States (%)
Residents speaking English at home - Native, born elsewhere (%)
Residents speaking English at home - Foreign born (%)
Residents speaking Spanish at home (%)
Residents speaking Spanish at home - Born in the United States (%)
Residents speaking Spanish at home - Native, born elsewhere (%)
Residents speaking Spanish at home - Foreign born (%)
Residents speaking other language at home (%)
Residents speaking other language at home - Born in the United States (%)
Residents speaking other language at home - Native, born elsewhere (%)
Residents speaking other language at home - Foreign born (%)
Marital status - Never married (%)
Marital status - Now married (%)
Marital status - Separated (%)
Marital status - Widowed (%)
Marital status - Divorced (%)
Ancestries Reported - Arab (%)
Ancestries Reported - Czech (%)
Ancestries Reported - Danish (%)
Ancestries Reported - Dutch (%)
Ancestries Reported - English (%)
Ancestries Reported - French (%)
Ancestries Reported - French Canadian (%)
Ancestries Reported - German (%)
Ancestries Reported - Greek (%)
Ancestries Reported - Hungarian (%)
Ancestries Reported - Irish (%)
Ancestries Reported - Italian (%)
Ancestries Reported - Lithuanian (%)
Ancestries Reported - Norwegian (%)
Ancestries Reported - Polish (%)
Ancestries Reported - Portuguese (%)
Ancestries Reported - Russian (%)
Ancestries Reported - Scotch-Irish (%)
Ancestries Reported - Scottish (%)
Ancestries Reported - Slovak (%)
Ancestries Reported - Subsaharan African (%)
Ancestries Reported - Swedish (%)
Ancestries Reported - Swiss (%)
Ancestries Reported - Ukrainian (%)
Ancestries Reported - United States (%)
Ancestries Reported - Welsh (%)
Ancestries Reported - West Indian (%)
Ancestries Reported - Other (%)
Geographical mobility - Same house 1 year ago (%)
Geographical mobility - Same house 1 year ago (%) - White
Geographical mobility - Same house 1 year ago (%) - Black or African American
Geographical mobility - Same house 1 year ago (%) - Asian
Geographical mobility - Same house 1 year ago (%) - Hispanic or Latino
Geographical mobility - Same house 1 year ago (%) - American Indian and Alaska Native
Geographical mobility - Same house 1 year ago (%) - Multirace
Geographical mobility - Same house 1 year ago (%) - Other Race
Geographical mobility - Moved within same county (%)
Geographical mobility - Moved within same county (%) - White
Geographical mobility - Moved within same county (%) - Black or African American
Geographical mobility - Moved within same county (%) - Asian
Geographical mobility - Moved within same county (%) - Hispanic or Latino
Geographical mobility - Moved within same county (%) - American Indian and Alaska Native
Geographical mobility - Moved within same county (%) - Multirace
Geographical mobility - Moved within same county (%) - Other Race
Geographical mobility - Moved from different county within same state (%)
Geographical mobility - Moved from different county within same state (%) - White
Geographical mobility - Moved from different county within same state (%) - Black or African American
Geographical mobility - Moved from different county within same state (%) - Asian
Geographical mobility - Moved from different county within same state (%) - Hispanic or Latino
Geographical mobility - Moved from different county within same state (%) - American Indian and Alaska Native
Geographical mobility - Moved from different county within same state (%) - Multirace
Geographical mobility - Moved from different county within same state (%) - Other Race
Geographical mobility - Moved from different state (%)
Geographical mobility - Moved from different state (%) - White
Geographical mobility - Moved from different state (%) - Black or African American
Geographical mobility - Moved from different state (%) - Asian
Geographical mobility - Moved from different state (%) - Hispanic or Latino
Geographical mobility - Moved from different state (%) - American Indian and Alaska Native
Geographical mobility - Moved from different state (%) - Multirace
Geographical mobility - Moved from different state (%) - Other Race
Geographical mobility - Moved from abroad (%)
Geographical mobility - Moved from abroad (%) - White
Geographical mobility - Moved from abroad (%) - Black or African American
Geographical mobility - Moved from abroad (%) - Asian
Geographical mobility - Moved from abroad (%) - Hispanic or Latino
Geographical mobility - Moved from abroad (%) - American Indian and Alaska Native
Geographical mobility - Moved from abroad (%) - Multirace
Geographical mobility - Moved from abroad (%) - Other Race
Place of birth for the foreign-born population - Ireland (%)
Place of birth for the foreign-born population - Denmark (%)
Place of birth for the foreign-born population - Norway (%)
Place of birth for the foreign-born population - Sweden (%)
Place of birth for the foreign-born population - United Kingdom (%)
Place of birth for the foreign-born population - England (%)
Place of birth for the foreign-born population - Scotland (%)
Place of birth for the foreign-born population - Other Northern Europe (%)
Place of birth for the foreign-born population - Austria (%)
Place of birth for the foreign-born population - Belgium (%)
Place of birth for the foreign-born population - France (%)
Place of birth for the foreign-born population - Germany (%)
Place of birth for the foreign-born population - Netherlands (%)
Place of birth for the foreign-born population - Switzerland (%)
Place of birth for the foreign-born population - Other Western Europe (%)
Place of birth for the foreign-born population - Greece (%)
Place of birth for the foreign-born population - Italy (%)
Place of birth for the foreign-born population - Portugal (%)
Place of birth for the foreign-born population - Spain (%)
Place of birth for the foreign-born population - Other Southern Europe (%)
Place of birth for the foreign-born population - Albania (%)
Place of birth for the foreign-born population - Belarus (%)
Place of birth for the foreign-born population - Bosnia and Herzegovina (%)
Place of birth for the foreign-born population - Bulgaria (%)
Place of birth for the foreign-born population - Croatia (%)
Place of birth for the foreign-born population - Czechoslovakia (%)
Place of birth for the foreign-born population - Hungary (%)
Place of birth for the foreign-born population - Latvia (%)
Place of birth for the foreign-born population - Lithuania (%)
Place of birth for the foreign-born population - North Macedonia (Macedonia) (%)
Place of birth for the foreign-born population - Moldova (%)
Place of birth for the foreign-born population - Poland (%)
Place of birth for the foreign-born population - Romania (%)
Place of birth for the foreign-born population - Russia (%)
Place of birth for the foreign-born population - Serbia (%)
Place of birth for the foreign-born population - Ukraine (%)
Place of birth for the foreign-born population - Other Eastern Europe (%)
Place of birth for the foreign-born population - China (%)
Place of birth for the foreign-born population - Hong Kong (%)
Place of birth for the foreign-born population - Taiwan (%)
Place of birth for the foreign-born population - Japan (%)
Place of birth for the foreign-born population - Korea (%)
Place of birth for the foreign-born population - Other Eastern Asia (%)
Place of birth for the foreign-born population - Afghanistan (%)
Place of birth for the foreign-born population - Bangladesh (%)
Place of birth for the foreign-born population - India (%)
Place of birth for the foreign-born population - Iran (%)
Place of birth for the foreign-born population - Kazakhstan (%)
Place of birth for the foreign-born population - Nepal (%)
Place of birth for the foreign-born population - Pakistan (%)
Place of birth for the foreign-born population - Sri Lanka (%)
Place of birth for the foreign-born population - Uzbekistan (%)
Place of birth for the foreign-born population - Other South Central Asia (%)
Place of birth for the foreign-born population - Burma (%)
Place of birth for the foreign-born population - Cambodia (%)
Place of birth for the foreign-born population - Indonesia (%)
Place of birth for the foreign-born population - Laos (%)
Place of birth for the foreign-born population - Malaysia (%)
Place of birth for the foreign-born population - Philippines (%)
Place of birth for the foreign-born population - Singapore (%)
Place of birth for the foreign-born population - Thailand (%)
Place of birth for the foreign-born population - Vietnam (%)
Place of birth for the foreign-born population - Other South Eastern Asia (%)
Place of birth for the foreign-born population - Armenia (%)
Place of birth for the foreign-born population - Iraq (%)
Place of birth for the foreign-born population - Israel (%)
Place of birth for the foreign-born population - Jordan (%)
Place of birth for the foreign-born population - Kuwait (%)
Place of birth for the foreign-born population - Lebanon (%)
Place of birth for the foreign-born population - Saudi Arabia (%)
Place of birth for the foreign-born population - Syria (%)
Place of birth for the foreign-born population - Turkey (%)
Place of birth for the foreign-born population - Yemen (%)
Place of birth for the foreign-born population - Other Western Asia (%)
Place of birth for the foreign-born population - Eritrea (%)
Place of birth for the foreign-born population - Ethiopia (%)
Place of birth for the foreign-born population - Kenya (%)
Place of birth for the foreign-born population - Somalia (%)
Place of birth for the foreign-born population - Uganda (%)
Place of birth for the foreign-born population - Zimbabwe (%)
Place of birth for the foreign-born population - Other Eastern Africa (%)
Place of birth for the foreign-born population - Cameroon (%)
Place of birth for the foreign-born population - Congo (%)
Place of birth for the foreign-born population - Democratic Republic of Congo (Zaire) (%)
Place of birth for the foreign-born population - Other Middle Africa (%)
Place of birth for the foreign-born population - Egypt (%)
Place of birth for the foreign-born population - Morocco (%)
Place of birth for the foreign-born population - Sudan (%)
Place of birth for the foreign-born population - Other Northern Africa (%)
Place of birth for the foreign-born population - South Africa (%)
Place of birth for the foreign-born population - Other Southern Africa (%)
Place of birth for the foreign-born population - Cabo Verde (%)
Place of birth for the foreign-born population - Ghana (%)
Place of birth for the foreign-born population - Liberia (%)
Place of birth for the foreign-born population - Nigeria (%)
Place of birth for the foreign-born population - Senegal (%)
Place of birth for the foreign-born population - Sierra Leone (%)
Place of birth for the foreign-born population - Other Western Africa (%)
Place of birth for the foreign-born population - Australia (%)
Place of birth for the foreign-born population - New Zealand (%)
Place of birth for the foreign-born population - Fiji (%)
Place of birth for the foreign-born population - Micronesia (%)
Place of birth for the foreign-born population - Bahamas (%)
Place of birth for the foreign-born population - Barbados (%)
Place of birth for the foreign-born population - Cuba (%)
Place of birth for the foreign-born population - Dominica (%)
Place of birth for the foreign-born population - Dominican Republic (%)
Place of birth for the foreign-born population - Grenada (%)
Place of birth for the foreign-born population - Haiti (%)
Place of birth for the foreign-born population - Jamaica (%)
Place of birth for the foreign-born population - St. Vincent and the Grenadines (%)
Place of birth for the foreign-born population - Trinidad and Tobago (%)
Place of birth for the foreign-born population - West Indies (%)
Place of birth for the foreign-born population - Other Caribbean (%)
Place of birth for the foreign-born population - Belize (%)
Place of birth for the foreign-born population - Costa Rica (%)
Place of birth for the foreign-born population - El Salvador (%)
Place of birth for the foreign-born population - Guatemala (%)
Place of birth for the foreign-born population - Honduras (%)
Place of birth for the foreign-born population - Mexico (%)
Place of birth for the foreign-born population - Nicaragua (%)
Place of birth for the foreign-born population - Panama (%)
Place of birth for the foreign-born population - Other Central America (%)
Place of birth for the foreign-born population - Argentina (%)
Place of birth for the foreign-born population - Bolivia (%)
Place of birth for the foreign-born population - Brazil (%)
Place of birth for the foreign-born population - Chile (%)
Place of birth for the foreign-born population - Colombia (%)
Place of birth for the foreign-born population - Ecuador (%)
Place of birth for the foreign-born population - Guyana (%)
Place of birth for the foreign-born population - Peru (%)
Place of birth for the foreign-born population - Uruguay (%)
Place of birth for the foreign-born population - Venezuela (%)
Place of birth for the foreign-born population - Other South America (%)
Place of birth for the foreign-born population - Canada (%)
Place of birth for the foreign-born population - Other Northern America (%)
Place of birth for the foreign-born population - Other (%)
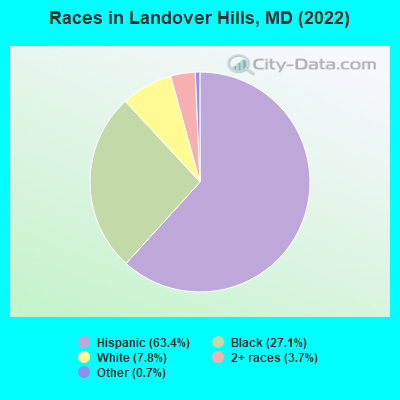
According to 2022 data, the most numerous races in Landover Hills, MD are White alone (163 residents), Black alone (567 residents), and Hispanic (1,329 residents). 46.5% of Landover Hills residents speak English at home. 32.2% of Landover Hills, MD residents are foreign-born (27.2% born in Latin America), which is 50.3% greater than the foreign-born rate of 16.0% across the entire state of Maryland.
Race distribution in Landover Hills
2000 2022
3,286,547 62.1% White alone 1,464,735 27.7% Black alone 227,916 4.3% Hispanic 209,738 4.0% Asian alone 82,946 1.6% Two or more races 13,312 0.3% American Indian alone 9,379 0.2% Other race alone 1,913 0.04% Native Hawaiian and Other
2,906,492 47.1% White alone 1,800,914 29.2% Black alone 705,842 11.4% Hispanic 401,818 6.5% Asian alone 291,317 4.7% Two or more races 46,930 0.8% Other race alone 8,930 0.1% American Indian alone 2,417 0.04% Native Hawaiian and Other
Income and house value in Landover Hills Median household income in 2022 $80,921 White non-Hispanic householders$110,423 Black householders$57,055 Some other race householders$99,412 Two or more races householders$84,199 Hispanic or Latino race householdersMedian 2022 house value $334,214 White Non-Hispanic householders$343,658 Black or African American householders$342,744 American Indian or Alaska Native householders $348,228 Asian householders$340,307 Some other race householders$342,744 Two or more races householders$319,895 Hispanic or Latino householders
Median age by race in Landover Hills
44.5 Median age for White residents46.0 43.5 51.4 Median age for Black or African American residents39.7 54.1 -780,410,741.7 Median age for American Indian / Alaska Native residents-888,297,871.5 -689,905,591.2 -707,379,134.2 Median age for Asian residents-668,430,334.4 -716,586,150.7 -571,600,480.8 Median age for Native Hawaiian / Pacific Islander residents-720,061,021.4 -760,942,760.2 27.9 Median age for Other race residents26.4 29.7 30.2 Median age for Two or more races residents31.2 30.0 58.2 Median age for White alone residents57.5 57.8 26.8 Median age for Hispanic or Latino residents23.6 29.1
Owner/renter occupied households by race in Landover Hills
House owners and renters - White residents 106 87.4% Owner occupied15 12.6% Renter occupiedHouse owners and renters - Black or African American residents 205 95.9% Owner occupied9 4.1% Renter occupiedHouse owners and renters - Asian residents 4 100.0% Owner occupiedHouse owners and renters - Other race residents 160 82.6% Owner occupied34 17.4% Renter occupiedHouse owners and renters - Two or more races residents 78 100.0% Owner occupiedHouse owners and renters - White alone residents 72 82.2% Owner occupied16 17.8% Renter occupiedHouse owners and renters - Hispanic or Latino residents 234 87.7% Owner occupied33 12.3% Renter occupied
Language usage in Landover Hills
English speakers - Total 46.5% of residents of Landover Hills speak English at home.
51.3% of residents speak Spanish at home 520 51.7% Speak English very well486 48.3% Speak English less than very well2.3% of residents speak other language at home 32 71.1% Speak English very well13 28.9% Speak English less than very well
English speakers - Born in the United States 64.5% of residents of Landover Hills speak English at home.
36.6% of residents speak Spanish at home 190 83.7% Speak English very well37 16.3% Speak English less than very well
All residents speak only English at home
English speakers - Foreign-born 18.0% of residents of Landover Hills speak English at home.
72.6% of residents speak Spanish at home 84 16.9% Speak English very well412 83.1% Speak English less than very well6.6% of residents speak other language at home 32 71.1% Speak English very well13 28.9% Speak English less than very well
White (Caucasian) - Speak another language Native:
36.9% (103)Foreign-born:
90.7% (33)
Black or African American - Speak only English Native:
91.9% (475)Foreign-born:
59.6% (65)
Black or African American - Speak another language Native:
8.7% (45)Foreign-born:
37.5% (41)
Other race - Speak only English Native:
32.9% (120)Foreign-born:
5.5% (26)
Other race - Speak another language Native:
69.5% (253)Foreign-born:
94.0% (451)
Two or more races - Speak only English Native:
32.7% (59)Foreign-born:
84.5% (33)
White alone - Speak another language Native:
7.2% (11)Foreign-born:
98.2% (3)
Hispanic or Latino - Speak only English Native:
23.8% (157)Foreign-born:
4.8% (25)
Hispanic or Latino - Speak another language Native:
76.3% (504)Foreign-born:
95.0% (504)
Foreign-born residents in Landover Hills 675 residents are foreign born (27.2% Latin America ).
This city:
32.2%Maryland:
15.7%
Marital status for residents in Landover Hills Marital status - White (Caucasian) population 15 years and over
Males 21.6% Never married46.2% Now married1.2% Separated8.8% Widowed22.2% DivorcedFemales 15.1% Never married52.1% Now married0.0% Separated6.8% Widowed26.0% DivorcedWomen who did not give birth in the past 12 months Now married:
49.4% (37)Unmarried:
50.6% (38)
Marital status - Black or African American population 15 years and over
Males 34.3% Never married55.2% Now married0.0% Separated0.0% Widowed10.5% DivorcedFemales 33.8% Never married46.3% Now married1.9% Separated0.6% Widowed17.4% DivorcedWomen who gave birth in the past 12 months Now married:
0.0% (0)Unmarried:
100.0% (9)
Women who did not give birth in the past 12 months Now married:
45.3% (55)Unmarried:
54.7% (66)
Marital status - Other race population 15 years and over
Males 55.4% Never married40.8% Now married1.0% Separated1.0% Widowed1.7% DivorcedFemales 30.2% Never married58.0% Now married0.0% Separated9.0% Widowed2.8% DivorcedWomen who gave birth in the past 12 months Now married:
100.0% (17)Unmarried:
0.0% (0)
Women who did not give birth in the past 12 months Now married:
40.7% (53)Unmarried:
59.3% (78)
Marital status - Two or more races population 15 years and over
Males 30.9% Never married60.3% Now married0.0% Separated8.8% Widowed0.0% DivorcedFemales 18.8% Never married72.5% Now married5.8% Separated2.9% Widowed0.0% DivorcedWomen who gave birth in the past 12 months Now married:
100.0% (11)Unmarried:
0.0% (0)
Women who did not give birth in the past 12 months Now married:
69.8% (33)Unmarried:
30.2% (14)
Marital status - White alone, not Hispanic / Latino population 15 years and over
Males 18.4% Never married33.0% Now married1.9% Separated14.6% Widowed32.0% DivorcedFemales 6.8% Never married54.2% Now married0.0% Separated16.9% Widowed22.0% DivorcedWomen who did not give birth in the past 12 months Now married:
60.0% (14)Unmarried:
40.0% (10)
Marital status - Hispanic or Latino population 15 years and over
Males 49.6% Never married44.8% Now married0.8% Separated0.8% Widowed4.0% DivorcedFemales 28.6% Never married56.1% Now married1.6% Separated5.2% Widowed8.4% DivorcedWomen who gave birth in the past 12 months Now married:
100.0% (26)Unmarried:
0.0% (0)
Women who did not give birth in the past 12 months Now married:
47.7% (119)Unmarried:
52.3% (131)
Ancestries in Landover Hills
58 3.9% African25 1.7% Nigerian23 1.6% Scottish21 1.4% Jamaican18 1.2% American13 0.9% English12 0.8% Polish12 0.8% Trinidadian and Tobagonian8 0.5% European8 0.5% Irish6 0.4% Ghanaian4 0.3% German4 0.3% West Indian3 0.2% Norwegian2 0.1% Moroccan2 0.1% Guyanese2 0.1% Portuguese
Children Nativity (place of birth) in Landover Hills
Children under 6 years - Living with two parents Both parents native 26 100.0% NativeBoth parents foreign-born 79 82.5% Native17 17.5% Foreign-bornOne native, one foreign-born parent 17 100.0% NativeChildren under 6 years - Living with one parent Native parent 1 51.6% NativeForeign-born parent 37 100.0% NativeChildren 6 to 17 years - Living with two parents Both parents native 16 100.0% NativeBoth parents foreign-born 137 87.1% Native20 12.9% Foreign-bornOne native, one foreign-born parent 18 80.2% Native5 19.8% Foreign-bornChildren 6 to 17 years - Living with one parent Native parent 65 100.0% NativeForeign-born parent 114 54.2% Native96 45.8% Foreign-born
Grandparents responsible for own grandchildren in Landover Hills
Grandparents (30 to 59 years) White / Caucasian 7 47.1% Responsible for grandchildren8 52.9% Not responsible for grandchildrenBlack or African American 13 100.0% Not responsible for grandchildrenHispanic or Latino 10 52.1% Responsible for grandchildren9 47.9% Not responsible for grandchildren
Grandparents (60 years and over) White / Caucasian 4 100.0% Not responsible for grandchildrenBlack or African American 3 100.0% Not responsible for grandchildrenHispanic or Latino 77 100.0% Not responsible for grandchildren