Races in Lander, Wyoming (WY) Detailed Stats
Data:
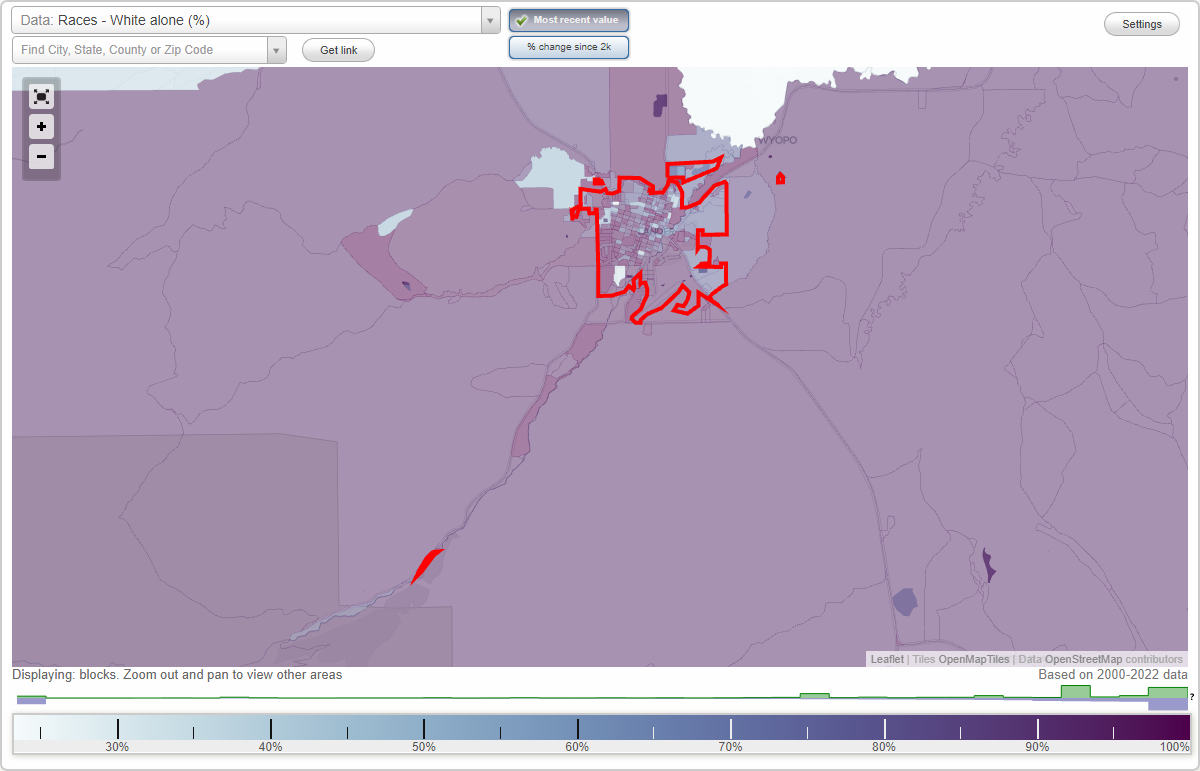
Races - White alone (%)
Races - White alone (% change since 2000)
Races - Black alone (%)
Races - Black alone (% change since 2000)
Races - American Indian alone (%)
Races - American Indian alone (% change since 2000)
Races - Asian alone (%)
Races - Asian alone (% change since 2000)
Races - Hispanic (%)
Races - Hispanic (% change since 2000)
Races - Native Hawaiian and Other Pacific Islander alone (%)
Races - Native Hawaiian and Other Pacific Islander alone (% change since 2000)
Races - Two or more races(%)
Races - Two or more races(% change since 2000)
Races - Other race alone (%)
Races - Other race alone (% change since 2000)
Racial diversity
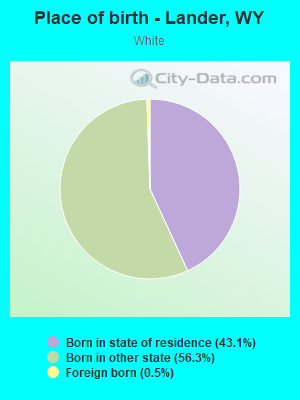
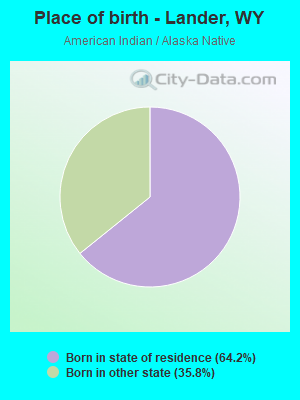
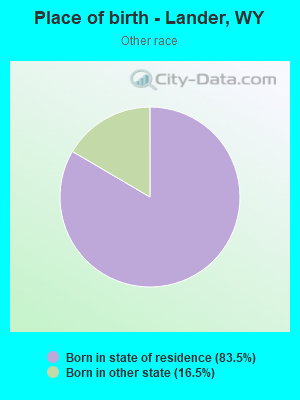
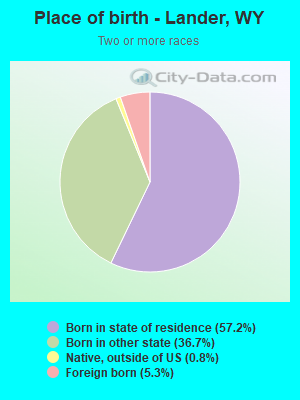
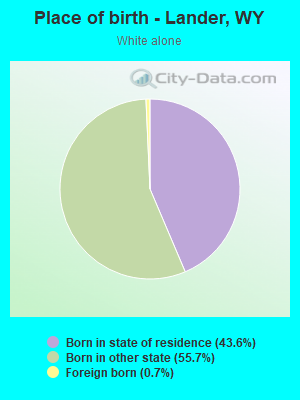
Place of birth - Born in state of residence (%)
Place of birth - Born in state of residence (%) - White
Place of birth - Born in state of residence (%) - Black or African American
Place of birth - Born in state of residence (%) - Asian
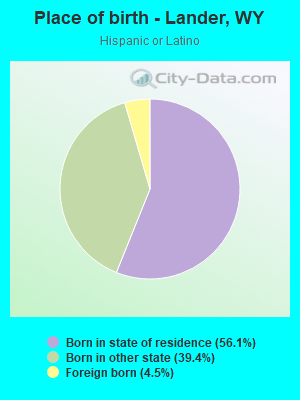
Place of birth - Born in state of residence (%) - Hispanic or Latino
Place of birth - Born in state of residence (%) - American Indian and Alaska Native
Place of birth - Born in state of residence (%) - Multirace
Place of birth - Born in state of residence (%) - Other Race
Place of birth - Born in other state (%)
Place of birth - Born in other state (%) - White
Place of birth - Born in other state (%) - Black or African American
Place of birth - Born in other state (%) - Asian
Place of birth - Born in other state (%) - Hispanic or Latino
Place of birth - Born in other state (%) - American Indian and Alaska Native
Place of birth - Born in other state (%) - Multirace
Place of birth - Born in other state (%) - Other Race
Place of birth - Native, outside of US (%)
Place of birth - Native, outside of US (%) - White
Place of birth - Native, outside of US (%) - Black or African American
Place of birth - Native, outside of US (%) - Asian
Place of birth - Native, outside of US (%) - Hispanic or Latino
Place of birth - Native, outside of US (%) - American Indian and Alaska Native
Place of birth - Native, outside of US (%) - Multirace
Place of birth - Native, outside of US (%) - Other Race
Place of birth - Foreign born (%)
Place of birth - Foreign born (%) - White
Place of birth - Foreign born (%) - Black or African American
Place of birth - Foreign born (%) - Asian
Place of birth - Foreign born (%) - Hispanic or Latino
Place of birth - Foreign born (%) - American Indian and Alaska Native
Place of birth - Foreign born (%) - Multirace
Place of birth - Foreign born (%) - Other Race
Residents speaking English at home (%)
Residents speaking English at home - Born in the United States (%)
Residents speaking English at home - Native, born elsewhere (%)
Residents speaking English at home - Foreign born (%)
Residents speaking Spanish at home (%)
Residents speaking Spanish at home - Born in the United States (%)
Residents speaking Spanish at home - Native, born elsewhere (%)
Residents speaking Spanish at home - Foreign born (%)
Residents speaking other language at home (%)
Residents speaking other language at home - Born in the United States (%)
Residents speaking other language at home - Native, born elsewhere (%)
Residents speaking other language at home - Foreign born (%)
Marital status - Never married (%)
Marital status - Now married (%)
Marital status - Separated (%)
Marital status - Widowed (%)
Marital status - Divorced (%)
Ancestries Reported - Arab (%)
Ancestries Reported - Czech (%)
Ancestries Reported - Danish (%)
Ancestries Reported - Dutch (%)
Ancestries Reported - English (%)
Ancestries Reported - French (%)
Ancestries Reported - French Canadian (%)
Ancestries Reported - German (%)
Ancestries Reported - Greek (%)
Ancestries Reported - Hungarian (%)
Ancestries Reported - Irish (%)
Ancestries Reported - Italian (%)
Ancestries Reported - Lithuanian (%)
Ancestries Reported - Norwegian (%)
Ancestries Reported - Polish (%)
Ancestries Reported - Portuguese (%)
Ancestries Reported - Russian (%)
Ancestries Reported - Scotch-Irish (%)
Ancestries Reported - Scottish (%)
Ancestries Reported - Slovak (%)
Ancestries Reported - Subsaharan African (%)
Ancestries Reported - Swedish (%)
Ancestries Reported - Swiss (%)
Ancestries Reported - Ukrainian (%)
Ancestries Reported - United States (%)
Ancestries Reported - Welsh (%)
Ancestries Reported - West Indian (%)
Ancestries Reported - Other (%)
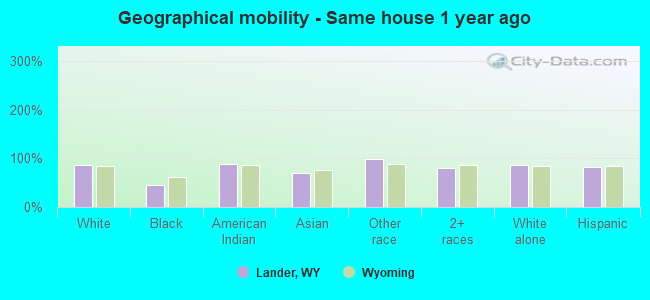
Geographical mobility - Same house 1 year ago (%)
Geographical mobility - Same house 1 year ago (%) - White
Geographical mobility - Same house 1 year ago (%) - Black or African American
Geographical mobility - Same house 1 year ago (%) - Asian
Geographical mobility - Same house 1 year ago (%) - Hispanic or Latino
Geographical mobility - Same house 1 year ago (%) - American Indian and Alaska Native
Geographical mobility - Same house 1 year ago (%) - Multirace
Geographical mobility - Same house 1 year ago (%) - Other Race
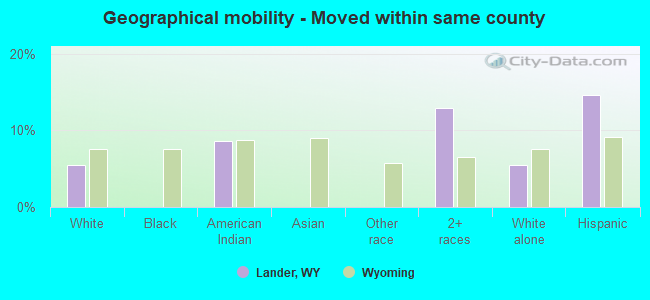
Geographical mobility - Moved within same county (%)
Geographical mobility - Moved within same county (%) - White
Geographical mobility - Moved within same county (%) - Black or African American
Geographical mobility - Moved within same county (%) - Asian
Geographical mobility - Moved within same county (%) - Hispanic or Latino
Geographical mobility - Moved within same county (%) - American Indian and Alaska Native
Geographical mobility - Moved within same county (%) - Multirace
Geographical mobility - Moved within same county (%) - Other Race
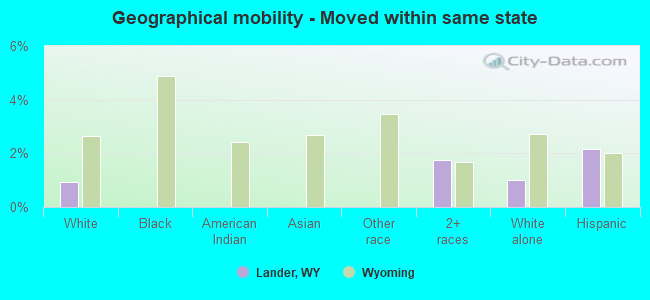
Geographical mobility - Moved from different county within same state (%)
Geographical mobility - Moved from different county within same state (%) - White
Geographical mobility - Moved from different county within same state (%) - Black or African American
Geographical mobility - Moved from different county within same state (%) - Asian
Geographical mobility - Moved from different county within same state (%) - Hispanic or Latino
Geographical mobility - Moved from different county within same state (%) - American Indian and Alaska Native
Geographical mobility - Moved from different county within same state (%) - Multirace
Geographical mobility - Moved from different county within same state (%) - Other Race
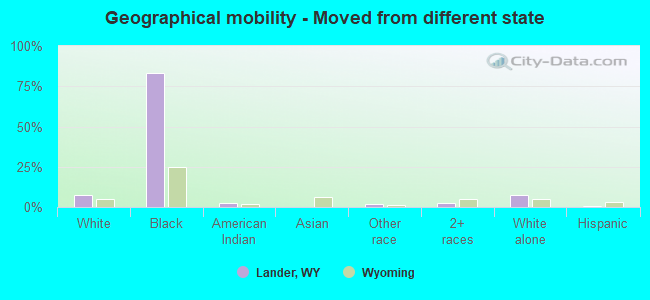
Geographical mobility - Moved from different state (%)
Geographical mobility - Moved from different state (%) - White
Geographical mobility - Moved from different state (%) - Black or African American
Geographical mobility - Moved from different state (%) - Asian
Geographical mobility - Moved from different state (%) - Hispanic or Latino
Geographical mobility - Moved from different state (%) - American Indian and Alaska Native
Geographical mobility - Moved from different state (%) - Multirace
Geographical mobility - Moved from different state (%) - Other Race
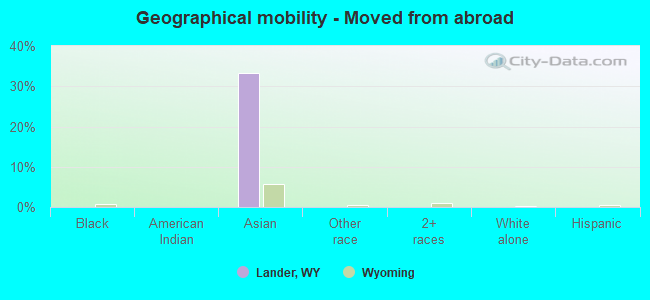
Geographical mobility - Moved from abroad (%)
Geographical mobility - Moved from abroad (%) - White
Geographical mobility - Moved from abroad (%) - Black or African American
Geographical mobility - Moved from abroad (%) - Asian
Geographical mobility - Moved from abroad (%) - Hispanic or Latino
Geographical mobility - Moved from abroad (%) - American Indian and Alaska Native
Geographical mobility - Moved from abroad (%) - Multirace
Geographical mobility - Moved from abroad (%) - Other Race
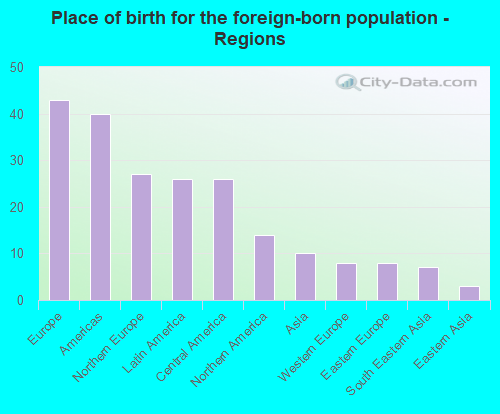
Place of birth for the foreign-born population - Ireland (%)
Place of birth for the foreign-born population - Denmark (%)
Place of birth for the foreign-born population - Norway (%)
Place of birth for the foreign-born population - Sweden (%)
Place of birth for the foreign-born population - United Kingdom (%)
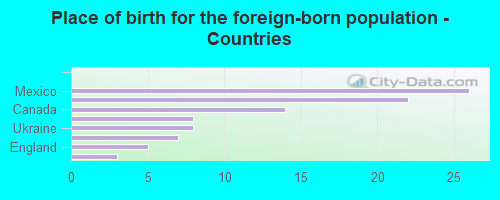
Place of birth for the foreign-born population - England (%)
Place of birth for the foreign-born population - Scotland (%)
Place of birth for the foreign-born population - Other Northern Europe (%)
Place of birth for the foreign-born population - Austria (%)
Place of birth for the foreign-born population - Belgium (%)
Place of birth for the foreign-born population - France (%)
Place of birth for the foreign-born population - Germany (%)
Place of birth for the foreign-born population - Netherlands (%)
Place of birth for the foreign-born population - Switzerland (%)
Place of birth for the foreign-born population - Other Western Europe (%)
Place of birth for the foreign-born population - Greece (%)
Place of birth for the foreign-born population - Italy (%)
Place of birth for the foreign-born population - Portugal (%)
Place of birth for the foreign-born population - Spain (%)
Place of birth for the foreign-born population - Other Southern Europe (%)
Place of birth for the foreign-born population - Albania (%)
Place of birth for the foreign-born population - Belarus (%)
Place of birth for the foreign-born population - Bosnia and Herzegovina (%)
Place of birth for the foreign-born population - Bulgaria (%)
Place of birth for the foreign-born population - Croatia (%)
Place of birth for the foreign-born population - Czechoslovakia (%)
Place of birth for the foreign-born population - Hungary (%)
Place of birth for the foreign-born population - Latvia (%)
Place of birth for the foreign-born population - Lithuania (%)
Place of birth for the foreign-born population - North Macedonia (Macedonia) (%)
Place of birth for the foreign-born population - Moldova (%)
Place of birth for the foreign-born population - Poland (%)
Place of birth for the foreign-born population - Romania (%)
Place of birth for the foreign-born population - Russia (%)
Place of birth for the foreign-born population - Serbia (%)
Place of birth for the foreign-born population - Ukraine (%)
Place of birth for the foreign-born population - Other Eastern Europe (%)
Place of birth for the foreign-born population - China (%)
Place of birth for the foreign-born population - Hong Kong (%)
Place of birth for the foreign-born population - Taiwan (%)
Place of birth for the foreign-born population - Japan (%)
Place of birth for the foreign-born population - Korea (%)
Place of birth for the foreign-born population - Other Eastern Asia (%)
Place of birth for the foreign-born population - Afghanistan (%)
Place of birth for the foreign-born population - Bangladesh (%)
Place of birth for the foreign-born population - India (%)
Place of birth for the foreign-born population - Iran (%)
Place of birth for the foreign-born population - Kazakhstan (%)
Place of birth for the foreign-born population - Nepal (%)
Place of birth for the foreign-born population - Pakistan (%)
Place of birth for the foreign-born population - Sri Lanka (%)
Place of birth for the foreign-born population - Uzbekistan (%)
Place of birth for the foreign-born population - Other South Central Asia (%)
Place of birth for the foreign-born population - Burma (%)
Place of birth for the foreign-born population - Cambodia (%)
Place of birth for the foreign-born population - Indonesia (%)
Place of birth for the foreign-born population - Laos (%)
Place of birth for the foreign-born population - Malaysia (%)
Place of birth for the foreign-born population - Philippines (%)
Place of birth for the foreign-born population - Singapore (%)
Place of birth for the foreign-born population - Thailand (%)
Place of birth for the foreign-born population - Vietnam (%)
Place of birth for the foreign-born population - Other South Eastern Asia (%)
Place of birth for the foreign-born population - Armenia (%)
Place of birth for the foreign-born population - Iraq (%)
Place of birth for the foreign-born population - Israel (%)
Place of birth for the foreign-born population - Jordan (%)
Place of birth for the foreign-born population - Kuwait (%)
Place of birth for the foreign-born population - Lebanon (%)
Place of birth for the foreign-born population - Saudi Arabia (%)
Place of birth for the foreign-born population - Syria (%)
Place of birth for the foreign-born population - Turkey (%)
Place of birth for the foreign-born population - Yemen (%)
Place of birth for the foreign-born population - Other Western Asia (%)
Place of birth for the foreign-born population - Eritrea (%)
Place of birth for the foreign-born population - Ethiopia (%)
Place of birth for the foreign-born population - Kenya (%)
Place of birth for the foreign-born population - Somalia (%)
Place of birth for the foreign-born population - Uganda (%)
Place of birth for the foreign-born population - Zimbabwe (%)
Place of birth for the foreign-born population - Other Eastern Africa (%)
Place of birth for the foreign-born population - Cameroon (%)
Place of birth for the foreign-born population - Congo (%)
Place of birth for the foreign-born population - Democratic Republic of Congo (Zaire) (%)
Place of birth for the foreign-born population - Other Middle Africa (%)
Place of birth for the foreign-born population - Egypt (%)
Place of birth for the foreign-born population - Morocco (%)
Place of birth for the foreign-born population - Sudan (%)
Place of birth for the foreign-born population - Other Northern Africa (%)
Place of birth for the foreign-born population - South Africa (%)
Place of birth for the foreign-born population - Other Southern Africa (%)
Place of birth for the foreign-born population - Cabo Verde (%)
Place of birth for the foreign-born population - Ghana (%)
Place of birth for the foreign-born population - Liberia (%)
Place of birth for the foreign-born population - Nigeria (%)
Place of birth for the foreign-born population - Senegal (%)
Place of birth for the foreign-born population - Sierra Leone (%)
Place of birth for the foreign-born population - Other Western Africa (%)
Place of birth for the foreign-born population - Australia (%)
Place of birth for the foreign-born population - New Zealand (%)
Place of birth for the foreign-born population - Fiji (%)
Place of birth for the foreign-born population - Micronesia (%)
Place of birth for the foreign-born population - Bahamas (%)
Place of birth for the foreign-born population - Barbados (%)
Place of birth for the foreign-born population - Cuba (%)
Place of birth for the foreign-born population - Dominica (%)
Place of birth for the foreign-born population - Dominican Republic (%)
Place of birth for the foreign-born population - Grenada (%)
Place of birth for the foreign-born population - Haiti (%)
Place of birth for the foreign-born population - Jamaica (%)
Place of birth for the foreign-born population - St. Vincent and the Grenadines (%)
Place of birth for the foreign-born population - Trinidad and Tobago (%)
Place of birth for the foreign-born population - West Indies (%)
Place of birth for the foreign-born population - Other Caribbean (%)
Place of birth for the foreign-born population - Belize (%)
Place of birth for the foreign-born population - Costa Rica (%)
Place of birth for the foreign-born population - El Salvador (%)
Place of birth for the foreign-born population - Guatemala (%)
Place of birth for the foreign-born population - Honduras (%)
Place of birth for the foreign-born population - Mexico (%)
Place of birth for the foreign-born population - Nicaragua (%)
Place of birth for the foreign-born population - Panama (%)
Place of birth for the foreign-born population - Other Central America (%)
Place of birth for the foreign-born population - Argentina (%)
Place of birth for the foreign-born population - Bolivia (%)
Place of birth for the foreign-born population - Brazil (%)
Place of birth for the foreign-born population - Chile (%)
Place of birth for the foreign-born population - Colombia (%)
Place of birth for the foreign-born population - Ecuador (%)
Place of birth for the foreign-born population - Guyana (%)
Place of birth for the foreign-born population - Peru (%)
Place of birth for the foreign-born population - Uruguay (%)
Place of birth for the foreign-born population - Venezuela (%)
Place of birth for the foreign-born population - Other South America (%)
Place of birth for the foreign-born population - Canada (%)
Place of birth for the foreign-born population - Other Northern America (%)
Place of birth for the foreign-born population - Other (%)
According to 2022 data, the most numerous races in Lander, WY are White alone (6,238 residents), Hispanic (521 residents), and Two or more races (295 residents). 95.4% of Lander residents speak English at home. 1.2% of Lander, WY residents are foreign-born , which is 142.7% less than the foreign-born rate of 3.0% across the entire state of Wyoming.
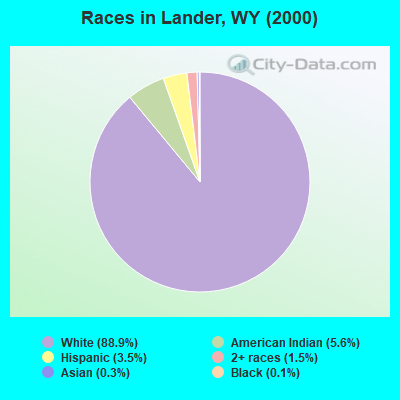
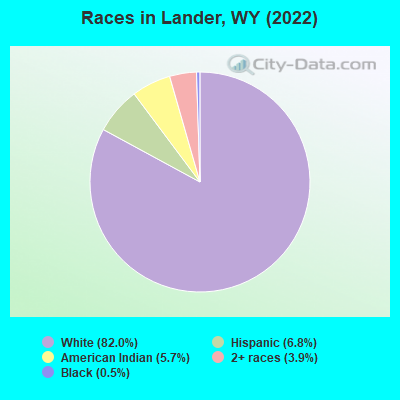
Race distribution in Lander
2000 2022
438,799 88.9% White alone 31,669 6.4% Hispanic 10,238 2.1% American Indian alone 6,164 1.2% Two or more races 3,504 0.7% Black alone 2,670 0.5% Asian alone 474 0.10% Other race alone 264 0.05% Native Hawaiian and Other
473,220 81.4% White alone 62,803 10.8% Hispanic 22,911 3.9% Two or more races 9,589 1.6% American Indian alone 4,997 0.9% Other race alone 3,990 0.7% Black alone 3,577 0.6% Asian alone 294 0.05% Native Hawaiian and Other
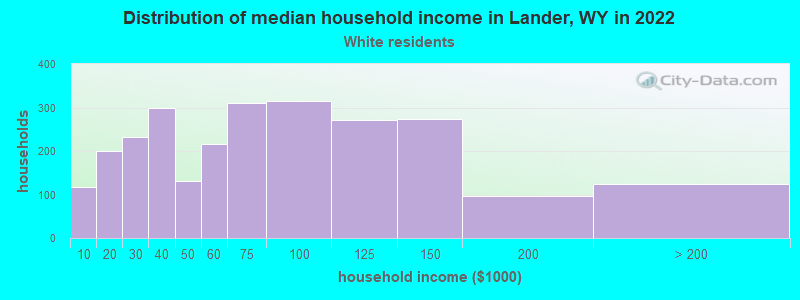
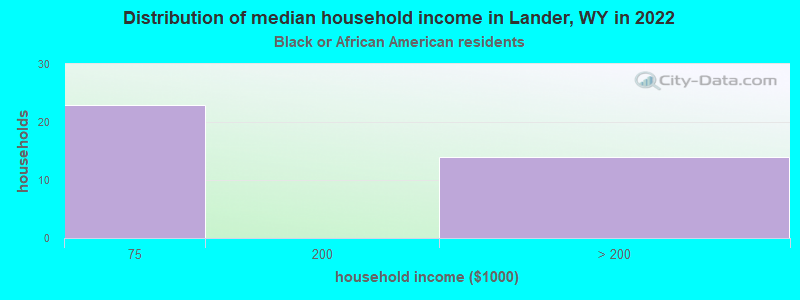
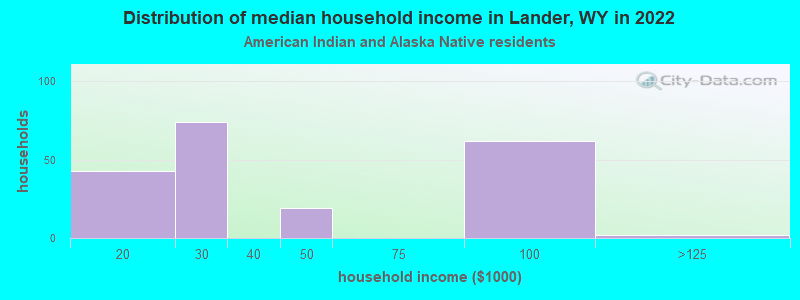
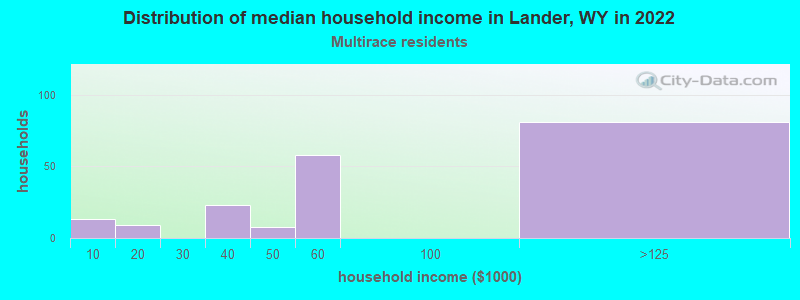
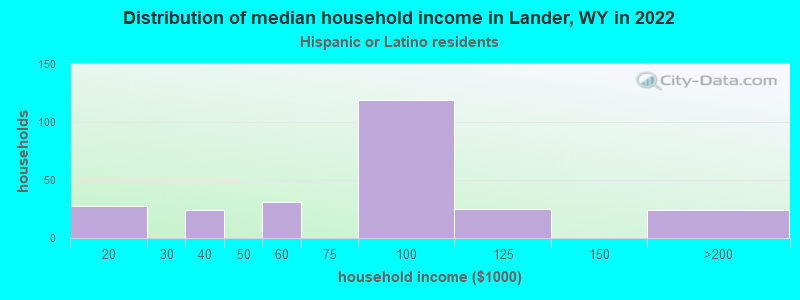
Income and house value in Lander Median household income in 2022 $60,698 White non-Hispanic householders$61,360 Two or more races householders$108,538 Hispanic or Latino race householdersMedian 2022 house value $327,592 White Non-Hispanic householders$709,390 American Indian or Alaska Native householders$116,492 Hispanic or Latino householders
Median age by race in Lander
38.6 Median age for White residents39.1 38.2 33.4 Median age for Black or African American residents-558,558,558.0 -746,302,615.9 29.8 Median age for American Indian / Alaska Native residents40.9 24.7 -802,845,527.7 Median age for Asian residents-684,684,684.0 -929,503,915.5 -594,708,994.1 Median age for Native Hawaiian / Pacific Islander residents-652,729,383.8 -865,828,091.4 9.6 Median age for Other race residents-797,948,717.2 -658,511,722.1 23.9 Median age for Two or more races residents24.7 13.0 38.9 Median age for White alone residents38.8 39.2 22.9 Median age for Hispanic or Latino residents23.2 21.7
Owner/renter occupied households by race in Lander
House owners and renters - White residents 1,935 75.4% Owner occupied630 24.6% Renter occupiedHouse owners and renters - Black or African American residents 34 100.0% Renter occupiedHouse owners and renters - American Indian / Alaska Native residents 285 100.0% Renter occupiedHouse owners and renters - Asian residents 4 100.0% Renter occupiedHouse owners and renters - Two or more races residents 96 45.6% Owner occupied115 54.4% Renter occupiedHouse owners and renters - White alone residents 1,918 75.5% Owner occupied624 24.5% Renter occupiedHouse owners and renters - Hispanic or Latino residents 73 31.6% Owner occupied157 68.4% Renter occupied
Language usage in Lander
English speakers - Total 95.4% of residents of Lander speak English at home.
2.7% of residents speak Spanish at home 167 87.4% Speak English very well24 12.6% Speak English less than very well1.7% of residents speak other language at home 117 95.1% Speak English very well6 4.9% Speak English less than very well
English speakers - Born in the United States 95.5% of residents of Lander speak English at home.
2.3% of residents speak Spanish at home 85 93.4% Speak English very well6 6.6% Speak English less than very well1.8% of residents speak other language at home 70 100.0% Speak English very well
All residents speak only English at home
English speakers - Foreign-born 51.8% of residents of Lander speak English at home.
27.7% of residents speak Spanish at home 23 100.0% Speak English very well13.3% of residents speak other language at home 5 45.5% Speak English very well6 54.5% Speak English less than very well
White (Caucasian) - Speak only English Native:
98.0% (5,805)Foreign-born:
100.0% (33)
White (Caucasian) - Speak another language Native:
1.9% (111)Foreign-born:
12.4% (4)
Two or more races - Speak another language Native:
23.6% (111)Foreign-born:
100.0% (37)
White alone - Speak only English Native:
97.4% (5,749)Foreign-born:
84.4% (37)
White alone - Speak another language Native:
2.2% (132)Foreign-born:
14.4% (6)
Hispanic or Latino - Speak another language Native:
14.2% (60)Foreign-born:
100.0% (24)
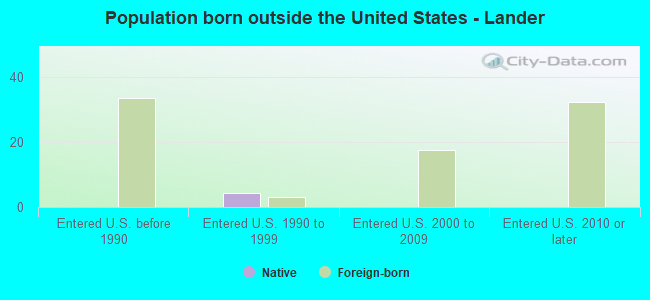
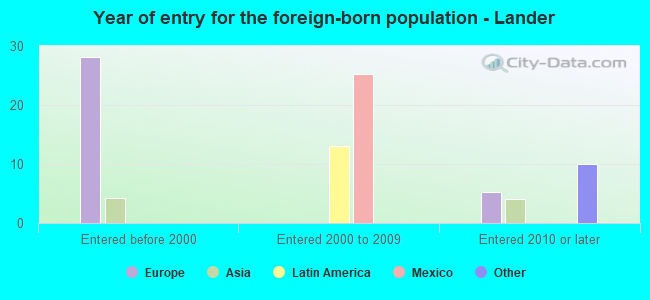
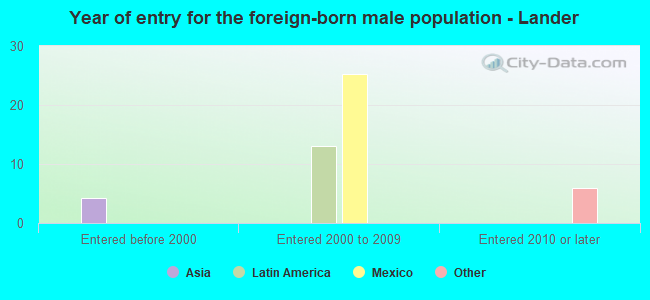
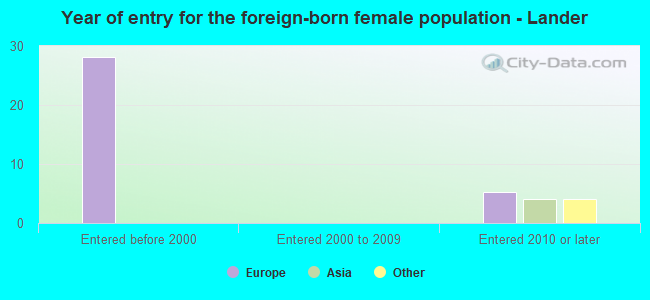
Foreign-born residents in Lander 94 residents are foreign born
This city:
1.2%Wyoming:
3.4%
Marital status for residents in Lander Marital status - White (Caucasian) population 15 years and over
Males 28.3% Never married50.5% Now married7.1% Separated2.7% Widowed11.4% DivorcedFemales 22.7% Never married47.1% Now married3.0% Separated10.8% Widowed16.4% DivorcedWomen who gave birth in the past 12 months Now married:
94.1% (92)Unmarried:
5.9% (6)
Women who did not give birth in the past 12 months Now married:
50.5% (609)Unmarried:
49.5% (597)
Marital status - Black or African American population 15 years and over
Males 0.0% Never married100.0% Now married0.0% Separated0.0% Widowed0.0% DivorcedFemales 68.8% Never married31.2% Now married0.0% Separated0.0% Widowed0.0% DivorcedWomen who did not give birth in the past 12 months Now married:
31.3% (10)Unmarried:
68.8% (21)
Marital status - American Indian / Alaska Native population 15 years and over
Males 50.2% Never married39.1% Now married0.0% Separated0.0% Widowed10.7% DivorcedFemales 56.7% Never married27.4% Now married1.4% Separated0.0% Widowed14.4% DivorcedWomen who gave birth in the past 12 months Now married:
62.5% (5)Unmarried:
37.5% (3)
Women who did not give birth in the past 12 months Now married:
31.1% (48)Unmarried:
68.9% (105)
Marital status - Asian population 15 years and over
Males 100.0% Never married0.0% Now married0.0% Separated0.0% Widowed0.0% DivorcedFemales 0.0% Never married100.0% Now married0.0% Separated0.0% Widowed0.0% DivorcedWomen who did not give birth in the past 12 months Now married:
100.0% (7)Unmarried:
0.0% (0)
Marital status - Other race population 15 years and over
Males 100.0% Never married0.0% Now married0.0% Separated0.0% Widowed0.0% DivorcedFemales 50.0% Never married0.0% Now married0.0% Separated0.0% Widowed50.0% DivorcedWomen who did not give birth in the past 12 months Now married:
0.0% (0)Unmarried:
100.0% (4)
Marital status - Two or more races population 15 years and over
Males 50.0% Never married42.2% Now married0.0% Separated0.0% Widowed7.8% DivorcedFemales 14.7% Never married46.7% Now married0.0% Separated0.0% Widowed38.7% DivorcedWomen who did not give birth in the past 12 months Now married:
0.0% (0)Unmarried:
100.0% (25)
Marital status - White alone, not Hispanic / Latino population 15 years and over
Males 28.4% Never married50.4% Now married7.1% Separated2.7% Widowed11.4% DivorcedFemales 22.7% Never married46.2% Now married3.1% Separated11.1% Widowed16.9% DivorcedWomen who gave birth in the past 12 months Now married:
94.1% (94)Unmarried:
5.9% (6)
Women who did not give birth in the past 12 months Now married:
49.2% (571)Unmarried:
50.8% (591)
Marital status - Hispanic or Latino population 15 years and over
Males 29.2% Never married63.6% Now married0.0% Separated0.0% Widowed7.2% DivorcedFemales 30.0% Never married66.4% Now married0.0% Separated0.0% Widowed3.6% DivorcedWomen who did not give birth in the past 12 months Now married:
60.5% (52)Unmarried:
39.5% (34)
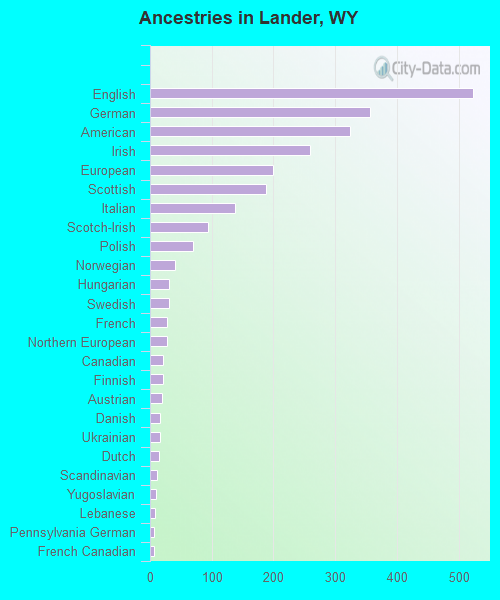
Ancestries in Lander
523 16.2% English356 11.0% German324 10.0% American259 8.0% Irish199 6.2% European188 5.8% Scottish137 4.2% Italian94 2.9% Scotch-Irish70 2.2% Polish41 1.3% Norwegian31 1.0% Hungarian31 1.0% Swedish28 0.9% French27 0.8% Northern European21 0.7% Canadian21 0.7% Finnish19 0.6% Austrian17 0.5% Danish17 0.5% Ukrainian15 0.5% Dutch11 0.3% Scandinavian9 0.3% Yugoslavian8 0.2% Lebanese7 0.2% Pennsylvania German6 0.2% French Canadian3 0.09% British
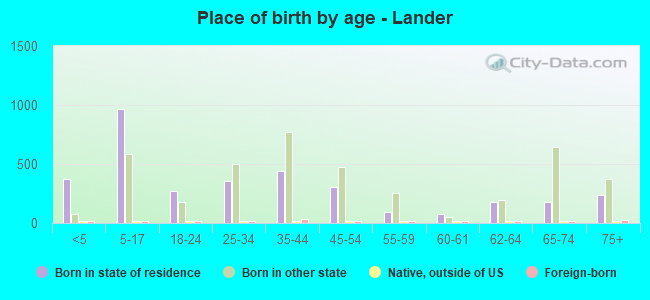
Children Nativity (place of birth) in Lander
Children under 6 years - Living with two parents Both parents native 403 100.0% NativeOne native, one foreign-born parent 14 100.0% NativeChildren under 6 years - Living with one parent Native parent 43 100.0% Native
Children 6 to 17 years - Living with two parents Both parents native 949 100.0% NativeOne native, one foreign-born parent 10 100.0% NativeChildren 6 to 17 years - Living with one parent Native parent 410 100.0% Native
Grandparents responsible for own grandchildren in Lander
Grandparents (30 to 59 years) White / Caucasian 9 100.0% Responsible for grandchildrenAmerican Indian / Alaska Native 20 100.0% Responsible for grandchildrenWhite alone, not Hispanic / Latino 12 100.0% Responsible for grandchildrenGrandparents (60 years and over) White / Caucasian 11 45.1% Responsible for grandchildren13 54.9% Not responsible for grandchildrenWhite alone, not Hispanic / Latino 11 46.8% Responsible for grandchildren13 53.2% Not responsible for grandchildren