Races in Lakewood Gardens, Florida (FL) Detailed Stats
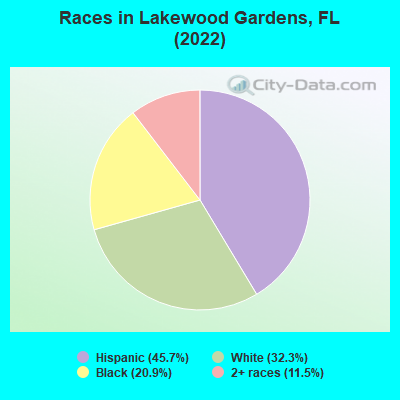
According to 2022 data, the most numerous races in Lakewood Gardens, FL are White alone (335 residents), Hispanic (474 residents), and Black alone (217 residents). 37.7% of Lakewood Gardens residents speak English at home.
Race distribution in Lakewood Gardens 474 45.7% Hispanic 335 32.3% White alone 217 20.9% Black alone 119 11.5% Two or more races
2000 2022
10,458,509 65.4% White alone 2,682,715 16.8% Hispanic 2,264,268 14.2% Black alone 261,693 1.6% Asian alone 236,954 1.5% Two or more races 42,358 0.3% American Indian alone 28,994 0.2% Other race alone 6,887 0.04% Native Hawaiian and Other
11,309,403 50.8% White alone 6,025,039 27.1% Hispanic 3,241,015 14.6% Black alone 861,630 3.9% Two or more races 623,692 2.8% Asian alone 152,054 0.7% Other race alone 22,504 0.1% American Indian alone 9,486 0.04% Native Hawaiian and Other
Income and house value in Lakewood Gardens Median household income in 2022 $63,915 White non-Hispanic householders$48,467 Black householders$26,400 Hispanic or Latino race householders
Median age by race in Lakewood Gardens
41.1 Median age for White residents35.4 46.4 39.2 Median age for Black or African American residents43.7 37.2 94.6 Median age for Other race residents97.1 91.8 26.6 Median age for Two or more races residents33.4 0.0 50.3 Median age for White alone residents50.4 53.0 36.7 Median age for Hispanic or Latino residents29.1 37.2
Owner/renter occupied households by race in Lakewood Gardens
House owners and renters - White residents 81 35.3% Owner occupied149 64.7% Renter occupiedHouse owners and renters - Black or African American residents 19 100.0% Owner occupiedHouse owners and renters - Other race residents 16 100.0% Owner occupiedHouse owners and renters - White alone residents 69 43.6% Owner occupied90 56.4% Renter occupiedHouse owners and renters - Hispanic or Latino residents 36 26.3% Owner occupied100 73.7% Renter occupied
Language usage in Lakewood Gardens
English speakers - Total 37.7% of residents of Lakewood Gardens speak English at home.
39.3% of residents speak Spanish at home 211 58.4% Speak English very well150 41.6% Speak English less than very well26.5% of residents speak other language at home 97 39.9% Speak English very well146 60.1% Speak English less than very well
English speakers - Born in the United States 79.2% of residents of Lakewood Gardens speak English at home.
24.3% of residents speak Spanish at home 70 100.0% Speak English very well
English speakers - Native, born elsewhere 43.6% of residents of Lakewood Gardens speak English at home.
59.0% of residents speak other language at home 46 100.0% Speak English very well
English speakers - Foreign-born 0.0% of residents of Lakewood Gardens speak English at home.
51.1% of residents speak Spanish at home 65 30.8% Speak English very well146 69.2% Speak English less than very well46.0% of residents speak other language at home 61 32.1% Speak English very well129 67.9% Speak English less than very well
White (Caucasian) - Speak another language Native:
28.2% (107)Foreign-born:
96.4% (115)
Black or African American - Speak another language Native:
92.2% (39)Foreign-born:
100.0% (142)
White alone - Speak another language Native:
7.2% (20)Foreign-born:
100.0% (43)
Hispanic or Latino - Speak another language Native:
90.2% (148)Foreign-born:
98.7% (216)
Foreign-born residents in Lakewood Gardens
Marital status for residents in Lakewood Gardens Marital status - White (Caucasian) population 15 years and over
Males 43.6% Never married40.2% Now married0.0% Separated0.0% Widowed16.2% DivorcedFemales 28.8% Never married42.1% Now married0.0% Separated6.6% Widowed22.5% DivorcedWomen who gave birth in the past 12 months Now married:
66.7% (15)Unmarried:
33.3% (8)
Women who did not give birth in the past 12 months Now married:
34.4% (46)Unmarried:
65.6% (87)
Marital status - Black or African American population 15 years and over
Males 71.3% Never married28.7% Now married0.0% Separated0.0% Widowed0.0% DivorcedFemales 33.3% Never married66.7% Now married0.0% Separated0.0% Widowed0.0% DivorcedWomen who gave birth in the past 12 months Now married:
100.0% (32)Unmarried:
0.0% (0)
Women who did not give birth in the past 12 months Now married:
0.0% (0)Unmarried:
100.0% (16)
Marital status - Other race population 15 years and over
Males 0.0% Never married100.0% Now married0.0% Separated0.0% Widowed0.0% DivorcedFemales 0.0% Never married100.0% Now married0.0% Separated0.0% Widowed0.0% DivorcedWomen who did not give birth in the past 12 months Now married:
100.0% (14)Unmarried:
0.0% (0)
Marital status - White alone, not Hispanic / Latino population 15 years and over
Males 26.4% Never married61.5% Now married0.0% Separated0.0% Widowed12.1% DivorcedFemales 20.1% Never married42.1% Now married0.0% Separated8.6% Widowed29.2% DivorcedWomen who gave birth in the past 12 months Now married:
100.0% (16)Unmarried:
0.0% (0)
Women who did not give birth in the past 12 months Now married:
36.1% (39)Unmarried:
63.9% (68)
Marital status - Hispanic or Latino population 15 years and over
Males 46.8% Never married37.4% Now married0.0% Separated0.0% Widowed15.8% DivorcedFemales 40.4% Never married59.6% Now married0.0% Separated0.0% Widowed0.0% DivorcedWomen who gave birth in the past 12 months Now married:
0.0% (0)Unmarried:
100.0% (12)
Women who did not give birth in the past 12 months Now married:
43.7% (28)Unmarried:
56.2% (35)
Ancestries in Lakewood Gardens
206 32.9% Haitian55 8.8% Estonian18 2.9% English11 1.8% American11 1.8% Jamaican9 1.4% Irish8 1.3% German5 0.8% Finnish5 0.8% Polish3 0.5% Scotch-Irish
Children Nativity (place of birth) in Lakewood Gardens
Children under 6 years - Living with two parents Both parents native 14 100.0% NativeBoth parents foreign-born 49 100.0% NativeChildren under 6 years - Living with one parent Native parent 66 100.0% Native
Children 6 to 17 years - Living with two parents Both parents native 34 100.0% NativeBoth parents foreign-born 25 96.1% Native1 3.9% Foreign-bornChildren 6 to 17 years - Living with one parent Native parent 25 100.0% Native