Races in Lago Vista, Texas (TX) Detailed Stats
Data:
Races - White alone (%)
Races - White alone (% change since 2000)
Races - Black alone (%)
Races - Black alone (% change since 2000)
Races - American Indian alone (%)
Races - American Indian alone (% change since 2000)
Races - Asian alone (%)
Races - Asian alone (% change since 2000)
Races - Hispanic (%)
Races - Hispanic (% change since 2000)
Races - Native Hawaiian and Other Pacific Islander alone (%)
Races - Native Hawaiian and Other Pacific Islander alone (% change since 2000)
Races - Two or more races(%)
Races - Two or more races(% change since 2000)
Races - Other race alone (%)
Races - Other race alone (% change since 2000)
Racial diversity
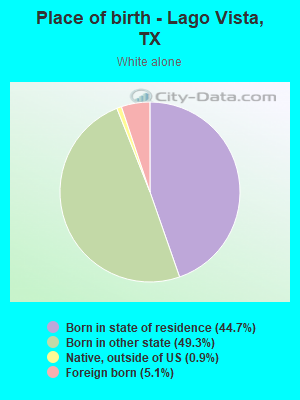
Place of birth - Born in state of residence (%)
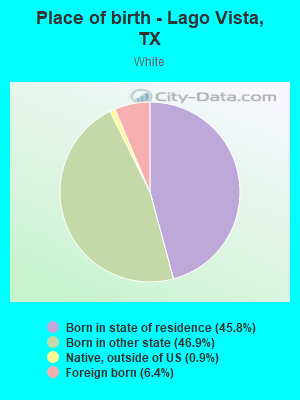
Place of birth - Born in state of residence (%) - White
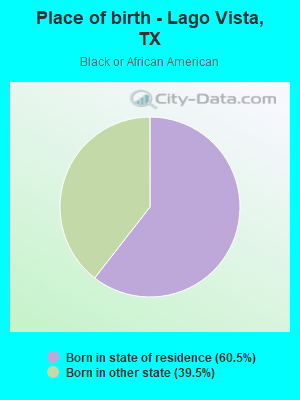
Place of birth - Born in state of residence (%) - Black or African American
Place of birth - Born in state of residence (%) - Asian
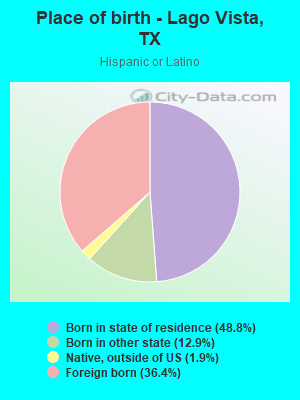
Place of birth - Born in state of residence (%) - Hispanic or Latino
Place of birth - Born in state of residence (%) - American Indian and Alaska Native
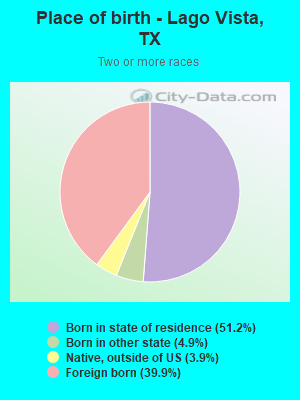
Place of birth - Born in state of residence (%) - Multirace
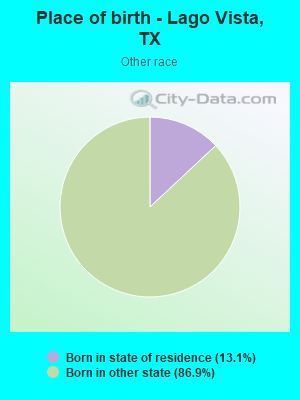
Place of birth - Born in state of residence (%) - Other Race
Place of birth - Born in other state (%)
Place of birth - Born in other state (%) - White
Place of birth - Born in other state (%) - Black or African American
Place of birth - Born in other state (%) - Asian
Place of birth - Born in other state (%) - Hispanic or Latino
Place of birth - Born in other state (%) - American Indian and Alaska Native
Place of birth - Born in other state (%) - Multirace
Place of birth - Born in other state (%) - Other Race
Place of birth - Native, outside of US (%)
Place of birth - Native, outside of US (%) - White
Place of birth - Native, outside of US (%) - Black or African American
Place of birth - Native, outside of US (%) - Asian
Place of birth - Native, outside of US (%) - Hispanic or Latino
Place of birth - Native, outside of US (%) - American Indian and Alaska Native
Place of birth - Native, outside of US (%) - Multirace
Place of birth - Native, outside of US (%) - Other Race
Place of birth - Foreign born (%)
Place of birth - Foreign born (%) - White
Place of birth - Foreign born (%) - Black or African American
Place of birth - Foreign born (%) - Asian
Place of birth - Foreign born (%) - Hispanic or Latino
Place of birth - Foreign born (%) - American Indian and Alaska Native
Place of birth - Foreign born (%) - Multirace
Place of birth - Foreign born (%) - Other Race
Residents speaking English at home (%)
Residents speaking English at home - Born in the United States (%)
Residents speaking English at home - Native, born elsewhere (%)
Residents speaking English at home - Foreign born (%)
Residents speaking Spanish at home (%)
Residents speaking Spanish at home - Born in the United States (%)
Residents speaking Spanish at home - Native, born elsewhere (%)
Residents speaking Spanish at home - Foreign born (%)
Residents speaking other language at home (%)
Residents speaking other language at home - Born in the United States (%)
Residents speaking other language at home - Native, born elsewhere (%)
Residents speaking other language at home - Foreign born (%)
Marital status - Never married (%)
Marital status - Now married (%)
Marital status - Separated (%)
Marital status - Widowed (%)
Marital status - Divorced (%)
Ancestries Reported - Arab (%)
Ancestries Reported - Czech (%)
Ancestries Reported - Danish (%)
Ancestries Reported - Dutch (%)
Ancestries Reported - English (%)
Ancestries Reported - French (%)
Ancestries Reported - French Canadian (%)
Ancestries Reported - German (%)
Ancestries Reported - Greek (%)
Ancestries Reported - Hungarian (%)
Ancestries Reported - Irish (%)
Ancestries Reported - Italian (%)
Ancestries Reported - Lithuanian (%)
Ancestries Reported - Norwegian (%)
Ancestries Reported - Polish (%)
Ancestries Reported - Portuguese (%)
Ancestries Reported - Russian (%)
Ancestries Reported - Scotch-Irish (%)
Ancestries Reported - Scottish (%)
Ancestries Reported - Slovak (%)
Ancestries Reported - Subsaharan African (%)
Ancestries Reported - Swedish (%)
Ancestries Reported - Swiss (%)
Ancestries Reported - Ukrainian (%)
Ancestries Reported - United States (%)
Ancestries Reported - Welsh (%)
Ancestries Reported - West Indian (%)
Ancestries Reported - Other (%)
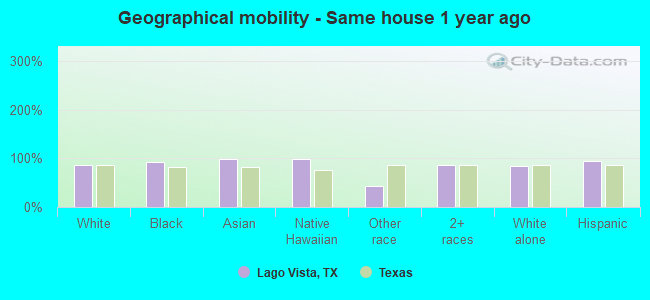
Geographical mobility - Same house 1 year ago (%)
Geographical mobility - Same house 1 year ago (%) - White
Geographical mobility - Same house 1 year ago (%) - Black or African American
Geographical mobility - Same house 1 year ago (%) - Asian
Geographical mobility - Same house 1 year ago (%) - Hispanic or Latino
Geographical mobility - Same house 1 year ago (%) - American Indian and Alaska Native
Geographical mobility - Same house 1 year ago (%) - Multirace
Geographical mobility - Same house 1 year ago (%) - Other Race
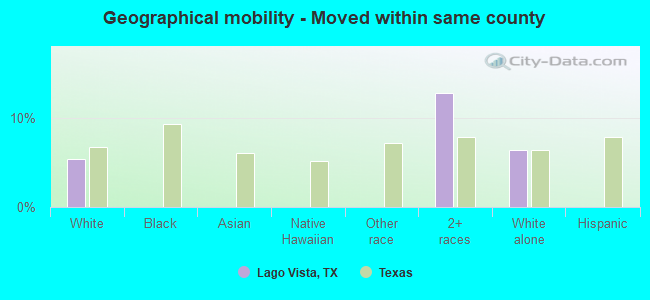
Geographical mobility - Moved within same county (%)
Geographical mobility - Moved within same county (%) - White
Geographical mobility - Moved within same county (%) - Black or African American
Geographical mobility - Moved within same county (%) - Asian
Geographical mobility - Moved within same county (%) - Hispanic or Latino
Geographical mobility - Moved within same county (%) - American Indian and Alaska Native
Geographical mobility - Moved within same county (%) - Multirace
Geographical mobility - Moved within same county (%) - Other Race
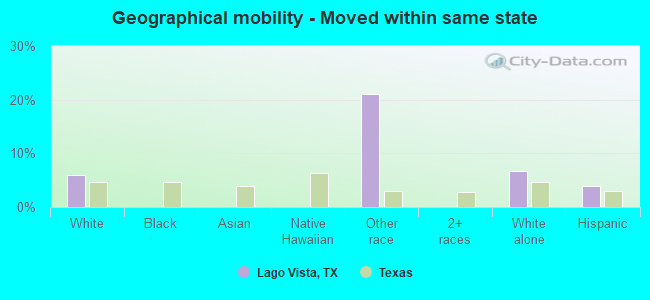
Geographical mobility - Moved from different county within same state (%)
Geographical mobility - Moved from different county within same state (%) - White
Geographical mobility - Moved from different county within same state (%) - Black or African American
Geographical mobility - Moved from different county within same state (%) - Asian
Geographical mobility - Moved from different county within same state (%) - Hispanic or Latino
Geographical mobility - Moved from different county within same state (%) - American Indian and Alaska Native
Geographical mobility - Moved from different county within same state (%) - Multirace
Geographical mobility - Moved from different county within same state (%) - Other Race
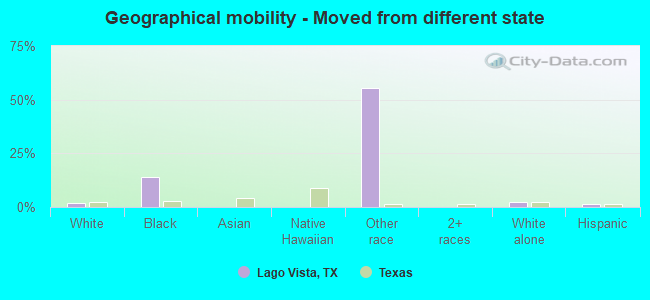
Geographical mobility - Moved from different state (%)
Geographical mobility - Moved from different state (%) - White
Geographical mobility - Moved from different state (%) - Black or African American
Geographical mobility - Moved from different state (%) - Asian
Geographical mobility - Moved from different state (%) - Hispanic or Latino
Geographical mobility - Moved from different state (%) - American Indian and Alaska Native
Geographical mobility - Moved from different state (%) - Multirace
Geographical mobility - Moved from different state (%) - Other Race
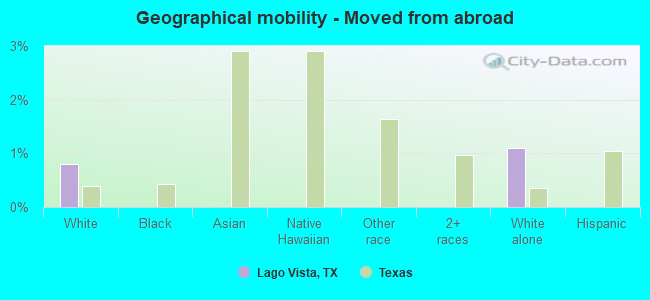
Geographical mobility - Moved from abroad (%)
Geographical mobility - Moved from abroad (%) - White
Geographical mobility - Moved from abroad (%) - Black or African American
Geographical mobility - Moved from abroad (%) - Asian
Geographical mobility - Moved from abroad (%) - Hispanic or Latino
Geographical mobility - Moved from abroad (%) - American Indian and Alaska Native
Geographical mobility - Moved from abroad (%) - Multirace
Geographical mobility - Moved from abroad (%) - Other Race
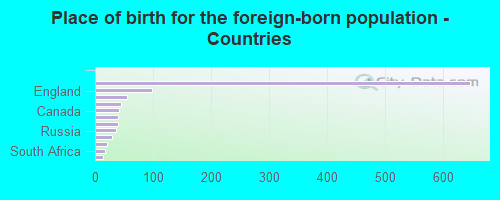
Place of birth for the foreign-born population - Ireland (%)
Place of birth for the foreign-born population - Denmark (%)
Place of birth for the foreign-born population - Norway (%)
Place of birth for the foreign-born population - Sweden (%)
Place of birth for the foreign-born population - United Kingdom (%)
Place of birth for the foreign-born population - England (%)
Place of birth for the foreign-born population - Scotland (%)
Place of birth for the foreign-born population - Other Northern Europe (%)
Place of birth for the foreign-born population - Austria (%)
Place of birth for the foreign-born population - Belgium (%)
Place of birth for the foreign-born population - France (%)
Place of birth for the foreign-born population - Germany (%)
Place of birth for the foreign-born population - Netherlands (%)
Place of birth for the foreign-born population - Switzerland (%)
Place of birth for the foreign-born population - Other Western Europe (%)
Place of birth for the foreign-born population - Greece (%)
Place of birth for the foreign-born population - Italy (%)
Place of birth for the foreign-born population - Portugal (%)
Place of birth for the foreign-born population - Spain (%)
Place of birth for the foreign-born population - Other Southern Europe (%)
Place of birth for the foreign-born population - Albania (%)
Place of birth for the foreign-born population - Belarus (%)
Place of birth for the foreign-born population - Bosnia and Herzegovina (%)
Place of birth for the foreign-born population - Bulgaria (%)
Place of birth for the foreign-born population - Croatia (%)
Place of birth for the foreign-born population - Czechoslovakia (%)
Place of birth for the foreign-born population - Hungary (%)
Place of birth for the foreign-born population - Latvia (%)
Place of birth for the foreign-born population - Lithuania (%)
Place of birth for the foreign-born population - North Macedonia (Macedonia) (%)
Place of birth for the foreign-born population - Moldova (%)
Place of birth for the foreign-born population - Poland (%)
Place of birth for the foreign-born population - Romania (%)
Place of birth for the foreign-born population - Russia (%)
Place of birth for the foreign-born population - Serbia (%)
Place of birth for the foreign-born population - Ukraine (%)
Place of birth for the foreign-born population - Other Eastern Europe (%)
Place of birth for the foreign-born population - China (%)
Place of birth for the foreign-born population - Hong Kong (%)
Place of birth for the foreign-born population - Taiwan (%)
Place of birth for the foreign-born population - Japan (%)
Place of birth for the foreign-born population - Korea (%)
Place of birth for the foreign-born population - Other Eastern Asia (%)
Place of birth for the foreign-born population - Afghanistan (%)
Place of birth for the foreign-born population - Bangladesh (%)
Place of birth for the foreign-born population - India (%)
Place of birth for the foreign-born population - Iran (%)
Place of birth for the foreign-born population - Kazakhstan (%)
Place of birth for the foreign-born population - Nepal (%)
Place of birth for the foreign-born population - Pakistan (%)
Place of birth for the foreign-born population - Sri Lanka (%)
Place of birth for the foreign-born population - Uzbekistan (%)
Place of birth for the foreign-born population - Other South Central Asia (%)
Place of birth for the foreign-born population - Burma (%)
Place of birth for the foreign-born population - Cambodia (%)
Place of birth for the foreign-born population - Indonesia (%)
Place of birth for the foreign-born population - Laos (%)
Place of birth for the foreign-born population - Malaysia (%)
Place of birth for the foreign-born population - Philippines (%)
Place of birth for the foreign-born population - Singapore (%)
Place of birth for the foreign-born population - Thailand (%)
Place of birth for the foreign-born population - Vietnam (%)
Place of birth for the foreign-born population - Other South Eastern Asia (%)
Place of birth for the foreign-born population - Armenia (%)
Place of birth for the foreign-born population - Iraq (%)
Place of birth for the foreign-born population - Israel (%)
Place of birth for the foreign-born population - Jordan (%)
Place of birth for the foreign-born population - Kuwait (%)
Place of birth for the foreign-born population - Lebanon (%)
Place of birth for the foreign-born population - Saudi Arabia (%)
Place of birth for the foreign-born population - Syria (%)
Place of birth for the foreign-born population - Turkey (%)
Place of birth for the foreign-born population - Yemen (%)
Place of birth for the foreign-born population - Other Western Asia (%)
Place of birth for the foreign-born population - Eritrea (%)
Place of birth for the foreign-born population - Ethiopia (%)
Place of birth for the foreign-born population - Kenya (%)
Place of birth for the foreign-born population - Somalia (%)
Place of birth for the foreign-born population - Uganda (%)
Place of birth for the foreign-born population - Zimbabwe (%)
Place of birth for the foreign-born population - Other Eastern Africa (%)
Place of birth for the foreign-born population - Cameroon (%)
Place of birth for the foreign-born population - Congo (%)
Place of birth for the foreign-born population - Democratic Republic of Congo (Zaire) (%)
Place of birth for the foreign-born population - Other Middle Africa (%)
Place of birth for the foreign-born population - Egypt (%)
Place of birth for the foreign-born population - Morocco (%)
Place of birth for the foreign-born population - Sudan (%)
Place of birth for the foreign-born population - Other Northern Africa (%)
Place of birth for the foreign-born population - South Africa (%)
Place of birth for the foreign-born population - Other Southern Africa (%)
Place of birth for the foreign-born population - Cabo Verde (%)
Place of birth for the foreign-born population - Ghana (%)
Place of birth for the foreign-born population - Liberia (%)
Place of birth for the foreign-born population - Nigeria (%)
Place of birth for the foreign-born population - Senegal (%)
Place of birth for the foreign-born population - Sierra Leone (%)
Place of birth for the foreign-born population - Other Western Africa (%)
Place of birth for the foreign-born population - Australia (%)
Place of birth for the foreign-born population - New Zealand (%)
Place of birth for the foreign-born population - Fiji (%)
Place of birth for the foreign-born population - Micronesia (%)
Place of birth for the foreign-born population - Bahamas (%)
Place of birth for the foreign-born population - Barbados (%)
Place of birth for the foreign-born population - Cuba (%)
Place of birth for the foreign-born population - Dominica (%)
Place of birth for the foreign-born population - Dominican Republic (%)
Place of birth for the foreign-born population - Grenada (%)
Place of birth for the foreign-born population - Haiti (%)
Place of birth for the foreign-born population - Jamaica (%)
Place of birth for the foreign-born population - St. Vincent and the Grenadines (%)
Place of birth for the foreign-born population - Trinidad and Tobago (%)
Place of birth for the foreign-born population - West Indies (%)
Place of birth for the foreign-born population - Other Caribbean (%)
Place of birth for the foreign-born population - Belize (%)
Place of birth for the foreign-born population - Costa Rica (%)
Place of birth for the foreign-born population - El Salvador (%)
Place of birth for the foreign-born population - Guatemala (%)
Place of birth for the foreign-born population - Honduras (%)
Place of birth for the foreign-born population - Mexico (%)
Place of birth for the foreign-born population - Nicaragua (%)
Place of birth for the foreign-born population - Panama (%)
Place of birth for the foreign-born population - Other Central America (%)
Place of birth for the foreign-born population - Argentina (%)
Place of birth for the foreign-born population - Bolivia (%)
Place of birth for the foreign-born population - Brazil (%)
Place of birth for the foreign-born population - Chile (%)
Place of birth for the foreign-born population - Colombia (%)
Place of birth for the foreign-born population - Ecuador (%)
Place of birth for the foreign-born population - Guyana (%)
Place of birth for the foreign-born population - Peru (%)
Place of birth for the foreign-born population - Uruguay (%)
Place of birth for the foreign-born population - Venezuela (%)
Place of birth for the foreign-born population - Other South America (%)
Place of birth for the foreign-born population - Canada (%)
Place of birth for the foreign-born population - Other Northern America (%)
Place of birth for the foreign-born population - Other (%)
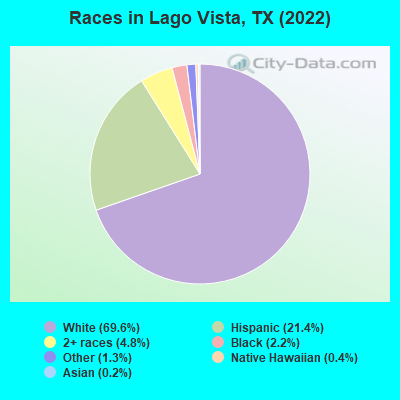
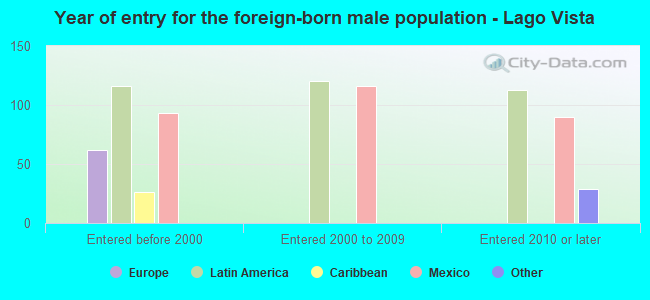
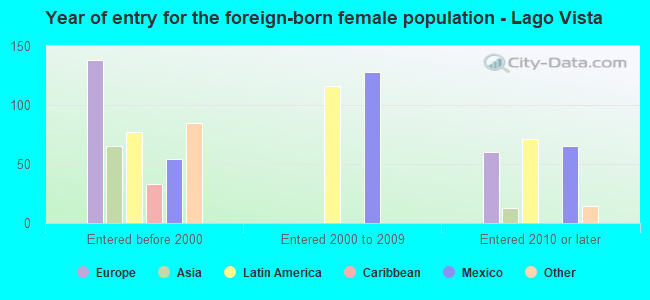
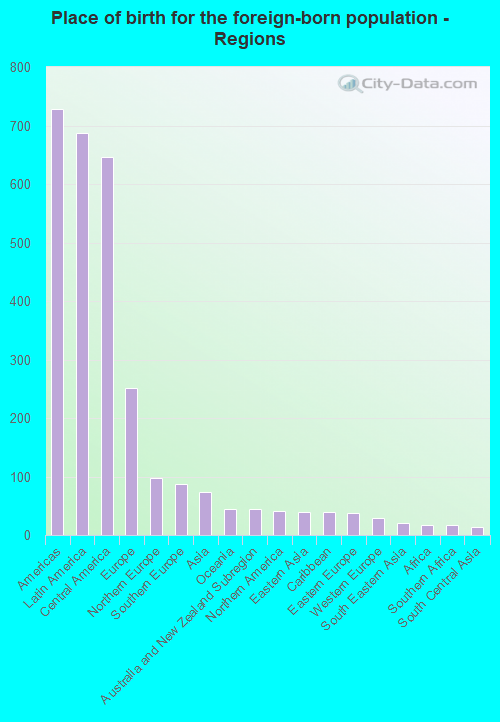
According to 2022 data, the most numerous races in Lago Vista, TX are Hispanic (1,981 residents), White alone (6,444 residents), and Black alone (200 residents). 82.0% of Lago Vista residents speak English at home. 12.1% of Lago Vista, TX residents are foreign-born (7.4% born in Latin America, 2.7% born in Europe), which is 41.0% less than the foreign-born rate of 17.0% across the entire state of Texas.
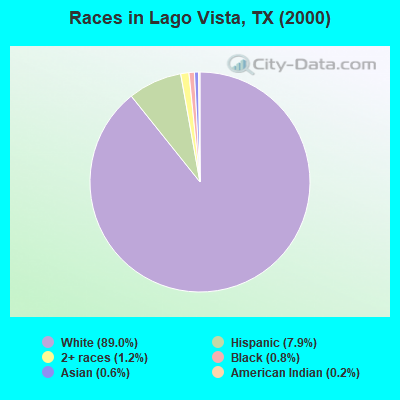
Race distribution in Lago Vista
2000 2022
10,933,313 52.4% White alone 6,669,666 32.0% Hispanic 2,364,255 11.3% Black alone 554,445 2.7% Asian alone 230,567 1.1% Two or more races 68,859 0.3% American Indian alone 19,958 0.10% Other race alone 10,757 0.05% Native Hawaiian and Other
12,070,642 40.2% Hispanic 11,683,430 38.9% White alone 3,508,706 11.7% Black alone 1,608,173 5.4% Asian alone 956,560 3.2% Two or more races 125,763 0.4% Other race alone 47,023 0.2% American Indian alone 29,275 0.10% Native Hawaiian and Other
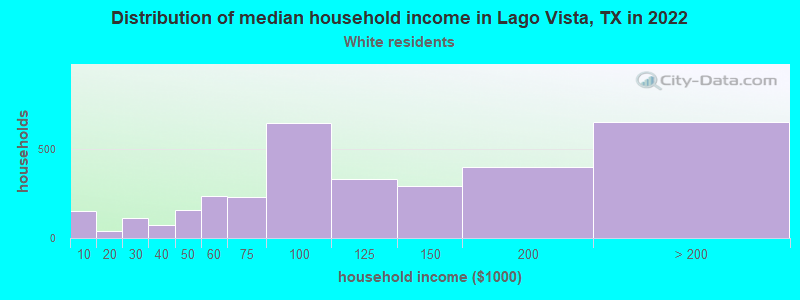
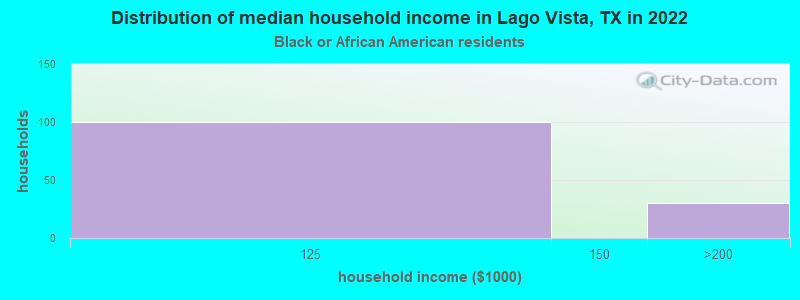
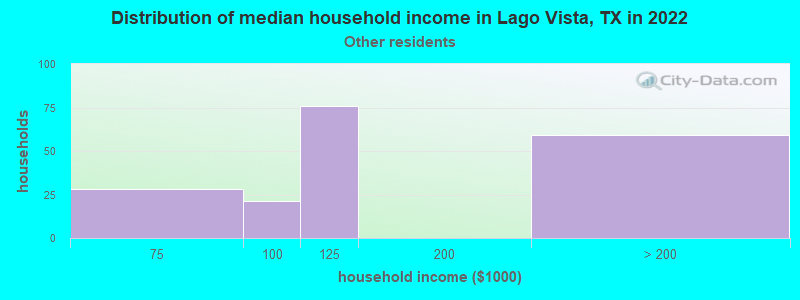
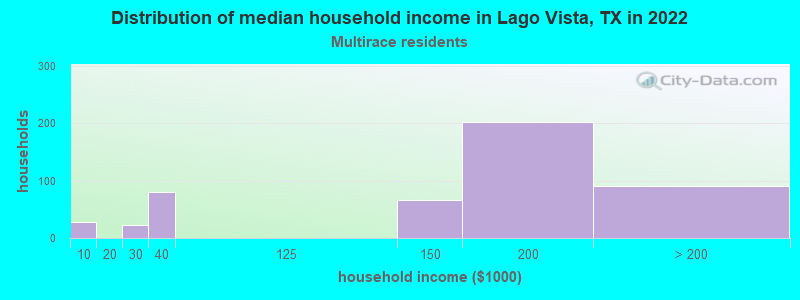
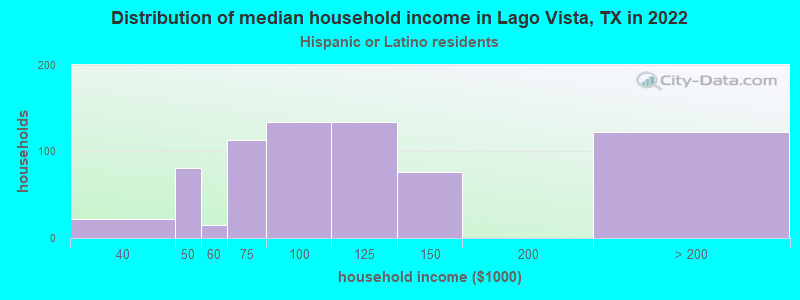
Income and house value in Lago Vista Median household income in 2022 $106,747 White non-Hispanic householders$112,715 Some other race householders$143,327 Two or more races householders$96,904 Hispanic or Latino race householdersMedian 2022 house value $491,737 White Non-Hispanic householders$711,127 Black or African American householders$434,654 Two or more races householders$504,460 Hispanic or Latino householders
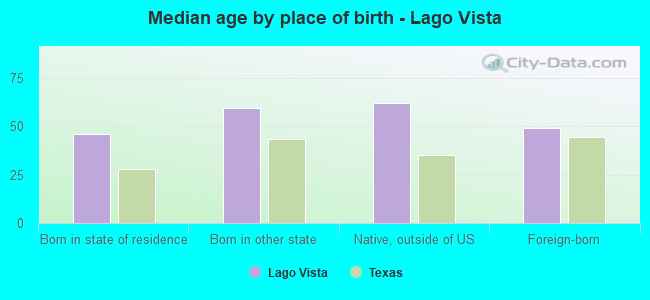
Median age by race in Lago Vista
58.2 Median age for White residents56.8 60.9 51.0 Median age for Black or African American residents57.4 -636,704,119.2 -779,116,465.1 Median age for American Indian / Alaska Native residents-793,749,999.2 -794,946,549.3 -674,532,939.3 Median age for Asian residents-660,696,516.8 -682,125,603.2 -749,403,340.5 Median age for Native Hawaiian / Pacific Islander residents-751,851,851.1 -643,584,520.7 48.4 Median age for Other race residents14.1 51.4 34.5 Median age for Two or more races residents23.8 42.9 59.9 Median age for White alone residents57.9 61.7 39.6 Median age for Hispanic or Latino residents12.0 43.9
Owner/renter occupied households by race in Lago Vista
House owners and renters - White residents 2,839 86.2% Owner occupied455 13.8% Renter occupiedHouse owners and renters - Black or African American residents 102 100.0% Owner occupiedHouse owners and renters - Other race residents 169 100.0% Owner occupiedHouse owners and renters - Two or more races residents 394 83.2% Owner occupied80 16.8% Renter occupiedHouse owners and renters - White alone residents 2,726 86.7% Owner occupied420 13.3% Renter occupiedHouse owners and renters - Hispanic or Latino residents 596 87.3% Owner occupied87 12.7% Renter occupied
Language usage in Lago Vista
English speakers - Total 82.0% of residents of Lago Vista speak English at home.
16.4% of residents speak Spanish at home 829 55.9% Speak English very well653 44.1% Speak English less than very well1.4% of residents speak other language at home 81 64.3% Speak English very well45 35.7% Speak English less than very well
English speakers - Born in the United States 96.1% of residents of Lago Vista speak English at home.
3.3% of residents speak Spanish at home 125 100.0% Speak English very well0.5% of residents speak other language at home 18 100.0% Speak English less than very well
English speakers - Native, born elsewhere 50.4% of residents of Lago Vista speak English at home.
46.0% of residents speak Spanish at home 52 100.0% Speak English very well
English speakers - Foreign-born 27.1% of residents of Lago Vista speak English at home.
63.8% of residents speak Spanish at home 195 27.6% Speak English very well512 72.4% Speak English less than very well8.1% of residents speak other language at home 64 71.1% Speak English very well26 28.9% Speak English less than very well
White (Caucasian) - Speak only English Native:
94.7% (5,912)Foreign-born:
47.8% (207)
White (Caucasian) - Speak another language Native:
6.1% (383)Foreign-born:
58.5% (254)
Two or more races - Speak only English Native:
83.7% (675)Foreign-born:
5.1% (33)
Two or more races - Speak another language Native:
5.6% (46)Foreign-born:
95.3% (616)
White alone - Speak only English Native:
98.2% (5,939)Foreign-born:
69.5% (230)
White alone - Speak another language Native:
2.0% (119)Foreign-born:
27.7% (91)
Hispanic or Latino - Speak only English Native:
38.7% (433)Foreign-born:
2.0% (14)
Hispanic or Latino - Speak another language Native:
60.7% (678)Foreign-born:
97.9% (702)
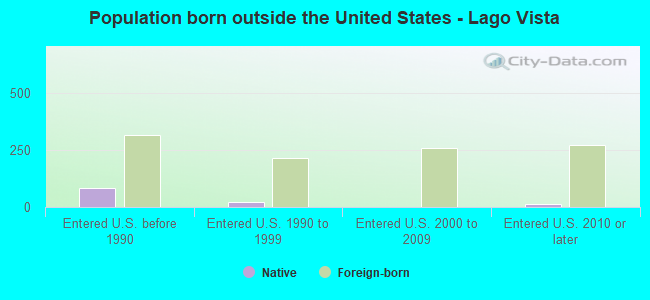
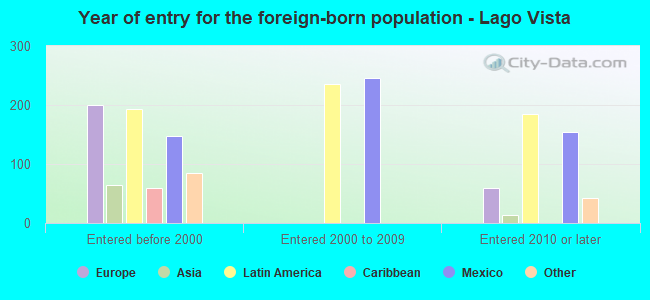
Foreign-born residents in Lago Vista 1,117 residents are foreign born (7.4% Latin America , 2.7% Europe ).
This city:
12.1%Texas:
17.1%
Marital status for residents in Lago Vista Marital status - White (Caucasian) population 15 years and over
Males 17.5% Never married68.4% Now married2.1% Separated2.9% Widowed9.2% DivorcedFemales 8.9% Never married67.0% Now married2.9% Separated9.4% Widowed11.8% DivorcedWomen who gave birth in the past 12 months Now married:
100.0% (81)Unmarried:
0.0% (0)
Women who did not give birth in the past 12 months Now married:
61.8% (492)Unmarried:
38.2% (303)
Marital status - Black or African American population 15 years and over
Males 14.1% Never married40.3% Now married0.0% Separated0.0% Widowed45.6% DivorcedFemales 100.0% Never married0.0% Now married0.0% Separated0.0% Widowed0.0% DivorcedWomen who did not give birth in the past 12 months Now married:
0.0% (0)Unmarried:
100.0% (28)
Marital status - Other race population 15 years and over
Males 0.0% Never married100.0% Now married0.0% Separated0.0% Widowed0.0% DivorcedFemales 0.0% Never married66.5% Now married0.0% Separated14.8% Widowed18.8% DivorcedWomen who gave birth in the past 12 months Now married:
100.0% (16)Unmarried:
0.0% (0)
Women who did not give birth in the past 12 months Now married:
100.0% (60)Unmarried:
0.0% (0)
Marital status - Two or more races population 15 years and over
Males 52.5% Never married41.7% Now married0.0% Separated0.0% Widowed5.8% DivorcedFemales 28.5% Never married67.9% Now married0.0% Separated0.0% Widowed3.6% DivorcedWomen who did not give birth in the past 12 months Now married:
66.3% (343)Unmarried:
33.7% (174)
Marital status - White alone, not Hispanic / Latino population 15 years and over
Males 18.7% Never married68.7% Now married0.3% Separated2.3% Widowed10.0% DivorcedFemales 7.6% Never married65.8% Now married3.4% Separated11.2% Widowed12.0% DivorcedWomen who gave birth in the past 12 months Now married:
100.0% (13)Unmarried:
0.0% (0)
Women who did not give birth in the past 12 months Now married:
70.9% (510)Unmarried:
29.1% (210)
Marital status - Hispanic or Latino population 15 years and over
Males 11.3% Never married67.6% Now married14.9% Separated6.3% Widowed0.0% DivorcedFemales 17.0% Never married69.8% Now married0.0% Separated3.0% Widowed10.2% DivorcedWomen who gave birth in the past 12 months Now married:
100.0% (95)Unmarried:
0.0% (0)
Women who did not give birth in the past 12 months Now married:
46.6% (184)Unmarried:
53.4% (210)
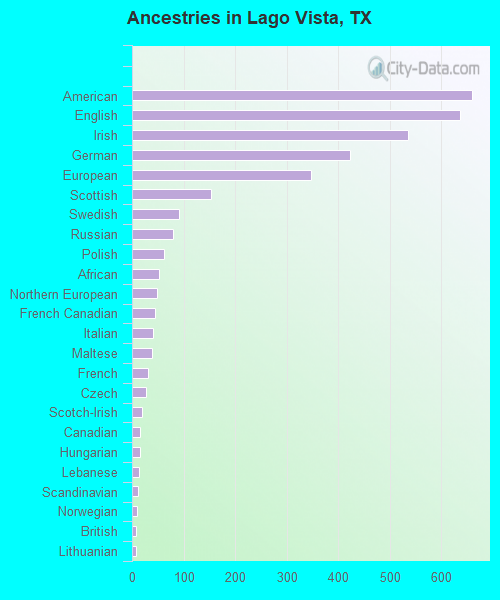
Ancestries in Lago Vista
660 12.3% American636 11.9% English536 10.0% Irish424 7.9% German348 6.5% European154 2.9% Scottish91 1.7% Swedish80 1.5% Russian63 1.2% Polish52 1.0% African49 0.9% Northern European44 0.8% French Canadian40 0.7% Italian38 0.7% Maltese32 0.6% French27 0.5% Czech20 0.4% Scotch-Irish15 0.3% Canadian15 0.3% Hungarian14 0.3% Lebanese11 0.2% Scandinavian10 0.2% Norwegian8 0.1% British8 0.1% Lithuanian
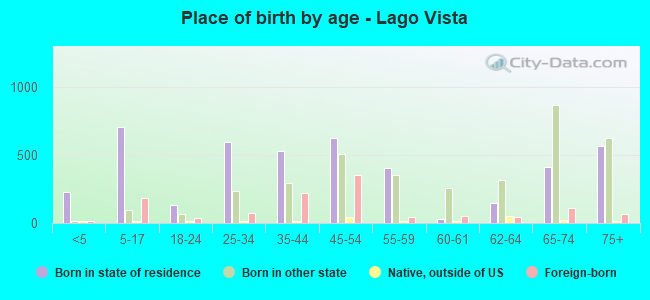
Children Nativity (place of birth) in Lago Vista
Children under 6 years - Living with two parents Both parents native 233 100.0% NativeOne native, one foreign-born parent 126 100.0% NativeChildren under 6 years - Living with one parent Native parent 10 100.0% NativeChildren 6 to 17 years - Living with two parents Both parents native 439 100.0% NativeBoth parents foreign-born 13 6.6% Native187 93.4% Foreign-bornOne native, one foreign-born parent 58 100.0% NativeChildren 6 to 17 years - Living with one parent Native parent 38 100.0% NativeForeign-born parent 92 56.0% Native73 44.0% Foreign-born
Grandparents responsible for own grandchildren in Lago Vista
Grandparents (30 to 59 years) White / Caucasian 39 55.9% Responsible for grandchildren31 44.1% Not responsible for grandchildrenHispanic or Latino 64 60.0% Responsible for grandchildren43 40.0% Not responsible for grandchildren
Grandparents (60 years and over)