Races in Lackawanna, New York (NY) Detailed Stats
Data:
Races - White alone (%)
Races - White alone (% change since 2000)
Races - Black alone (%)
Races - Black alone (% change since 2000)
Races - American Indian alone (%)
Races - American Indian alone (% change since 2000)
Races - Asian alone (%)
Races - Asian alone (% change since 2000)
Races - Hispanic (%)
Races - Hispanic (% change since 2000)
Races - Native Hawaiian and Other Pacific Islander alone (%)
Races - Native Hawaiian and Other Pacific Islander alone (% change since 2000)
Races - Two or more races(%)
Races - Two or more races(% change since 2000)
Races - Other race alone (%)
Races - Other race alone (% change since 2000)
Racial diversity
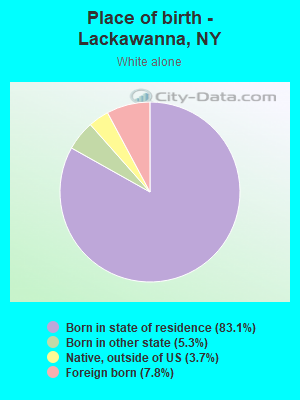
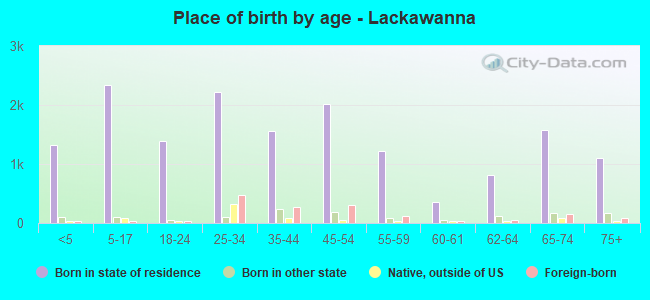
Place of birth - Born in state of residence (%)
Place of birth - Born in state of residence (%) - White
Place of birth - Born in state of residence (%) - Black or African American
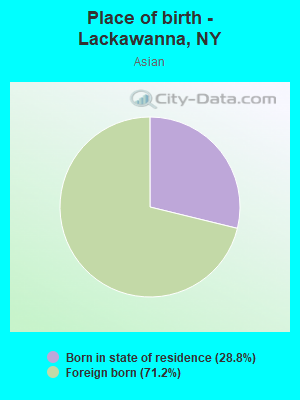
Place of birth - Born in state of residence (%) - Asian
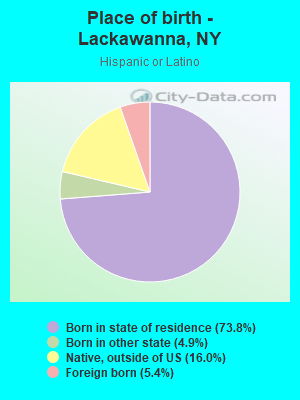
Place of birth - Born in state of residence (%) - Hispanic or Latino
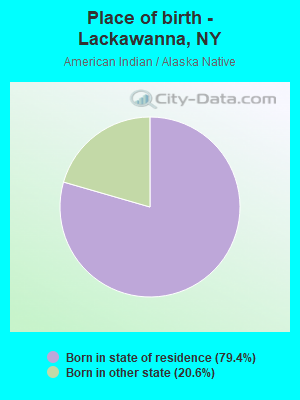
Place of birth - Born in state of residence (%) - American Indian and Alaska Native
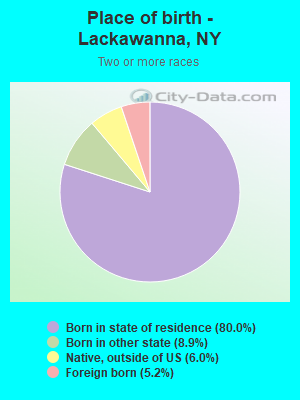
Place of birth - Born in state of residence (%) - Multirace
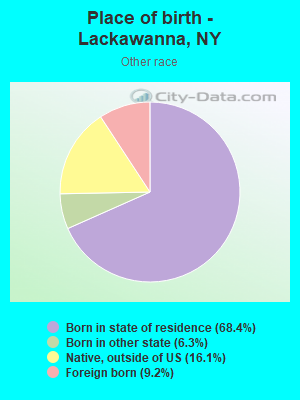
Place of birth - Born in state of residence (%) - Other Race
Place of birth - Born in other state (%)
Place of birth - Born in other state (%) - White
Place of birth - Born in other state (%) - Black or African American
Place of birth - Born in other state (%) - Asian
Place of birth - Born in other state (%) - Hispanic or Latino
Place of birth - Born in other state (%) - American Indian and Alaska Native
Place of birth - Born in other state (%) - Multirace
Place of birth - Born in other state (%) - Other Race
Place of birth - Native, outside of US (%)
Place of birth - Native, outside of US (%) - White
Place of birth - Native, outside of US (%) - Black or African American
Place of birth - Native, outside of US (%) - Asian
Place of birth - Native, outside of US (%) - Hispanic or Latino
Place of birth - Native, outside of US (%) - American Indian and Alaska Native
Place of birth - Native, outside of US (%) - Multirace
Place of birth - Native, outside of US (%) - Other Race
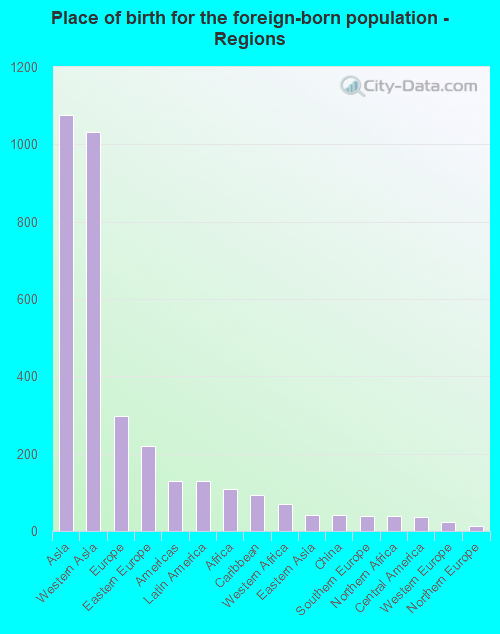
Place of birth - Foreign born (%)
Place of birth - Foreign born (%) - White
Place of birth - Foreign born (%) - Black or African American
Place of birth - Foreign born (%) - Asian
Place of birth - Foreign born (%) - Hispanic or Latino
Place of birth - Foreign born (%) - American Indian and Alaska Native
Place of birth - Foreign born (%) - Multirace
Place of birth - Foreign born (%) - Other Race
Residents speaking English at home (%)
Residents speaking English at home - Born in the United States (%)
Residents speaking English at home - Native, born elsewhere (%)
Residents speaking English at home - Foreign born (%)
Residents speaking Spanish at home (%)
Residents speaking Spanish at home - Born in the United States (%)
Residents speaking Spanish at home - Native, born elsewhere (%)
Residents speaking Spanish at home - Foreign born (%)
Residents speaking other language at home (%)
Residents speaking other language at home - Born in the United States (%)
Residents speaking other language at home - Native, born elsewhere (%)
Residents speaking other language at home - Foreign born (%)
Marital status - Never married (%)
Marital status - Now married (%)
Marital status - Separated (%)
Marital status - Widowed (%)
Marital status - Divorced (%)
Ancestries Reported - Arab (%)
Ancestries Reported - Czech (%)
Ancestries Reported - Danish (%)
Ancestries Reported - Dutch (%)
Ancestries Reported - English (%)
Ancestries Reported - French (%)
Ancestries Reported - French Canadian (%)
Ancestries Reported - German (%)
Ancestries Reported - Greek (%)
Ancestries Reported - Hungarian (%)
Ancestries Reported - Irish (%)
Ancestries Reported - Italian (%)
Ancestries Reported - Lithuanian (%)
Ancestries Reported - Norwegian (%)
Ancestries Reported - Polish (%)
Ancestries Reported - Portuguese (%)
Ancestries Reported - Russian (%)
Ancestries Reported - Scotch-Irish (%)
Ancestries Reported - Scottish (%)
Ancestries Reported - Slovak (%)
Ancestries Reported - Subsaharan African (%)
Ancestries Reported - Swedish (%)
Ancestries Reported - Swiss (%)
Ancestries Reported - Ukrainian (%)
Ancestries Reported - United States (%)
Ancestries Reported - Welsh (%)
Ancestries Reported - West Indian (%)
Ancestries Reported - Other (%)
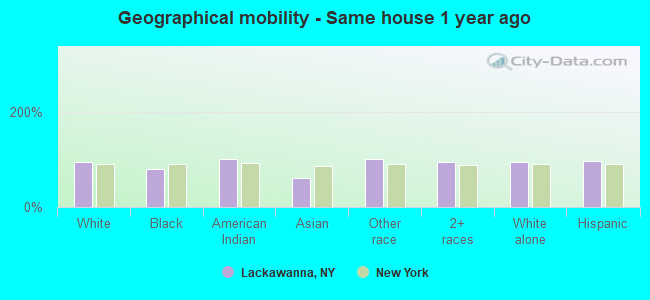
Geographical mobility - Same house 1 year ago (%)
Geographical mobility - Same house 1 year ago (%) - White
Geographical mobility - Same house 1 year ago (%) - Black or African American
Geographical mobility - Same house 1 year ago (%) - Asian
Geographical mobility - Same house 1 year ago (%) - Hispanic or Latino
Geographical mobility - Same house 1 year ago (%) - American Indian and Alaska Native
Geographical mobility - Same house 1 year ago (%) - Multirace
Geographical mobility - Same house 1 year ago (%) - Other Race
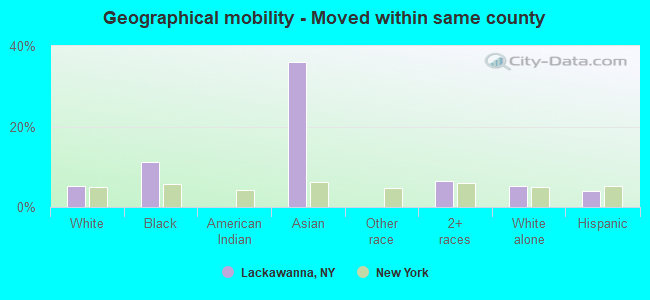
Geographical mobility - Moved within same county (%)
Geographical mobility - Moved within same county (%) - White
Geographical mobility - Moved within same county (%) - Black or African American
Geographical mobility - Moved within same county (%) - Asian
Geographical mobility - Moved within same county (%) - Hispanic or Latino
Geographical mobility - Moved within same county (%) - American Indian and Alaska Native
Geographical mobility - Moved within same county (%) - Multirace
Geographical mobility - Moved within same county (%) - Other Race
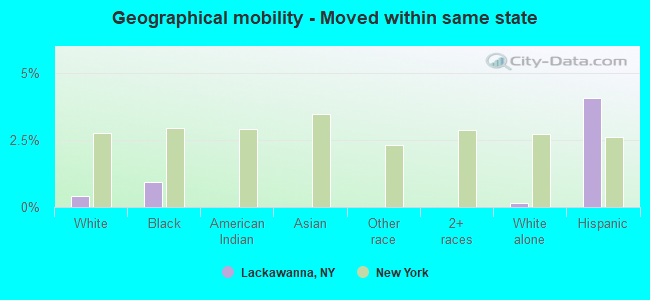
Geographical mobility - Moved from different county within same state (%)
Geographical mobility - Moved from different county within same state (%) - White
Geographical mobility - Moved from different county within same state (%) - Black or African American
Geographical mobility - Moved from different county within same state (%) - Asian
Geographical mobility - Moved from different county within same state (%) - Hispanic or Latino
Geographical mobility - Moved from different county within same state (%) - American Indian and Alaska Native
Geographical mobility - Moved from different county within same state (%) - Multirace
Geographical mobility - Moved from different county within same state (%) - Other Race
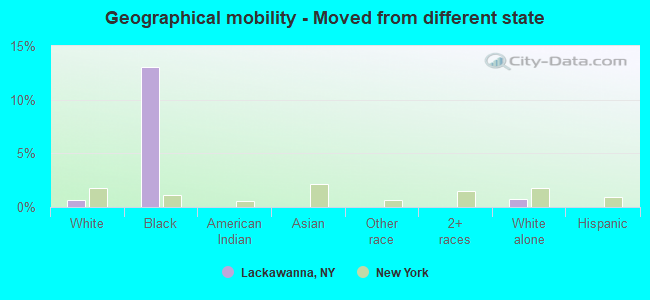
Geographical mobility - Moved from different state (%)
Geographical mobility - Moved from different state (%) - White
Geographical mobility - Moved from different state (%) - Black or African American
Geographical mobility - Moved from different state (%) - Asian
Geographical mobility - Moved from different state (%) - Hispanic or Latino
Geographical mobility - Moved from different state (%) - American Indian and Alaska Native
Geographical mobility - Moved from different state (%) - Multirace
Geographical mobility - Moved from different state (%) - Other Race
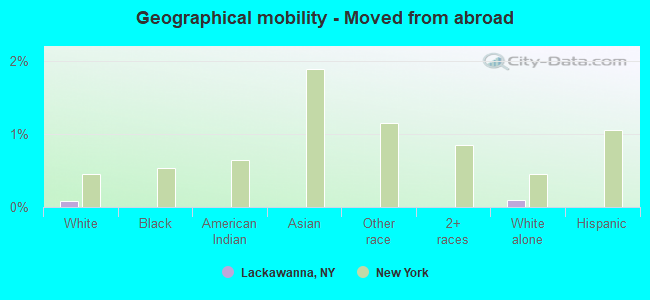
Geographical mobility - Moved from abroad (%)
Geographical mobility - Moved from abroad (%) - White
Geographical mobility - Moved from abroad (%) - Black or African American
Geographical mobility - Moved from abroad (%) - Asian
Geographical mobility - Moved from abroad (%) - Hispanic or Latino
Geographical mobility - Moved from abroad (%) - American Indian and Alaska Native
Geographical mobility - Moved from abroad (%) - Multirace
Geographical mobility - Moved from abroad (%) - Other Race
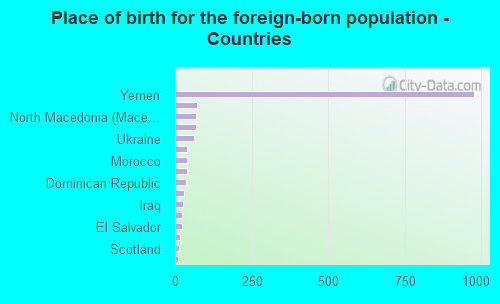
Place of birth for the foreign-born population - Ireland (%)
Place of birth for the foreign-born population - Denmark (%)
Place of birth for the foreign-born population - Norway (%)
Place of birth for the foreign-born population - Sweden (%)
Place of birth for the foreign-born population - United Kingdom (%)
Place of birth for the foreign-born population - England (%)
Place of birth for the foreign-born population - Scotland (%)
Place of birth for the foreign-born population - Other Northern Europe (%)
Place of birth for the foreign-born population - Austria (%)
Place of birth for the foreign-born population - Belgium (%)
Place of birth for the foreign-born population - France (%)
Place of birth for the foreign-born population - Germany (%)
Place of birth for the foreign-born population - Netherlands (%)
Place of birth for the foreign-born population - Switzerland (%)
Place of birth for the foreign-born population - Other Western Europe (%)
Place of birth for the foreign-born population - Greece (%)
Place of birth for the foreign-born population - Italy (%)
Place of birth for the foreign-born population - Portugal (%)
Place of birth for the foreign-born population - Spain (%)
Place of birth for the foreign-born population - Other Southern Europe (%)
Place of birth for the foreign-born population - Albania (%)
Place of birth for the foreign-born population - Belarus (%)
Place of birth for the foreign-born population - Bosnia and Herzegovina (%)
Place of birth for the foreign-born population - Bulgaria (%)
Place of birth for the foreign-born population - Croatia (%)
Place of birth for the foreign-born population - Czechoslovakia (%)
Place of birth for the foreign-born population - Hungary (%)
Place of birth for the foreign-born population - Latvia (%)
Place of birth for the foreign-born population - Lithuania (%)
Place of birth for the foreign-born population - North Macedonia (Macedonia) (%)
Place of birth for the foreign-born population - Moldova (%)
Place of birth for the foreign-born population - Poland (%)
Place of birth for the foreign-born population - Romania (%)
Place of birth for the foreign-born population - Russia (%)
Place of birth for the foreign-born population - Serbia (%)
Place of birth for the foreign-born population - Ukraine (%)
Place of birth for the foreign-born population - Other Eastern Europe (%)
Place of birth for the foreign-born population - China (%)
Place of birth for the foreign-born population - Hong Kong (%)
Place of birth for the foreign-born population - Taiwan (%)
Place of birth for the foreign-born population - Japan (%)
Place of birth for the foreign-born population - Korea (%)
Place of birth for the foreign-born population - Other Eastern Asia (%)
Place of birth for the foreign-born population - Afghanistan (%)
Place of birth for the foreign-born population - Bangladesh (%)
Place of birth for the foreign-born population - India (%)
Place of birth for the foreign-born population - Iran (%)
Place of birth for the foreign-born population - Kazakhstan (%)
Place of birth for the foreign-born population - Nepal (%)
Place of birth for the foreign-born population - Pakistan (%)
Place of birth for the foreign-born population - Sri Lanka (%)
Place of birth for the foreign-born population - Uzbekistan (%)
Place of birth for the foreign-born population - Other South Central Asia (%)
Place of birth for the foreign-born population - Burma (%)
Place of birth for the foreign-born population - Cambodia (%)
Place of birth for the foreign-born population - Indonesia (%)
Place of birth for the foreign-born population - Laos (%)
Place of birth for the foreign-born population - Malaysia (%)
Place of birth for the foreign-born population - Philippines (%)
Place of birth for the foreign-born population - Singapore (%)
Place of birth for the foreign-born population - Thailand (%)
Place of birth for the foreign-born population - Vietnam (%)
Place of birth for the foreign-born population - Other South Eastern Asia (%)
Place of birth for the foreign-born population - Armenia (%)
Place of birth for the foreign-born population - Iraq (%)
Place of birth for the foreign-born population - Israel (%)
Place of birth for the foreign-born population - Jordan (%)
Place of birth for the foreign-born population - Kuwait (%)
Place of birth for the foreign-born population - Lebanon (%)
Place of birth for the foreign-born population - Saudi Arabia (%)
Place of birth for the foreign-born population - Syria (%)
Place of birth for the foreign-born population - Turkey (%)
Place of birth for the foreign-born population - Yemen (%)
Place of birth for the foreign-born population - Other Western Asia (%)
Place of birth for the foreign-born population - Eritrea (%)
Place of birth for the foreign-born population - Ethiopia (%)
Place of birth for the foreign-born population - Kenya (%)
Place of birth for the foreign-born population - Somalia (%)
Place of birth for the foreign-born population - Uganda (%)
Place of birth for the foreign-born population - Zimbabwe (%)
Place of birth for the foreign-born population - Other Eastern Africa (%)
Place of birth for the foreign-born population - Cameroon (%)
Place of birth for the foreign-born population - Congo (%)
Place of birth for the foreign-born population - Democratic Republic of Congo (Zaire) (%)
Place of birth for the foreign-born population - Other Middle Africa (%)
Place of birth for the foreign-born population - Egypt (%)
Place of birth for the foreign-born population - Morocco (%)
Place of birth for the foreign-born population - Sudan (%)
Place of birth for the foreign-born population - Other Northern Africa (%)
Place of birth for the foreign-born population - South Africa (%)
Place of birth for the foreign-born population - Other Southern Africa (%)
Place of birth for the foreign-born population - Cabo Verde (%)
Place of birth for the foreign-born population - Ghana (%)
Place of birth for the foreign-born population - Liberia (%)
Place of birth for the foreign-born population - Nigeria (%)
Place of birth for the foreign-born population - Senegal (%)
Place of birth for the foreign-born population - Sierra Leone (%)
Place of birth for the foreign-born population - Other Western Africa (%)
Place of birth for the foreign-born population - Australia (%)
Place of birth for the foreign-born population - New Zealand (%)
Place of birth for the foreign-born population - Fiji (%)
Place of birth for the foreign-born population - Micronesia (%)
Place of birth for the foreign-born population - Bahamas (%)
Place of birth for the foreign-born population - Barbados (%)
Place of birth for the foreign-born population - Cuba (%)
Place of birth for the foreign-born population - Dominica (%)
Place of birth for the foreign-born population - Dominican Republic (%)
Place of birth for the foreign-born population - Grenada (%)
Place of birth for the foreign-born population - Haiti (%)
Place of birth for the foreign-born population - Jamaica (%)
Place of birth for the foreign-born population - St. Vincent and the Grenadines (%)
Place of birth for the foreign-born population - Trinidad and Tobago (%)
Place of birth for the foreign-born population - West Indies (%)
Place of birth for the foreign-born population - Other Caribbean (%)
Place of birth for the foreign-born population - Belize (%)
Place of birth for the foreign-born population - Costa Rica (%)
Place of birth for the foreign-born population - El Salvador (%)
Place of birth for the foreign-born population - Guatemala (%)
Place of birth for the foreign-born population - Honduras (%)
Place of birth for the foreign-born population - Mexico (%)
Place of birth for the foreign-born population - Nicaragua (%)
Place of birth for the foreign-born population - Panama (%)
Place of birth for the foreign-born population - Other Central America (%)
Place of birth for the foreign-born population - Argentina (%)
Place of birth for the foreign-born population - Bolivia (%)
Place of birth for the foreign-born population - Brazil (%)
Place of birth for the foreign-born population - Chile (%)
Place of birth for the foreign-born population - Colombia (%)
Place of birth for the foreign-born population - Ecuador (%)
Place of birth for the foreign-born population - Guyana (%)
Place of birth for the foreign-born population - Peru (%)
Place of birth for the foreign-born population - Uruguay (%)
Place of birth for the foreign-born population - Venezuela (%)
Place of birth for the foreign-born population - Other South America (%)
Place of birth for the foreign-born population - Canada (%)
Place of birth for the foreign-born population - Other Northern America (%)
Place of birth for the foreign-born population - Other (%)
Latest news about races in Lackawanna, NY collected exclusively by city-data.com from local newspapers, TV, and radio stations
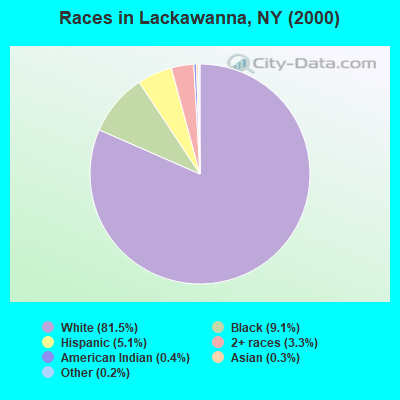
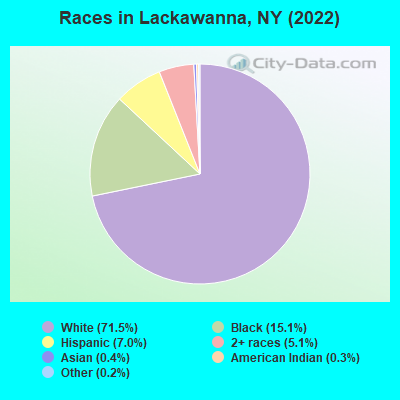
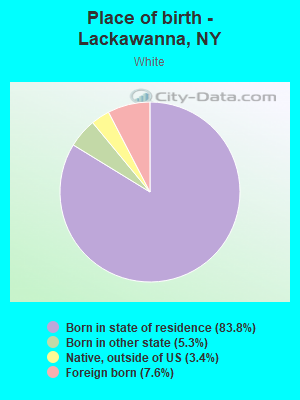
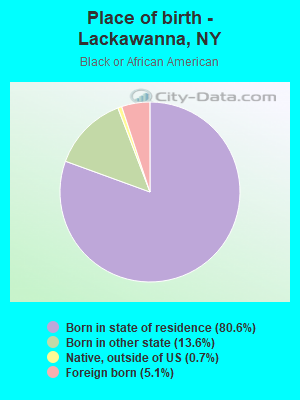
According to 2022 data, the most numerous races in Lackawanna, NY are White alone (14,122 residents), Hispanic (1,373 residents), and Black alone (2,974 residents). 79.5% of Lackawanna residents speak English at home. 8.2% of Lackawanna, NY residents are foreign-born (5.5% born in Asia, 1.5% born in Europe), which is 169.3% less than the foreign-born rate of 22.0% across the entire state of New York.
Race distribution in Lackawanna
2000 2022
11,760,981 62.0% White alone 2,867,583 15.1% Hispanic 2,812,623 14.8% Black alone 1,035,926 5.5% Asian alone 366,116 1.9% Two or more races 75,499 0.4% Other race alone 52,499 0.3% American Indian alone 5,230 0.03% Native Hawaiian and Other
10,408,933 52.9% White alone 3,867,299 19.7% Hispanic 2,633,840 13.4% Black alone 1,776,286 9.0% Asian alone 732,670 3.7% Two or more races 216,110 1.1% Other race alone 35,082 0.2% American Indian alone 6,931 0.04% Native Hawaiian and Other
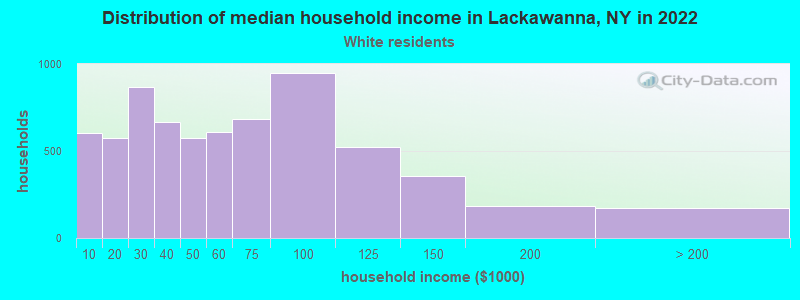
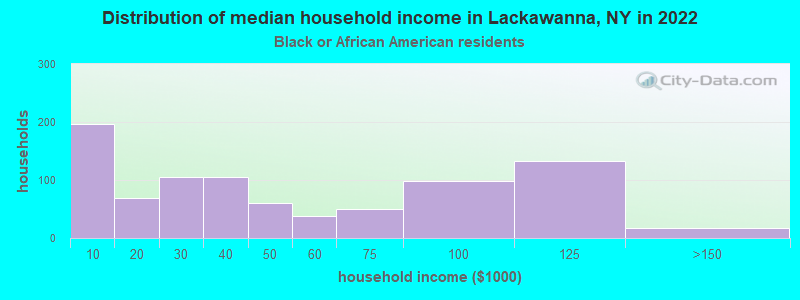
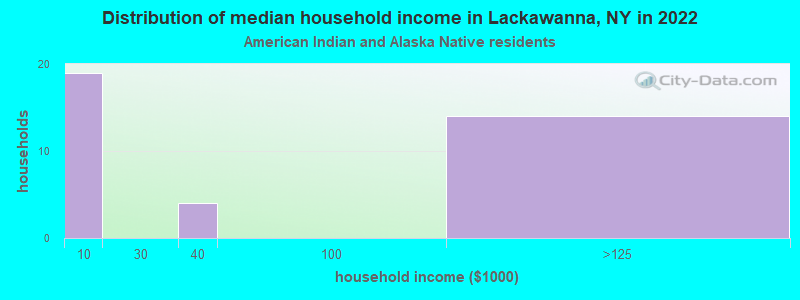
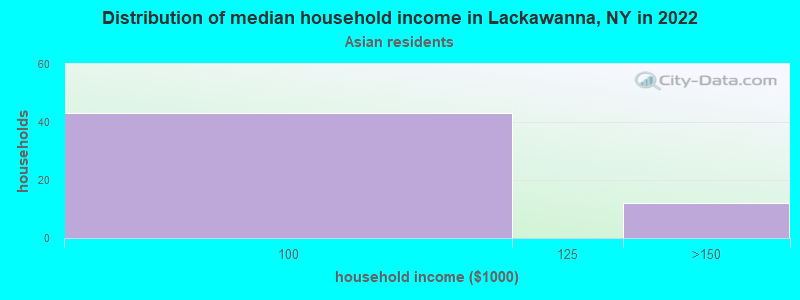
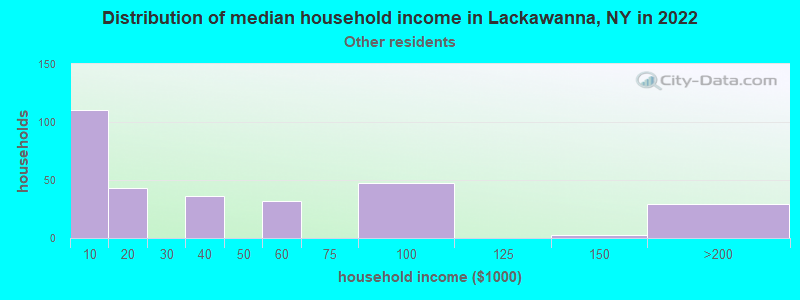
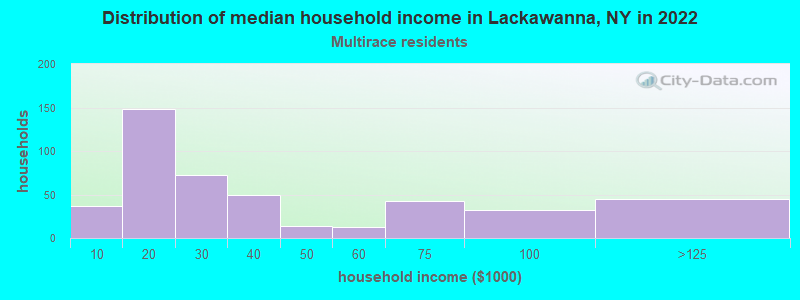
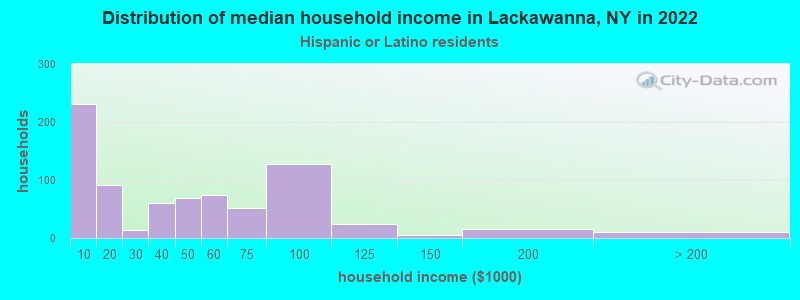
Income and house value in Lackawanna Median household income in 2022 $52,070 White non-Hispanic householders$30,687 Black householders$34,626 Two or more races householders$40,691 Hispanic or Latino race householdersMedian 2022 house value $138,415 White Non-Hispanic householders$61,869 Black or African American householders$120,765 American Indian or Alaska Native householders$88,251 Some other race householders$125,596 Hispanic or Latino householders
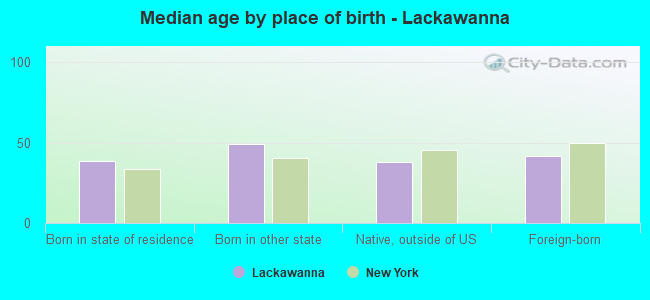
Median age by race in Lackawanna
45.8 Median age for White residents42.4 47.5 29.4 Median age for Black or African American residents29.0 29.6 23.9 Median age for American Indian / Alaska Native residents-364,583,333.0 24.7 33.0 Median age for Asian residents35.1 32.9 -700,534,758.7 Median age for Native Hawaiian / Pacific Islander residents-477,502,295.2 -497,387,669.3 33.8 Median age for Other race residents40.7 32.2 20.4 Median age for Two or more races residents26.5 18.7 46.4 Median age for White alone residents43.6 47.9 34.0 Median age for Hispanic or Latino residents36.2 32.1
Owner/renter occupied households by race in Lackawanna
House owners and renters - White residents 4,196 61.4% Owner occupied2,634 38.6% Renter occupiedHouse owners and renters - Black or African American residents 419 43.5% Owner occupied545 56.5% Renter occupiedHouse owners and renters - American Indian / Alaska Native residents 12 45.8% Owner occupied14 54.2% Renter occupiedHouse owners and renters - Asian residents 48 100.0% Renter occupiedHouse owners and renters - Other race residents 58 18.0% Owner occupied267 82.0% Renter occupiedHouse owners and renters - Two or more races residents 154 32.3% Owner occupied323 67.7% Renter occupiedHouse owners and renters - White alone residents 4,119 62.0% Owner occupied2,530 38.0% Renter occupiedHouse owners and renters - Hispanic or Latino residents 196 26.5% Owner occupied542 73.5% Renter occupied
Language usage in Lackawanna
English speakers - Total 79.5% of residents of Lackawanna speak English at home.
4.1% of residents speak Spanish at home 610 81.9% Speak English very well135 18.1% Speak English less than very well16.7% of residents speak other language at home 1,767 57.8% Speak English very well1,292 42.2% Speak English less than very well
English speakers - Born in the United States 90.5% of residents of Lackawanna speak English at home.
3.3% of residents speak Spanish at home 42 100.0% Speak English very well5.6% of residents speak other language at home 43 59.7% Speak English very well29 40.3% Speak English less than very well
English speakers - Native, born elsewhere 19.1% of residents of Lackawanna speak English at home.
28.9% of residents speak Spanish at home 149 68.7% Speak English very well68 31.3% Speak English less than very well52.7% of residents speak other language at home 268 67.8% Speak English very well127 32.2% Speak English less than very well
English speakers - Foreign-born 7.6% of residents of Lackawanna speak English at home.
4.6% of residents speak Spanish at home 30 41.7% Speak English very well42 58.3% Speak English less than very well93.1% of residents speak other language at home 421 29.1% Speak English very well1,026 70.9% Speak English less than very well
White (Caucasian) - Speak only English Native:
87.8% (11,041)Foreign-born:
9.6% (103)
White (Caucasian) - Speak another language Native:
10.8% (1,360)Foreign-born:
97.9% (1,051)
Black or African American - Speak only English Native:
98.9% (2,384)Foreign-born:
8.0% (12)
Black or African American - Speak another language Native:
0.8% (19)Foreign-born:
100.0% (155)
Asian - Speak another language Native:
100.0% (37)Foreign-born:
100.0% (85)
Other race - Speak another language Native:
65.3% (325)Foreign-born:
91.7% (47)
Two or more races - Speak another language Native:
23.9% (283)Foreign-born:
94.4% (74)
White alone - Speak only English Native:
88.3% (10,839)Foreign-born:
9.9% (107)
White alone - Speak another language Native:
11.9% (1,457)Foreign-born:
97.2% (1,056)
Hispanic or Latino - Speak another language Native:
47.2% (577)Foreign-born:
100.0% (76)
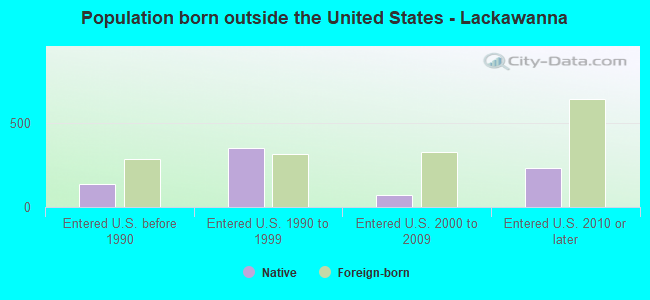
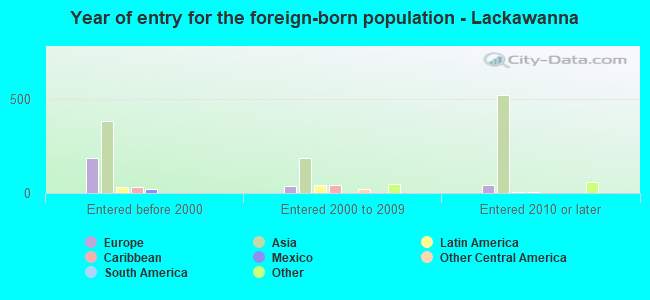
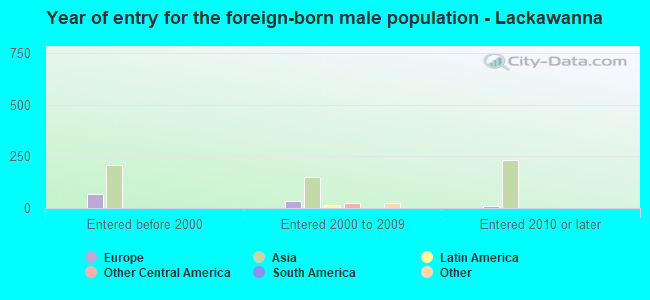
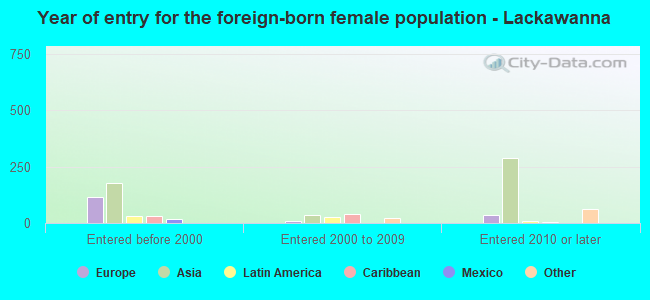
Foreign-born residents in Lackawanna 1,613 residents are foreign born (5.5% Asia , 1.5% Europe ).
This city:
8.2%New York:
22.6%
Marital status for residents in Lackawanna Marital status - White (Caucasian) population 15 years and over
Males 39.9% Never married39.8% Now married1.0% Separated3.5% Widowed15.8% DivorcedFemales 32.2% Never married37.5% Now married1.4% Separated11.9% Widowed17.0% DivorcedWomen who gave birth in the past 12 months Now married:
42.2% (66)Unmarried:
57.8% (90)
Women who did not give birth in the past 12 months Now married:
39.0% (1,126)Unmarried:
61.0% (1,764)
Marital status - Black or African American population 15 years and over
Males 51.2% Never married23.8% Now married10.1% Separated0.0% Widowed14.9% DivorcedFemales 62.2% Never married21.8% Now married4.8% Separated4.3% Widowed6.8% DivorcedWomen who gave birth in the past 12 months Now married:
100.0% (58)Unmarried:
0.0% (0)
Women who did not give birth in the past 12 months Now married:
11.8% (79)Unmarried:
88.2% (592)
Marital status - Asian population 15 years and over
Males 0.0% Never married100.0% Now married0.0% Separated0.0% Widowed0.0% DivorcedFemales 18.7% Never married34.7% Now married0.0% Separated0.0% Widowed46.7% DivorcedWomen who did not give birth in the past 12 months Now married:
23.4% (17)Unmarried:
76.6% (54)
Marital status - Other race population 15 years and over
Males 33.7% Never married19.4% Now married5.2% Separated6.7% Widowed34.9% DivorcedFemales 82.3% Never married15.9% Now married0.0% Separated0.0% Widowed1.8% DivorcedWomen who gave birth in the past 12 months Now married:
0.0% (0)Unmarried:
100.0% (34)
Women who did not give birth in the past 12 months Now married:
16.9% (41)Unmarried:
83.1% (201)
Marital status - Two or more races population 15 years and over
Males 52.0% Never married29.0% Now married0.0% Separated0.0% Widowed19.0% DivorcedFemales 43.9% Never married31.3% Now married10.8% Separated3.7% Widowed10.3% DivorcedWomen who gave birth in the past 12 months Now married:
30.6% (21)Unmarried:
69.4% (47)
Women who did not give birth in the past 12 months Now married:
44.9% (133)Unmarried:
55.1% (162)
Marital status - White alone, not Hispanic / Latino population 15 years and over
Males 38.6% Never married40.7% Now married1.0% Separated3.6% Widowed16.2% DivorcedFemales 31.1% Never married38.1% Now married1.4% Separated11.9% Widowed17.5% DivorcedWomen who gave birth in the past 12 months Now married:
42.2% (66)Unmarried:
57.8% (90)
Women who did not give birth in the past 12 months Now married:
40.4% (1,125)Unmarried:
59.6% (1,663)
Marital status - Hispanic or Latino population 15 years and over
Males 57.4% Never married11.1% Now married2.7% Separated3.5% Widowed25.4% DivorcedFemales 59.6% Never married16.5% Now married7.2% Separated3.3% Widowed13.3% DivorcedWomen who gave birth in the past 12 months Now married:
100.0% (20)Unmarried:
0.0% (0)
Women who did not give birth in the past 12 months Now married:
19.4% (92)Unmarried:
80.6% (384)
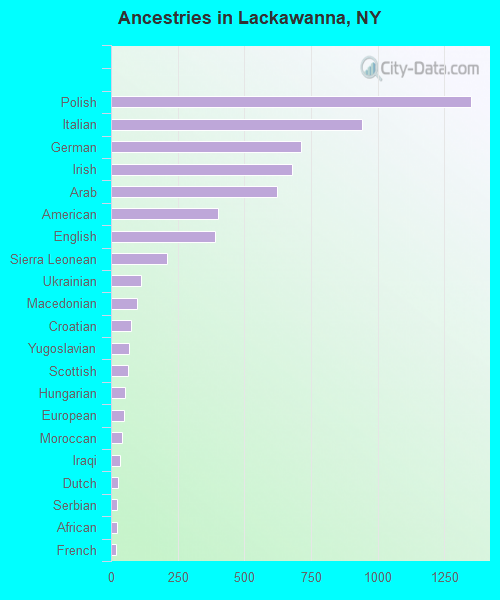
Ancestries in Lackawanna
1,350 12.6% Polish941 8.8% Italian713 6.7% German679 6.3% Irish623 5.8% Arab402 3.8% American390 3.6% English211 2.0% Sierra Leonean112 1.0% Ukrainian98 0.9% Macedonian74 0.7% Croatian68 0.6% Yugoslavian64 0.6% Scottish53 0.5% Hungarian48 0.4% European41 0.4% Moroccan33 0.3% Iraqi28 0.3% Dutch23 0.2% Serbian22 0.2% African18 0.2% French12 0.1% Lebanese12 0.1% Scotch-Irish6 0.06% Eastern European5 0.05% Russian
Geographical mobility in Lackawanna Same house 1 year ago 13,384 93.5% White (Caucasian)2,371 79.1% Black or African American79 100.0% American Indian / Alaska Native73 60.8% Asian604 100.0% Other race1,299 93.8% Two or more races13,139 93.7% White alone, not Hispanic / Latino1,265 95.8% Hispanic or LatinoMoved within same county 752 5.3% White / Caucasian338 11.3% Black or African American43 36.0% Asian89 6.4% Two or more races745 5.3% White alone, not Hispanic / Latino53 4.0% Hispanic or LatinoMoved within same state 59 0.4% White / Caucasian28 0.9% Black or African American22 0.2% White alone, not Hispanic / Latino54 4.1% Hispanic or LatinoMoved from different state 99 0.7% White / Caucasian390 13.0% Black or African American102 0.7% White alone, not Hispanic / LatinoMoved from abroad 12 0.1% White14 0.1% White alone, not Hispanic / Latino
Children Nativity (place of birth) in Lackawanna
Children under 6 years - Living with two parents Both parents native 354 97.8% Native8 2.2% Foreign-bornBoth parents foreign-born 223 91.0% Native22 9.0% Foreign-bornOne native, one foreign-born parent 294 100.0% NativeChildren under 6 years - Living with one parent Native parent 703 100.0% NativeForeign-born parent 5 100.0% NativeChildren 6 to 17 years - Living with two parents Both parents native 676 100.0% NativeBoth parents foreign-born 238 86.5% Native37 13.5% Foreign-bornOne native, one foreign-born parent 490 100.0% NativeChildren 6 to 17 years - Living with one parent Native parent 808 100.0% NativeForeign-born parent 29 40.6% Native43 59.4% Foreign-born
Grandparents responsible for own grandchildren in Lackawanna
Grandparents (30 to 59 years) White / Caucasian 48 67.6% Responsible for grandchildren23 32.4% Not responsible for grandchildrenBlack or African American 171 83.2% Responsible for grandchildren34 16.8% Not responsible for grandchildrenOther race 18 100.0% Not responsible for grandchildrenWhite alone, not Hispanic / Latino 47 66.3% Responsible for grandchildren24 33.7% Not responsible for grandchildrenHispanic or Latino 15 100.0% Not responsible for grandchildrenGrandparents (60 years and over) White / Caucasian 59 48.1% Responsible for grandchildren63 51.9% Not responsible for grandchildrenBlack or African American 4 100.0% Not responsible for grandchildrenWhite alone, not Hispanic / Latino 60 49.2% Responsible for grandchildren62 50.8% Not responsible for grandchildren