Races in Kyle, Texas (TX) Detailed Stats
Data:
Races - White alone (%)
Races - White alone (% change since 2000)
Races - Black alone (%)
Races - Black alone (% change since 2000)
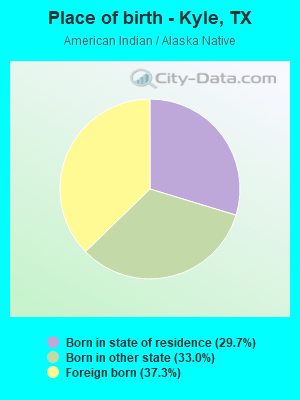
Races - American Indian alone (%)
Races - American Indian alone (% change since 2000)
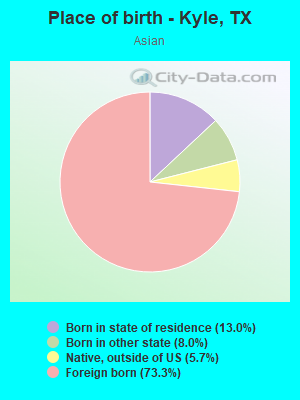
Races - Asian alone (%)
Races - Asian alone (% change since 2000)
Races - Hispanic (%)
Races - Hispanic (% change since 2000)
Races - Native Hawaiian and Other Pacific Islander alone (%)
Races - Native Hawaiian and Other Pacific Islander alone (% change since 2000)
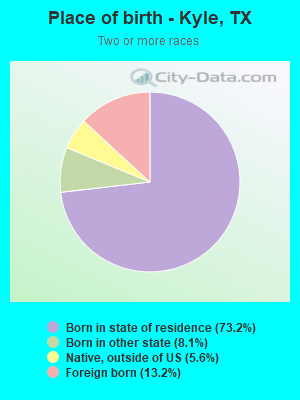
Races - Two or more races(%)
Races - Two or more races(% change since 2000)
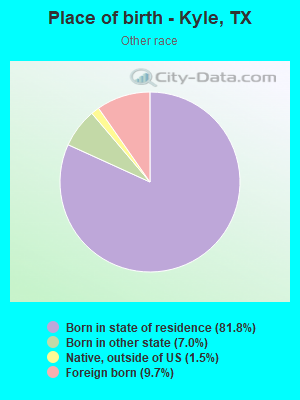
Races - Other race alone (%)
Races - Other race alone (% change since 2000)
Racial diversity
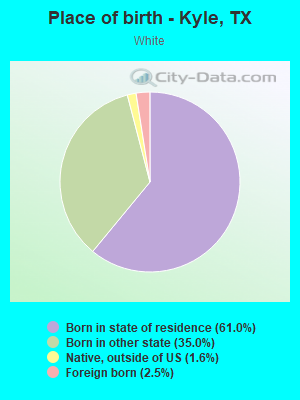
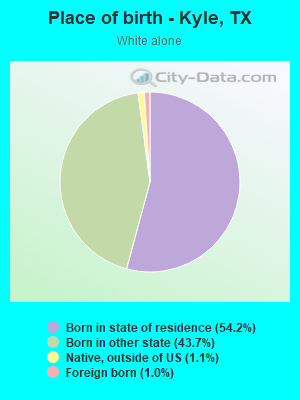
Place of birth - Born in state of residence (%)
Place of birth - Born in state of residence (%) - White
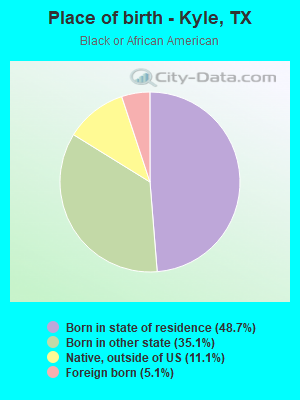
Place of birth - Born in state of residence (%) - Black or African American
Place of birth - Born in state of residence (%) - Asian
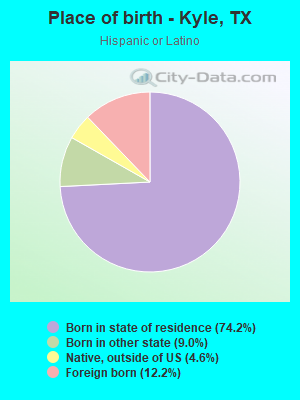
Place of birth - Born in state of residence (%) - Hispanic or Latino
Place of birth - Born in state of residence (%) - American Indian and Alaska Native
Place of birth - Born in state of residence (%) - Multirace
Place of birth - Born in state of residence (%) - Other Race
Place of birth - Born in other state (%)
Place of birth - Born in other state (%) - White
Place of birth - Born in other state (%) - Black or African American
Place of birth - Born in other state (%) - Asian
Place of birth - Born in other state (%) - Hispanic or Latino
Place of birth - Born in other state (%) - American Indian and Alaska Native
Place of birth - Born in other state (%) - Multirace
Place of birth - Born in other state (%) - Other Race
Place of birth - Native, outside of US (%)
Place of birth - Native, outside of US (%) - White
Place of birth - Native, outside of US (%) - Black or African American
Place of birth - Native, outside of US (%) - Asian
Place of birth - Native, outside of US (%) - Hispanic or Latino
Place of birth - Native, outside of US (%) - American Indian and Alaska Native
Place of birth - Native, outside of US (%) - Multirace
Place of birth - Native, outside of US (%) - Other Race
Place of birth - Foreign born (%)
Place of birth - Foreign born (%) - White
Place of birth - Foreign born (%) - Black or African American
Place of birth - Foreign born (%) - Asian
Place of birth - Foreign born (%) - Hispanic or Latino
Place of birth - Foreign born (%) - American Indian and Alaska Native
Place of birth - Foreign born (%) - Multirace
Place of birth - Foreign born (%) - Other Race
Residents speaking English at home (%)
Residents speaking English at home - Born in the United States (%)
Residents speaking English at home - Native, born elsewhere (%)
Residents speaking English at home - Foreign born (%)
Residents speaking Spanish at home (%)
Residents speaking Spanish at home - Born in the United States (%)
Residents speaking Spanish at home - Native, born elsewhere (%)
Residents speaking Spanish at home - Foreign born (%)
Residents speaking other language at home (%)
Residents speaking other language at home - Born in the United States (%)
Residents speaking other language at home - Native, born elsewhere (%)
Residents speaking other language at home - Foreign born (%)
Marital status - Never married (%)
Marital status - Now married (%)
Marital status - Separated (%)
Marital status - Widowed (%)
Marital status - Divorced (%)
Ancestries Reported - Arab (%)
Ancestries Reported - Czech (%)
Ancestries Reported - Danish (%)
Ancestries Reported - Dutch (%)
Ancestries Reported - English (%)
Ancestries Reported - French (%)
Ancestries Reported - French Canadian (%)
Ancestries Reported - German (%)
Ancestries Reported - Greek (%)
Ancestries Reported - Hungarian (%)
Ancestries Reported - Irish (%)
Ancestries Reported - Italian (%)
Ancestries Reported - Lithuanian (%)
Ancestries Reported - Norwegian (%)
Ancestries Reported - Polish (%)
Ancestries Reported - Portuguese (%)
Ancestries Reported - Russian (%)
Ancestries Reported - Scotch-Irish (%)
Ancestries Reported - Scottish (%)
Ancestries Reported - Slovak (%)
Ancestries Reported - Subsaharan African (%)
Ancestries Reported - Swedish (%)
Ancestries Reported - Swiss (%)
Ancestries Reported - Ukrainian (%)
Ancestries Reported - United States (%)
Ancestries Reported - Welsh (%)
Ancestries Reported - West Indian (%)
Ancestries Reported - Other (%)
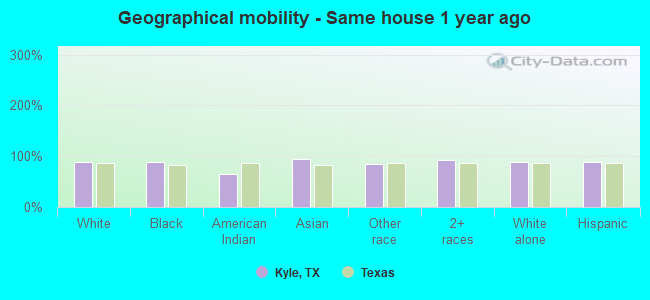
Geographical mobility - Same house 1 year ago (%)
Geographical mobility - Same house 1 year ago (%) - White
Geographical mobility - Same house 1 year ago (%) - Black or African American
Geographical mobility - Same house 1 year ago (%) - Asian
Geographical mobility - Same house 1 year ago (%) - Hispanic or Latino
Geographical mobility - Same house 1 year ago (%) - American Indian and Alaska Native
Geographical mobility - Same house 1 year ago (%) - Multirace
Geographical mobility - Same house 1 year ago (%) - Other Race
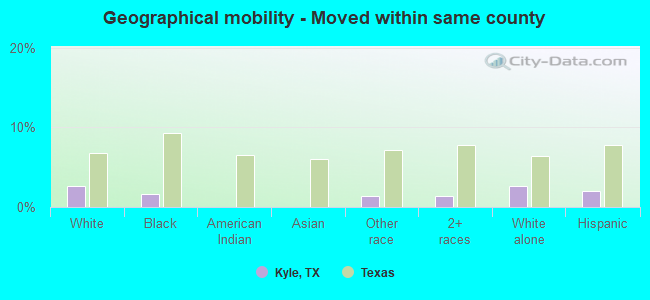
Geographical mobility - Moved within same county (%)
Geographical mobility - Moved within same county (%) - White
Geographical mobility - Moved within same county (%) - Black or African American
Geographical mobility - Moved within same county (%) - Asian
Geographical mobility - Moved within same county (%) - Hispanic or Latino
Geographical mobility - Moved within same county (%) - American Indian and Alaska Native
Geographical mobility - Moved within same county (%) - Multirace
Geographical mobility - Moved within same county (%) - Other Race
Geographical mobility - Moved from different county within same state (%)
Geographical mobility - Moved from different county within same state (%) - White
Geographical mobility - Moved from different county within same state (%) - Black or African American
Geographical mobility - Moved from different county within same state (%) - Asian
Geographical mobility - Moved from different county within same state (%) - Hispanic or Latino
Geographical mobility - Moved from different county within same state (%) - American Indian and Alaska Native
Geographical mobility - Moved from different county within same state (%) - Multirace
Geographical mobility - Moved from different county within same state (%) - Other Race
Geographical mobility - Moved from different state (%)
Geographical mobility - Moved from different state (%) - White
Geographical mobility - Moved from different state (%) - Black or African American
Geographical mobility - Moved from different state (%) - Asian
Geographical mobility - Moved from different state (%) - Hispanic or Latino
Geographical mobility - Moved from different state (%) - American Indian and Alaska Native
Geographical mobility - Moved from different state (%) - Multirace
Geographical mobility - Moved from different state (%) - Other Race
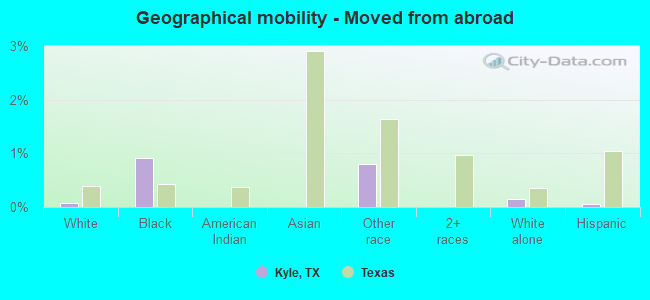
Geographical mobility - Moved from abroad (%)
Geographical mobility - Moved from abroad (%) - White
Geographical mobility - Moved from abroad (%) - Black or African American
Geographical mobility - Moved from abroad (%) - Asian
Geographical mobility - Moved from abroad (%) - Hispanic or Latino
Geographical mobility - Moved from abroad (%) - American Indian and Alaska Native
Geographical mobility - Moved from abroad (%) - Multirace
Geographical mobility - Moved from abroad (%) - Other Race
Place of birth for the foreign-born population - Ireland (%)
Place of birth for the foreign-born population - Denmark (%)
Place of birth for the foreign-born population - Norway (%)
Place of birth for the foreign-born population - Sweden (%)
Place of birth for the foreign-born population - United Kingdom (%)
Place of birth for the foreign-born population - England (%)
Place of birth for the foreign-born population - Scotland (%)
Place of birth for the foreign-born population - Other Northern Europe (%)
Place of birth for the foreign-born population - Austria (%)
Place of birth for the foreign-born population - Belgium (%)
Place of birth for the foreign-born population - France (%)
Place of birth for the foreign-born population - Germany (%)
Place of birth for the foreign-born population - Netherlands (%)
Place of birth for the foreign-born population - Switzerland (%)
Place of birth for the foreign-born population - Other Western Europe (%)
Place of birth for the foreign-born population - Greece (%)
Place of birth for the foreign-born population - Italy (%)
Place of birth for the foreign-born population - Portugal (%)
Place of birth for the foreign-born population - Spain (%)
Place of birth for the foreign-born population - Other Southern Europe (%)
Place of birth for the foreign-born population - Albania (%)
Place of birth for the foreign-born population - Belarus (%)
Place of birth for the foreign-born population - Bosnia and Herzegovina (%)
Place of birth for the foreign-born population - Bulgaria (%)
Place of birth for the foreign-born population - Croatia (%)
Place of birth for the foreign-born population - Czechoslovakia (%)
Place of birth for the foreign-born population - Hungary (%)
Place of birth for the foreign-born population - Latvia (%)
Place of birth for the foreign-born population - Lithuania (%)
Place of birth for the foreign-born population - North Macedonia (Macedonia) (%)
Place of birth for the foreign-born population - Moldova (%)
Place of birth for the foreign-born population - Poland (%)
Place of birth for the foreign-born population - Romania (%)
Place of birth for the foreign-born population - Russia (%)
Place of birth for the foreign-born population - Serbia (%)
Place of birth for the foreign-born population - Ukraine (%)
Place of birth for the foreign-born population - Other Eastern Europe (%)
Place of birth for the foreign-born population - China (%)
Place of birth for the foreign-born population - Hong Kong (%)
Place of birth for the foreign-born population - Taiwan (%)
Place of birth for the foreign-born population - Japan (%)
Place of birth for the foreign-born population - Korea (%)
Place of birth for the foreign-born population - Other Eastern Asia (%)
Place of birth for the foreign-born population - Afghanistan (%)
Place of birth for the foreign-born population - Bangladesh (%)
Place of birth for the foreign-born population - India (%)
Place of birth for the foreign-born population - Iran (%)
Place of birth for the foreign-born population - Kazakhstan (%)
Place of birth for the foreign-born population - Nepal (%)
Place of birth for the foreign-born population - Pakistan (%)
Place of birth for the foreign-born population - Sri Lanka (%)
Place of birth for the foreign-born population - Uzbekistan (%)
Place of birth for the foreign-born population - Other South Central Asia (%)
Place of birth for the foreign-born population - Burma (%)
Place of birth for the foreign-born population - Cambodia (%)
Place of birth for the foreign-born population - Indonesia (%)
Place of birth for the foreign-born population - Laos (%)
Place of birth for the foreign-born population - Malaysia (%)
Place of birth for the foreign-born population - Philippines (%)
Place of birth for the foreign-born population - Singapore (%)
Place of birth for the foreign-born population - Thailand (%)
Place of birth for the foreign-born population - Vietnam (%)
Place of birth for the foreign-born population - Other South Eastern Asia (%)
Place of birth for the foreign-born population - Armenia (%)
Place of birth for the foreign-born population - Iraq (%)
Place of birth for the foreign-born population - Israel (%)
Place of birth for the foreign-born population - Jordan (%)
Place of birth for the foreign-born population - Kuwait (%)
Place of birth for the foreign-born population - Lebanon (%)
Place of birth for the foreign-born population - Saudi Arabia (%)
Place of birth for the foreign-born population - Syria (%)
Place of birth for the foreign-born population - Turkey (%)
Place of birth for the foreign-born population - Yemen (%)
Place of birth for the foreign-born population - Other Western Asia (%)
Place of birth for the foreign-born population - Eritrea (%)
Place of birth for the foreign-born population - Ethiopia (%)
Place of birth for the foreign-born population - Kenya (%)
Place of birth for the foreign-born population - Somalia (%)
Place of birth for the foreign-born population - Uganda (%)
Place of birth for the foreign-born population - Zimbabwe (%)
Place of birth for the foreign-born population - Other Eastern Africa (%)
Place of birth for the foreign-born population - Cameroon (%)
Place of birth for the foreign-born population - Congo (%)
Place of birth for the foreign-born population - Democratic Republic of Congo (Zaire) (%)
Place of birth for the foreign-born population - Other Middle Africa (%)
Place of birth for the foreign-born population - Egypt (%)
Place of birth for the foreign-born population - Morocco (%)
Place of birth for the foreign-born population - Sudan (%)
Place of birth for the foreign-born population - Other Northern Africa (%)
Place of birth for the foreign-born population - South Africa (%)
Place of birth for the foreign-born population - Other Southern Africa (%)
Place of birth for the foreign-born population - Cabo Verde (%)
Place of birth for the foreign-born population - Ghana (%)
Place of birth for the foreign-born population - Liberia (%)
Place of birth for the foreign-born population - Nigeria (%)
Place of birth for the foreign-born population - Senegal (%)
Place of birth for the foreign-born population - Sierra Leone (%)
Place of birth for the foreign-born population - Other Western Africa (%)
Place of birth for the foreign-born population - Australia (%)
Place of birth for the foreign-born population - New Zealand (%)
Place of birth for the foreign-born population - Fiji (%)
Place of birth for the foreign-born population - Micronesia (%)
Place of birth for the foreign-born population - Bahamas (%)
Place of birth for the foreign-born population - Barbados (%)
Place of birth for the foreign-born population - Cuba (%)
Place of birth for the foreign-born population - Dominica (%)
Place of birth for the foreign-born population - Dominican Republic (%)
Place of birth for the foreign-born population - Grenada (%)
Place of birth for the foreign-born population - Haiti (%)
Place of birth for the foreign-born population - Jamaica (%)
Place of birth for the foreign-born population - St. Vincent and the Grenadines (%)
Place of birth for the foreign-born population - Trinidad and Tobago (%)
Place of birth for the foreign-born population - West Indies (%)
Place of birth for the foreign-born population - Other Caribbean (%)
Place of birth for the foreign-born population - Belize (%)
Place of birth for the foreign-born population - Costa Rica (%)
Place of birth for the foreign-born population - El Salvador (%)
Place of birth for the foreign-born population - Guatemala (%)
Place of birth for the foreign-born population - Honduras (%)
Place of birth for the foreign-born population - Mexico (%)
Place of birth for the foreign-born population - Nicaragua (%)
Place of birth for the foreign-born population - Panama (%)
Place of birth for the foreign-born population - Other Central America (%)
Place of birth for the foreign-born population - Argentina (%)
Place of birth for the foreign-born population - Bolivia (%)
Place of birth for the foreign-born population - Brazil (%)
Place of birth for the foreign-born population - Chile (%)
Place of birth for the foreign-born population - Colombia (%)
Place of birth for the foreign-born population - Ecuador (%)
Place of birth for the foreign-born population - Guyana (%)
Place of birth for the foreign-born population - Peru (%)
Place of birth for the foreign-born population - Uruguay (%)
Place of birth for the foreign-born population - Venezuela (%)
Place of birth for the foreign-born population - Other South America (%)
Place of birth for the foreign-born population - Canada (%)
Place of birth for the foreign-born population - Other Northern America (%)
Place of birth for the foreign-born population - Other (%)
Latest news about races in Kyle, TX collected exclusively by city-data.com from local newspapers, TV, and radio stations
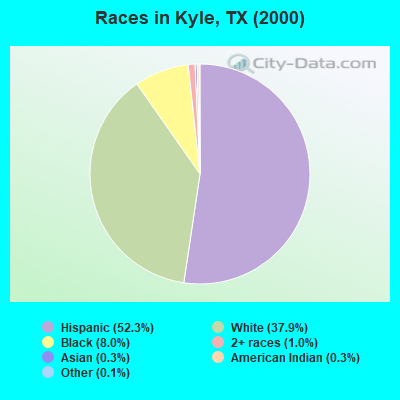
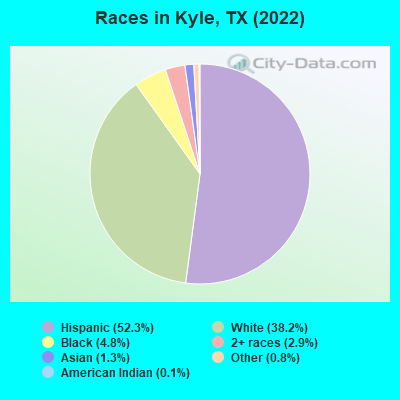
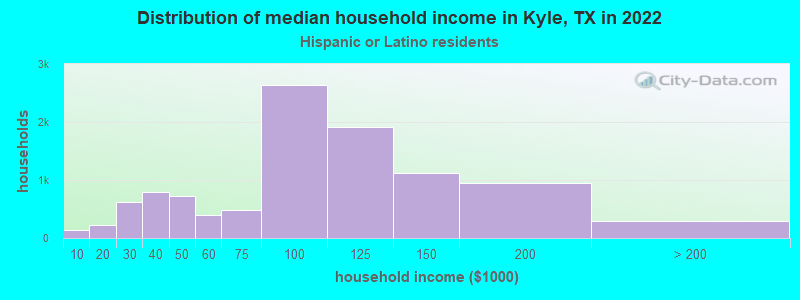
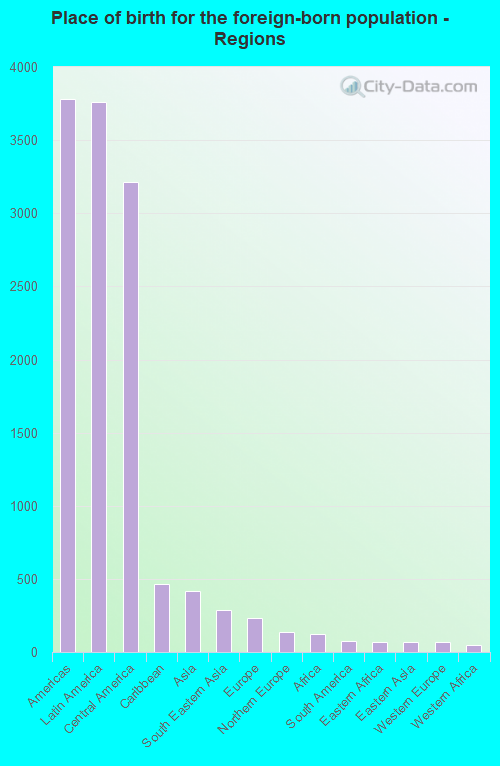
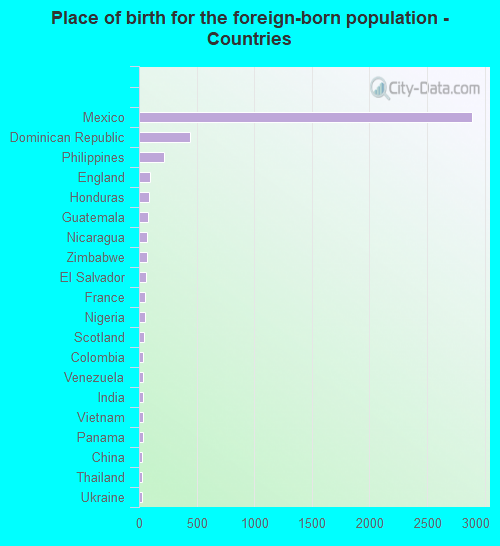
According to 2022 data, the most numerous races in Kyle, TX are Hispanic (27,832 residents), White alone (20,300 residents), and Black alone (2,528 residents). 70.9% of Kyle residents speak English at home. 8.6% of Kyle, TX residents are foreign-born (7.5% born in Latin America), which is 98.7% less than the foreign-born rate of 17.0% across the entire state of Texas.
Race distribution in Kyle
2000 2022
10,933,313 52.4% White alone 6,669,666 32.0% Hispanic 2,364,255 11.3% Black alone 554,445 2.7% Asian alone 230,567 1.1% Two or more races 68,859 0.3% American Indian alone 19,958 0.10% Other race alone 10,757 0.05% Native Hawaiian and Other
12,070,642 40.2% Hispanic 11,683,430 38.9% White alone 3,508,706 11.7% Black alone 1,608,173 5.4% Asian alone 956,560 3.2% Two or more races 125,763 0.4% Other race alone 47,023 0.2% American Indian alone 29,275 0.10% Native Hawaiian and Other
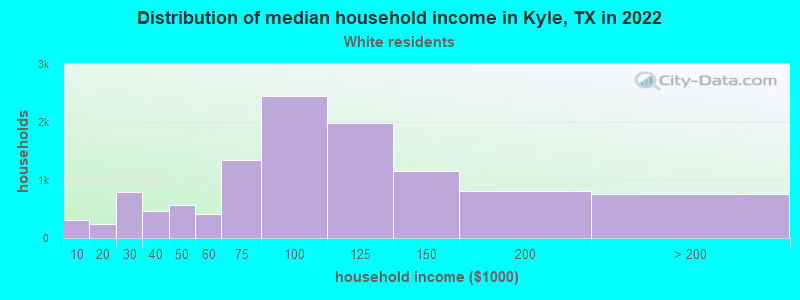
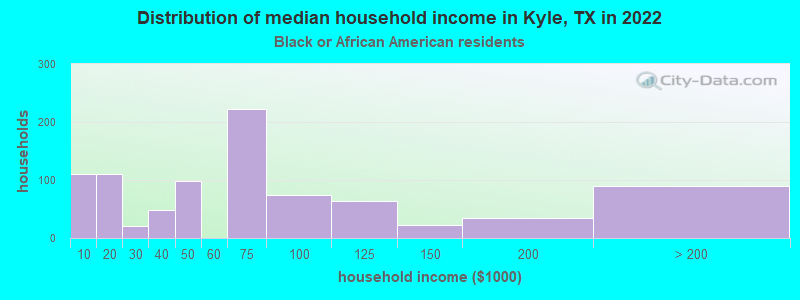
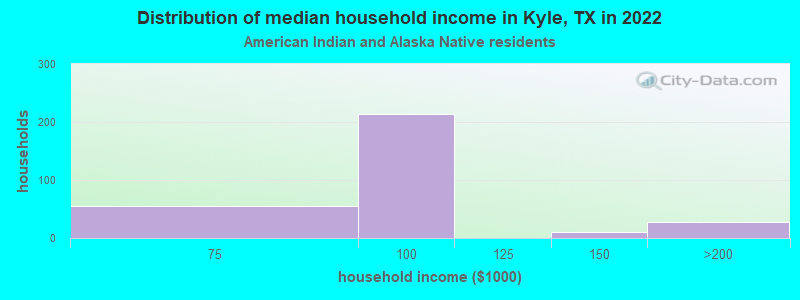
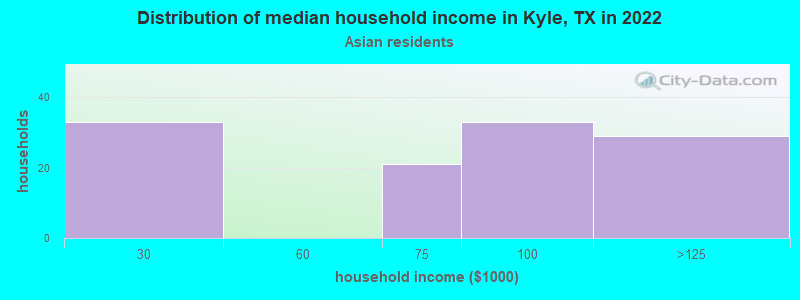
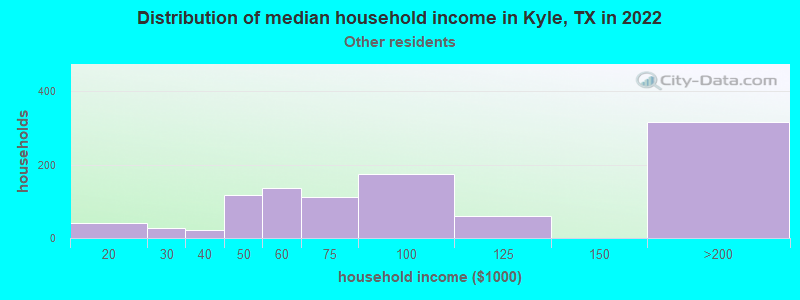
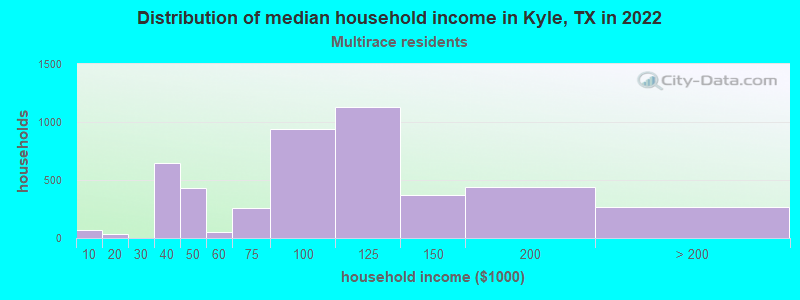
Income and house value in Kyle Median household income in 2022 $94,147 White non-Hispanic householders$71,707 Black householders$74,726 American Indian and Alaska Native householders$114,989 Asian householders$92,146 Some other race householders$116,009 Two or more races householders$105,719 Hispanic or Latino race householdersMedian 2022 house value $353,812 White Non-Hispanic householders$385,428 Black or African American householders$328,591 American Indian or Alaska Native householders$328,235 Some other race householders$349,194 Two or more races householders$310,829 Hispanic or Latino householders
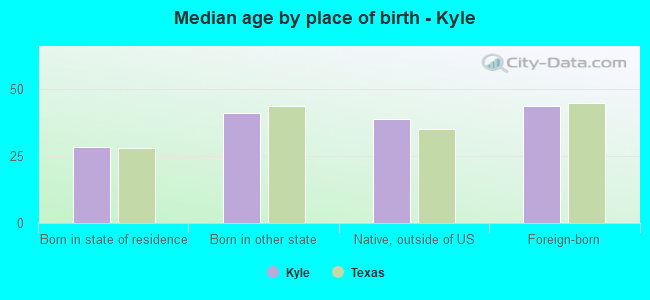
Median age by race in Kyle
36.2 Median age for White residents37.0 35.4 32.4 Median age for Black or African American residents32.3 25.1 49.9 Median age for American Indian / Alaska Native residents46.4 90.7 26.1 Median age for Asian residents20.3 31.5 -583,034,647.0 Median age for Native Hawaiian / Pacific Islander residents-612,729,233.5 -587,244,283.4 31.5 Median age for Other race residents32.6 29.9 34.7 Median age for Two or more races residents33.2 36.6 38.6 Median age for White alone residents40.3 37.1 32.1 Median age for Hispanic or Latino residents32.0 32.3
Owner/renter occupied households by race in Kyle
House owners and renters - White residents 7,617 67.7% Owner occupied3,632 32.3% Renter occupiedHouse owners and renters - Black or African American residents 436 46.1% Owner occupied510 53.9% Renter occupiedHouse owners and renters - American Indian / Alaska Native residents 151 46.7% Owner occupied172 53.3% Renter occupiedHouse owners and renters - Asian residents 178 94.5% Owner occupied10 5.5% Renter occupiedHouse owners and renters - Other race residents 679 68.9% Owner occupied306 31.1% Renter occupiedHouse owners and renters - Two or more races residents 5,170 82.9% Owner occupied1,063 17.1% Renter occupiedHouse owners and renters - White alone residents 5,765 70.3% Owner occupied2,430 29.7% Renter occupiedHouse owners and renters - Hispanic or Latino residents 7,173 71.2% Owner occupied2,908 28.8% Renter occupied
Language usage in Kyle
English speakers - Total 70.9% of residents of Kyle speak English at home.
25.9% of residents speak Spanish at home 9,249 72.5% Speak English very well3,511 27.5% Speak English less than very well1.7% of residents speak other language at home 773 90.3% Speak English very well83 9.7% Speak English less than very well
English speakers - Born in the United States 90.1% of residents of Kyle speak English at home.
8.3% of residents speak Spanish at home 1,040 98.3% Speak English very well18 1.7% Speak English less than very well0.6% of residents speak other language at home 32 40.0% Speak English very well48 60.0% Speak English less than very well
English speakers - Native, born elsewhere 34.0% of residents of Kyle speak English at home.
45.2% of residents speak Spanish at home 249 28.7% Speak English very well618 71.3% Speak English less than very well2.7% of residents speak other language at home 19 36.5% Speak English very well33 63.5% Speak English less than very well
English speakers - Foreign-born 13.5% of residents of Kyle speak English at home.
69.9% of residents speak Spanish at home 1,146 37.9% Speak English very well1,874 62.1% Speak English less than very well12.0% of residents speak other language at home 484 93.4% Speak English very well34 6.6% Speak English less than very well
White (Caucasian) - Speak only English Native:
86.4% (22,215)Foreign-born:
32.9% (230)
White (Caucasian) - Speak another language Native:
11.4% (2,926)Foreign-born:
64.3% (450)
Black or African American - Speak another language Native:
6.7% (145)Foreign-born:
100.0% (149)
American Indian / Alaska Native - Speak another language Native:
77.4% (302)Foreign-born:
98.9% (219)
Asian - Speak only English Native:
54.5% (141)Foreign-born:
37.6% (191)
Asian - Speak another language Native:
45.0% (116)Foreign-born:
63.5% (323)
Other race - Speak only English Native:
66.8% (2,750)Foreign-born:
14.8% (72)
Other race - Speak another language Native:
33.4% (1,374)Foreign-born:
87.3% (425)
Two or more races - Speak only English Native:
59.3% (8,079)Foreign-born:
6.0% (134)
Two or more races - Speak another language Native:
40.2% (5,473)Foreign-born:
91.1% (2,031)
White alone - Speak only English Native:
98.0% (18,616)Foreign-born:
93.6% (193)
White alone - Speak another language Native:
2.0% (385)Foreign-born:
22.6% (47)
Hispanic or Latino - Speak only English Native:
55.5% (12,284)Foreign-born:
7.1% (241)
Hispanic or Latino - Speak another language Native:
44.3% (9,823)Foreign-born:
92.0% (3,112)
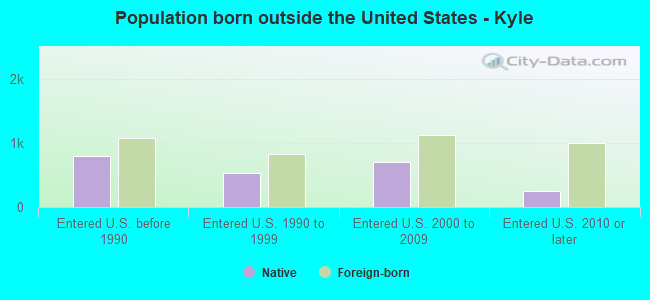
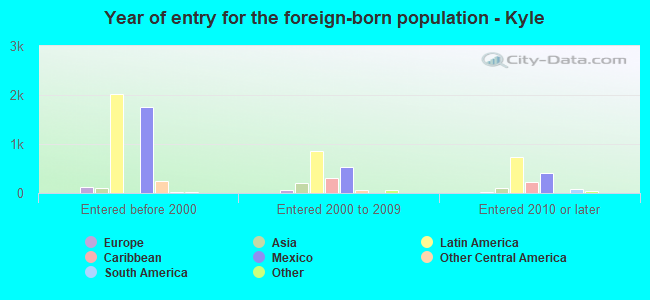
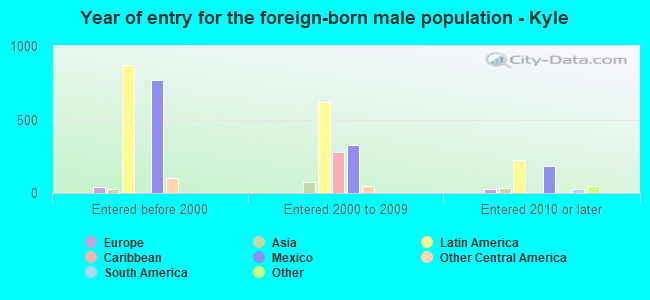
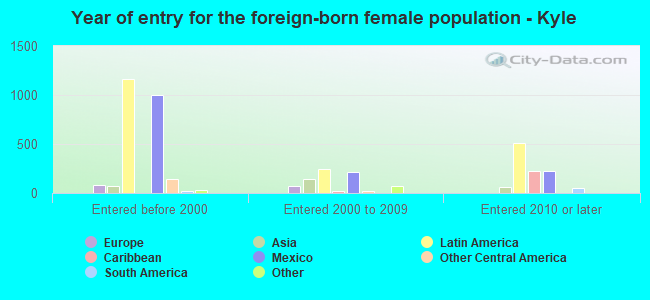
Foreign-born residents in Kyle 4,552 residents are foreign born (7.5% Latin America ).
This city:
8.6%Texas:
17.1%
Marital status for residents in Kyle Marital status - White (Caucasian) population 15 years and over
Males 33.3% Never married53.5% Now married0.6% Separated1.7% Widowed10.8% DivorcedFemales 32.7% Never married48.4% Now married2.2% Separated4.6% Widowed12.1% DivorcedWomen who gave birth in the past 12 months Now married:
100.0% (201)Unmarried:
0.0% (0)
Women who did not give birth in the past 12 months Now married:
46.6% (3,504)Unmarried:
53.4% (4,018)
Marital status - Black or African American population 15 years and over
Males 45.2% Never married43.7% Now married0.0% Separated0.0% Widowed11.1% DivorcedFemales 30.2% Never married28.4% Now married6.9% Separated13.0% Widowed21.4% DivorcedWomen who gave birth in the past 12 months Now married:
100.0% (21)Unmarried:
0.0% (0)
Women who did not give birth in the past 12 months Now married:
39.6% (196)Unmarried:
60.4% (299)
Marital status - American Indian / Alaska Native population 15 years and over
Males 40.6% Never married41.8% Now married0.0% Separated0.0% Widowed17.6% DivorcedFemales 15.2% Never married73.0% Now married0.0% Separated7.1% Widowed4.7% DivorcedWomen who did not give birth in the past 12 months Now married:
46.7% (40)Unmarried:
53.3% (46)
Marital status - Asian population 15 years and over
Males 42.0% Never married58.0% Now married0.0% Separated0.0% Widowed0.0% DivorcedFemales 32.4% Never married64.2% Now married0.0% Separated0.0% Widowed3.4% DivorcedWomen who gave birth in the past 12 months Now married:
100.0% (24)Unmarried:
0.0% (0)
Women who did not give birth in the past 12 months Now married:
56.2% (132)Unmarried:
43.8% (103)
Marital status - Other race population 15 years and over
Males 41.9% Never married43.4% Now married2.5% Separated0.0% Widowed12.3% DivorcedFemales 40.5% Never married50.0% Now married0.0% Separated1.9% Widowed7.6% DivorcedWomen who gave birth in the past 12 months Now married:
100.0% (89)Unmarried:
0.0% (0)
Women who did not give birth in the past 12 months Now married:
44.4% (371)Unmarried:
55.6% (464)
Marital status - Two or more races population 15 years and over
Males 39.4% Never married45.3% Now married0.4% Separated0.4% Widowed14.5% DivorcedFemales 36.7% Never married46.3% Now married2.2% Separated3.0% Widowed11.7% DivorcedWomen who gave birth in the past 12 months Now married:
100.0% (568)Unmarried:
0.0% (0)
Women who did not give birth in the past 12 months Now married:
34.6% (1,112)Unmarried:
65.4% (2,101)
Marital status - White alone, not Hispanic / Latino population 15 years and over
Males 29.7% Never married56.9% Now married0.6% Separated1.9% Widowed10.9% DivorcedFemales 31.9% Never married49.5% Now married1.4% Separated4.3% Widowed12.9% DivorcedWomen who gave birth in the past 12 months Now married:
100.0% (135)Unmarried:
0.0% (0)
Women who did not give birth in the past 12 months Now married:
43.2% (2,362)Unmarried:
56.8% (3,107)
Marital status - Hispanic or Latino population 15 years and over
Males 40.0% Never married46.6% Now married0.7% Separated0.8% Widowed11.8% DivorcedFemales 34.7% Never married47.3% Now married2.4% Separated4.1% Widowed11.5% DivorcedWomen who gave birth in the past 12 months Now married:
100.0% (635)Unmarried:
0.0% (0)
Women who did not give birth in the past 12 months Now married:
45.0% (2,914)Unmarried:
55.0% (3,564)
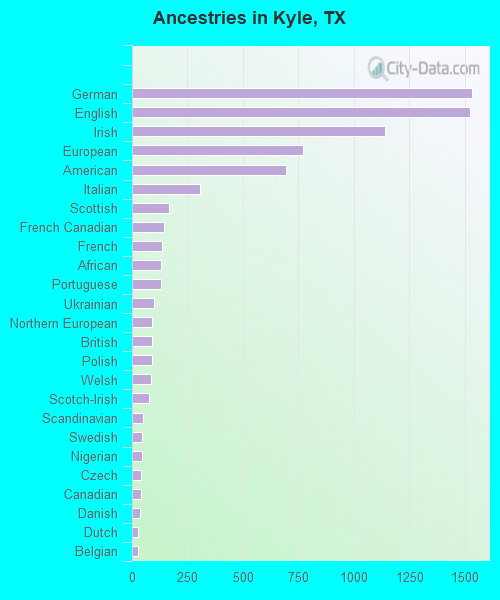
Ancestries in Kyle
1,532 5.4% German1,525 5.4% English1,138 4.0% Irish771 2.7% European695 2.5% American306 1.1% Italian165 0.6% Scottish143 0.5% French Canadian133 0.5% French131 0.5% African129 0.5% Portuguese100 0.4% Ukrainian92 0.3% Northern European91 0.3% British90 0.3% Polish86 0.3% Welsh75 0.3% Scotch-Irish51 0.2% Scandinavian46 0.2% Swedish43 0.2% Nigerian40 0.1% Czech39 0.1% Canadian37 0.1% Danish29 0.1% Dutch29 0.1% Belgian28 0.10% Slovak24 0.08% Ghanaian20 0.07% Lebanese18 0.06% Arab16 0.06% Greek14 0.05% Norwegian11 0.04% Australian7 0.02% Eastern European4 0.01% Hungarian
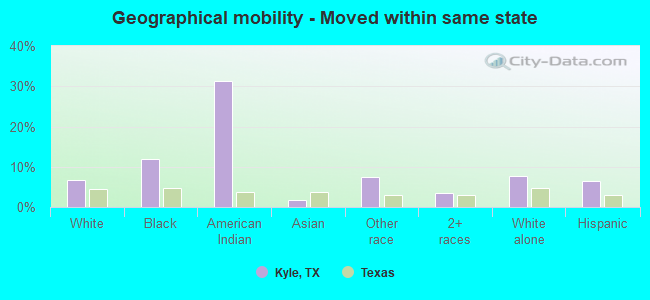
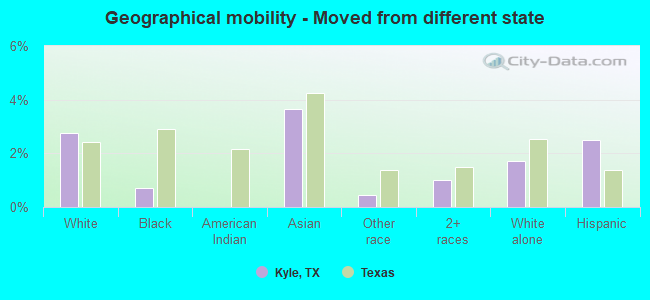
Geographical mobility in Kyle Same house 1 year ago 24,688 88.7% White (Caucasian)2,500 88.3% Black or African American393 65.7% American Indian / Alaska Native620 94.8% Asian4,579 84.0% Other race15,722 93.1% Two or more races17,795 88.7% White alone, not Hispanic / Latino24,382 89.4% Hispanic or LatinoMoved within same county 748 2.7% White / Caucasian46 1.6% Black or African American75 1.4% Other race230 1.4% Two or more races538 2.7% White alone, not Hispanic / Latino540 2.0% Hispanic or LatinoMoved within same state 1,867 6.7% White / Caucasian337 11.9% Black or African American188 31.4% American Indian / Alaska Native11 1.6% Asian401 7.4% Other race572 3.4% Two or more races1,540 7.7% White alone, not Hispanic / Latino1,742 6.4% Hispanic or LatinoMoved from different state 766 2.8% White / Caucasian20 0.7% Black or African American24 3.6% Asian25 0.5% Other race171 1.0% Two or more races342 1.7% White alone, not Hispanic / Latino676 2.5% Hispanic or LatinoMoved from abroad 19 0.1% White26 0.9% Black or African American44 0.8% Other race28 0.1% White alone, not Hispanic / Latino15 0.1% Hispanic or Latino
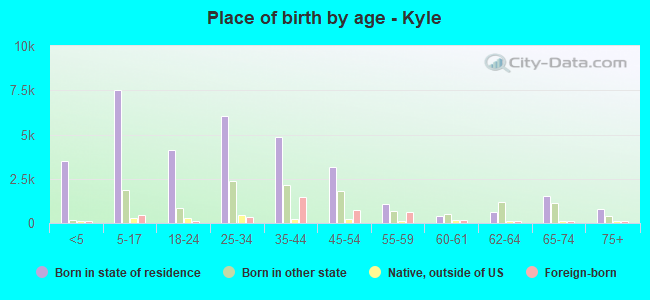
Children Nativity (place of birth) in Kyle
Children under 6 years - Living with two parents Both parents native 2,428 100.0% NativeBoth parents foreign-born 356 100.0% NativeOne native, one foreign-born parent 799 100.0% NativeChildren under 6 years - Living with one parent Native parent 455 100.0% NativeForeign-born parent 215 100.0% NativeChildren 6 to 17 years - Living with two parents Both parents native 5,593 100.0% NativeBoth parents foreign-born 335 63.2% Native195 36.8% Foreign-bornOne native, one foreign-born parent 773 77.7% Native222 22.3% Foreign-bornChildren 6 to 17 years - Living with one parent Native parent 1,676 100.0% NativeForeign-born parent 249 52.8% Native223 47.2% Foreign-born
Grandparents responsible for own grandchildren in Kyle
Grandparents (30 to 59 years) White / Caucasian 83 45.8% Responsible for grandchildren98 54.2% Not responsible for grandchildrenBlack or African American 32 72.9% Responsible for grandchildren12 27.1% Not responsible for grandchildrenOther race 73 100.0% Not responsible for grandchildrenTwo or more races 188 69.6% Responsible for grandchildren82 30.4% Not responsible for grandchildrenWhite alone, not Hispanic / Latino 25 23.2% Responsible for grandchildren82 76.8% Not responsible for grandchildrenHispanic or Latino 451 59.1% Responsible for grandchildren312 40.9% Not responsible for grandchildrenGrandparents (60 years and over) White / Caucasian 93 34.3% Responsible for grandchildren177 65.7% Not responsible for grandchildrenBlack or African American 36 81.0% Responsible for grandchildren8 19.0% Not responsible for grandchildrenOther race 21 100.0% Not responsible for grandchildrenTwo or more races 47 19.3% Responsible for grandchildren198 80.7% Not responsible for grandchildrenWhite alone, not Hispanic / Latino 110 49.5% Responsible for grandchildren112 50.5% Not responsible for grandchildrenHispanic or Latino 39 12.5% Responsible for grandchildren271 87.5% Not responsible for grandchildren