Races in Klamath Falls, Oregon (OR) Detailed Stats
Data:
Races - White alone (%)
Races - White alone (% change since 2000)
Races - Black alone (%)
Races - Black alone (% change since 2000)
Races - American Indian alone (%)
Races - American Indian alone (% change since 2000)
Races - Asian alone (%)
Races - Asian alone (% change since 2000)
Races - Hispanic (%)
Races - Hispanic (% change since 2000)
Races - Native Hawaiian and Other Pacific Islander alone (%)
Races - Native Hawaiian and Other Pacific Islander alone (% change since 2000)
Races - Two or more races(%)
Races - Two or more races(% change since 2000)
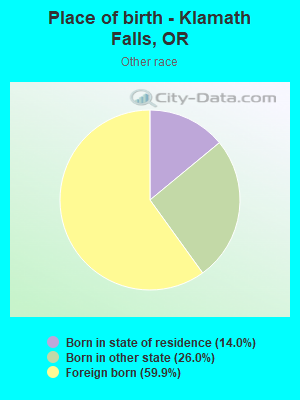
Races - Other race alone (%)
Races - Other race alone (% change since 2000)
Racial diversity
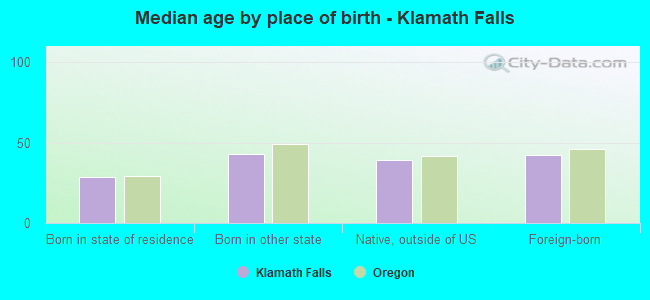
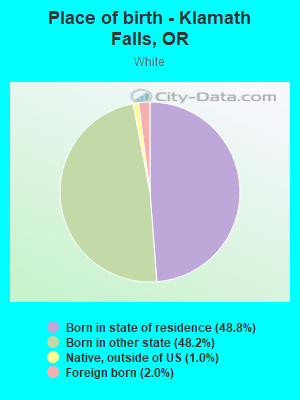
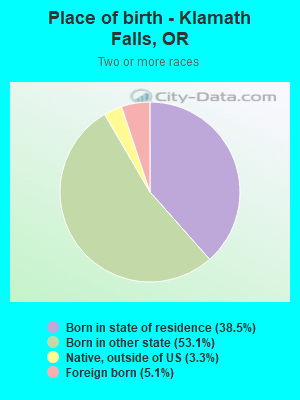
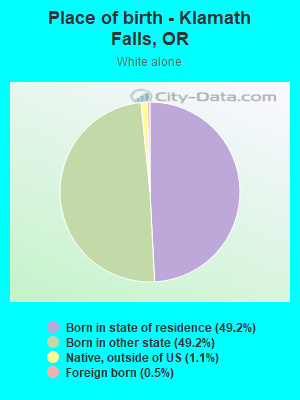
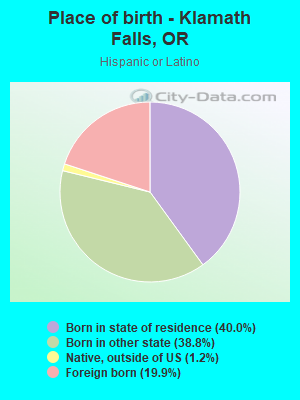
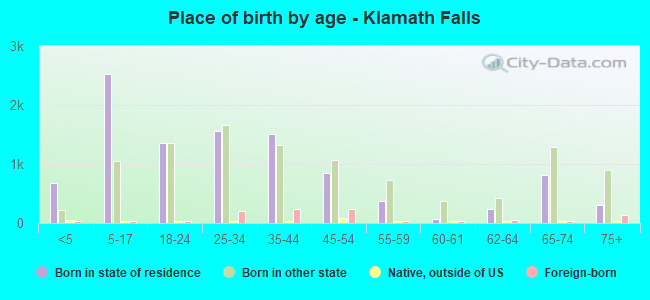
Place of birth - Born in state of residence (%)
Place of birth - Born in state of residence (%) - White
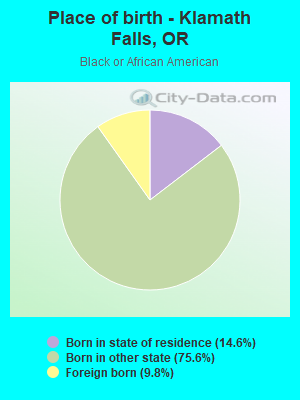
Place of birth - Born in state of residence (%) - Black or African American
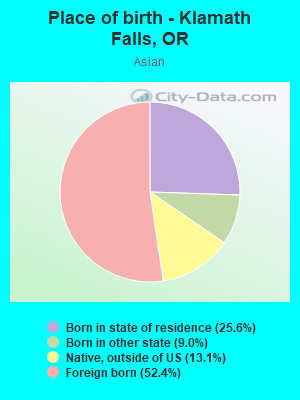
Place of birth - Born in state of residence (%) - Asian
Place of birth - Born in state of residence (%) - Hispanic or Latino
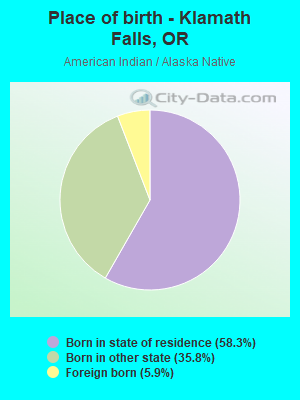
Place of birth - Born in state of residence (%) - American Indian and Alaska Native
Place of birth - Born in state of residence (%) - Multirace
Place of birth - Born in state of residence (%) - Other Race
Place of birth - Born in other state (%)
Place of birth - Born in other state (%) - White
Place of birth - Born in other state (%) - Black or African American
Place of birth - Born in other state (%) - Asian
Place of birth - Born in other state (%) - Hispanic or Latino
Place of birth - Born in other state (%) - American Indian and Alaska Native
Place of birth - Born in other state (%) - Multirace
Place of birth - Born in other state (%) - Other Race
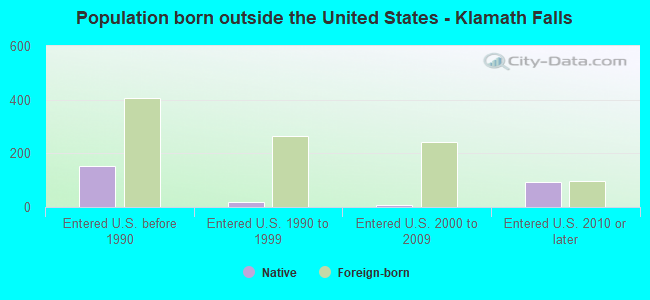
Place of birth - Native, outside of US (%)
Place of birth - Native, outside of US (%) - White
Place of birth - Native, outside of US (%) - Black or African American
Place of birth - Native, outside of US (%) - Asian
Place of birth - Native, outside of US (%) - Hispanic or Latino
Place of birth - Native, outside of US (%) - American Indian and Alaska Native
Place of birth - Native, outside of US (%) - Multirace
Place of birth - Native, outside of US (%) - Other Race
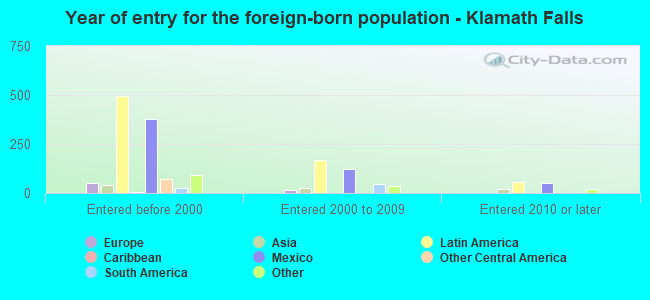
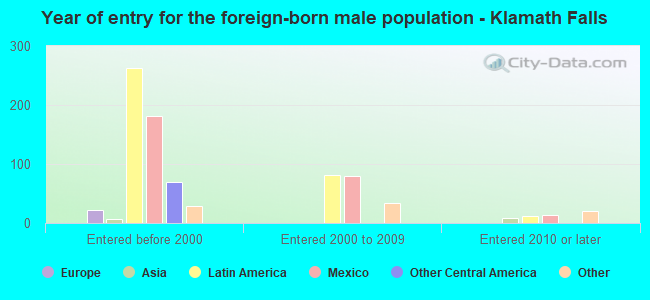
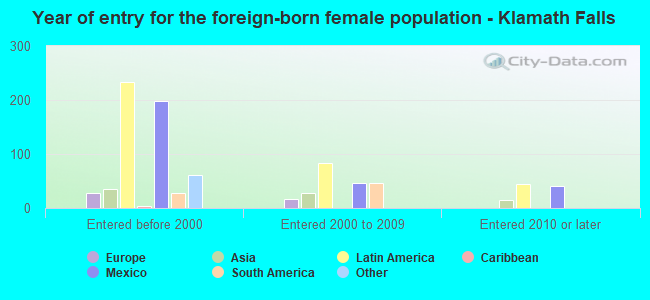
Place of birth - Foreign born (%)
Place of birth - Foreign born (%) - White
Place of birth - Foreign born (%) - Black or African American
Place of birth - Foreign born (%) - Asian
Place of birth - Foreign born (%) - Hispanic or Latino
Place of birth - Foreign born (%) - American Indian and Alaska Native
Place of birth - Foreign born (%) - Multirace
Place of birth - Foreign born (%) - Other Race
Residents speaking English at home (%)
Residents speaking English at home - Born in the United States (%)
Residents speaking English at home - Native, born elsewhere (%)
Residents speaking English at home - Foreign born (%)
Residents speaking Spanish at home (%)
Residents speaking Spanish at home - Born in the United States (%)
Residents speaking Spanish at home - Native, born elsewhere (%)
Residents speaking Spanish at home - Foreign born (%)
Residents speaking other language at home (%)
Residents speaking other language at home - Born in the United States (%)
Residents speaking other language at home - Native, born elsewhere (%)
Residents speaking other language at home - Foreign born (%)
Marital status - Never married (%)
Marital status - Now married (%)
Marital status - Separated (%)
Marital status - Widowed (%)
Marital status - Divorced (%)
Ancestries Reported - Arab (%)
Ancestries Reported - Czech (%)
Ancestries Reported - Danish (%)
Ancestries Reported - Dutch (%)
Ancestries Reported - English (%)
Ancestries Reported - French (%)
Ancestries Reported - French Canadian (%)
Ancestries Reported - German (%)
Ancestries Reported - Greek (%)
Ancestries Reported - Hungarian (%)
Ancestries Reported - Irish (%)
Ancestries Reported - Italian (%)
Ancestries Reported - Lithuanian (%)
Ancestries Reported - Norwegian (%)
Ancestries Reported - Polish (%)
Ancestries Reported - Portuguese (%)
Ancestries Reported - Russian (%)
Ancestries Reported - Scotch-Irish (%)
Ancestries Reported - Scottish (%)
Ancestries Reported - Slovak (%)
Ancestries Reported - Subsaharan African (%)
Ancestries Reported - Swedish (%)
Ancestries Reported - Swiss (%)
Ancestries Reported - Ukrainian (%)
Ancestries Reported - United States (%)
Ancestries Reported - Welsh (%)
Ancestries Reported - West Indian (%)
Ancestries Reported - Other (%)
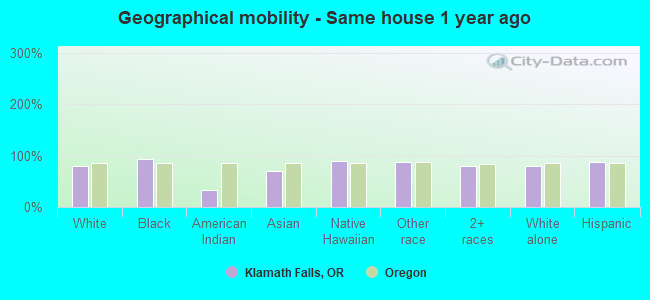
Geographical mobility - Same house 1 year ago (%)
Geographical mobility - Same house 1 year ago (%) - White
Geographical mobility - Same house 1 year ago (%) - Black or African American
Geographical mobility - Same house 1 year ago (%) - Asian
Geographical mobility - Same house 1 year ago (%) - Hispanic or Latino
Geographical mobility - Same house 1 year ago (%) - American Indian and Alaska Native
Geographical mobility - Same house 1 year ago (%) - Multirace
Geographical mobility - Same house 1 year ago (%) - Other Race
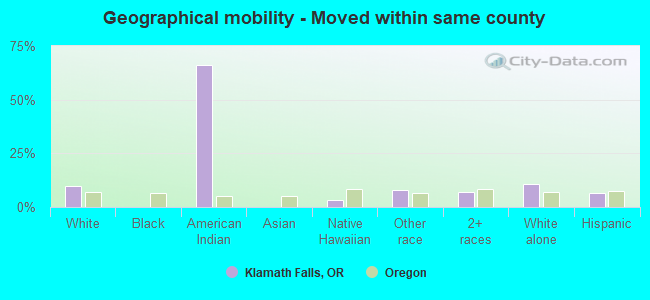
Geographical mobility - Moved within same county (%)
Geographical mobility - Moved within same county (%) - White
Geographical mobility - Moved within same county (%) - Black or African American
Geographical mobility - Moved within same county (%) - Asian
Geographical mobility - Moved within same county (%) - Hispanic or Latino
Geographical mobility - Moved within same county (%) - American Indian and Alaska Native
Geographical mobility - Moved within same county (%) - Multirace
Geographical mobility - Moved within same county (%) - Other Race
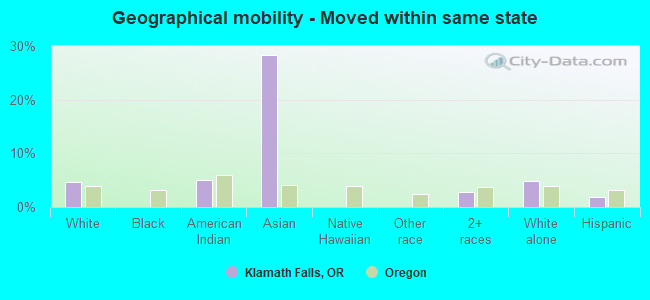
Geographical mobility - Moved from different county within same state (%)
Geographical mobility - Moved from different county within same state (%) - White
Geographical mobility - Moved from different county within same state (%) - Black or African American
Geographical mobility - Moved from different county within same state (%) - Asian
Geographical mobility - Moved from different county within same state (%) - Hispanic or Latino
Geographical mobility - Moved from different county within same state (%) - American Indian and Alaska Native
Geographical mobility - Moved from different county within same state (%) - Multirace
Geographical mobility - Moved from different county within same state (%) - Other Race
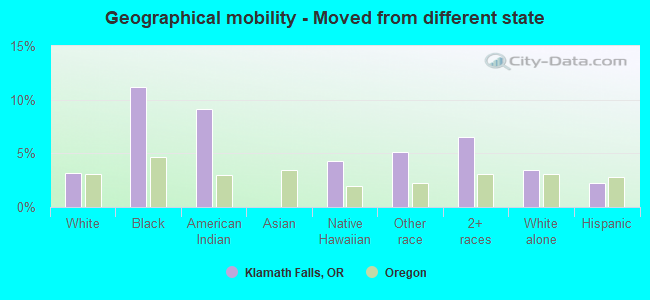
Geographical mobility - Moved from different state (%)
Geographical mobility - Moved from different state (%) - White
Geographical mobility - Moved from different state (%) - Black or African American
Geographical mobility - Moved from different state (%) - Asian
Geographical mobility - Moved from different state (%) - Hispanic or Latino
Geographical mobility - Moved from different state (%) - American Indian and Alaska Native
Geographical mobility - Moved from different state (%) - Multirace
Geographical mobility - Moved from different state (%) - Other Race
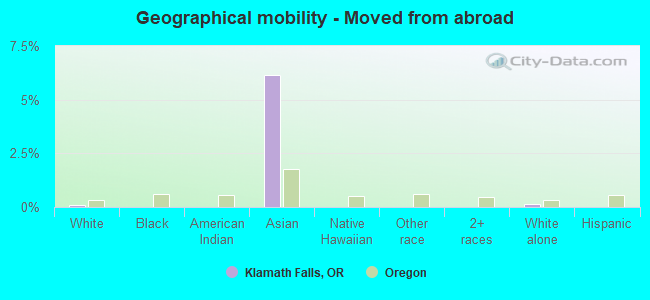
Geographical mobility - Moved from abroad (%)
Geographical mobility - Moved from abroad (%) - White
Geographical mobility - Moved from abroad (%) - Black or African American
Geographical mobility - Moved from abroad (%) - Asian
Geographical mobility - Moved from abroad (%) - Hispanic or Latino
Geographical mobility - Moved from abroad (%) - American Indian and Alaska Native
Geographical mobility - Moved from abroad (%) - Multirace
Geographical mobility - Moved from abroad (%) - Other Race
Place of birth for the foreign-born population - Ireland (%)
Place of birth for the foreign-born population - Denmark (%)
Place of birth for the foreign-born population - Norway (%)
Place of birth for the foreign-born population - Sweden (%)
Place of birth for the foreign-born population - United Kingdom (%)
Place of birth for the foreign-born population - England (%)
Place of birth for the foreign-born population - Scotland (%)
Place of birth for the foreign-born population - Other Northern Europe (%)
Place of birth for the foreign-born population - Austria (%)
Place of birth for the foreign-born population - Belgium (%)
Place of birth for the foreign-born population - France (%)
Place of birth for the foreign-born population - Germany (%)
Place of birth for the foreign-born population - Netherlands (%)
Place of birth for the foreign-born population - Switzerland (%)
Place of birth for the foreign-born population - Other Western Europe (%)
Place of birth for the foreign-born population - Greece (%)
Place of birth for the foreign-born population - Italy (%)
Place of birth for the foreign-born population - Portugal (%)
Place of birth for the foreign-born population - Spain (%)
Place of birth for the foreign-born population - Other Southern Europe (%)
Place of birth for the foreign-born population - Albania (%)
Place of birth for the foreign-born population - Belarus (%)
Place of birth for the foreign-born population - Bosnia and Herzegovina (%)
Place of birth for the foreign-born population - Bulgaria (%)
Place of birth for the foreign-born population - Croatia (%)
Place of birth for the foreign-born population - Czechoslovakia (%)
Place of birth for the foreign-born population - Hungary (%)
Place of birth for the foreign-born population - Latvia (%)
Place of birth for the foreign-born population - Lithuania (%)
Place of birth for the foreign-born population - North Macedonia (Macedonia) (%)
Place of birth for the foreign-born population - Moldova (%)
Place of birth for the foreign-born population - Poland (%)
Place of birth for the foreign-born population - Romania (%)
Place of birth for the foreign-born population - Russia (%)
Place of birth for the foreign-born population - Serbia (%)
Place of birth for the foreign-born population - Ukraine (%)
Place of birth for the foreign-born population - Other Eastern Europe (%)
Place of birth for the foreign-born population - China (%)
Place of birth for the foreign-born population - Hong Kong (%)
Place of birth for the foreign-born population - Taiwan (%)
Place of birth for the foreign-born population - Japan (%)
Place of birth for the foreign-born population - Korea (%)
Place of birth for the foreign-born population - Other Eastern Asia (%)
Place of birth for the foreign-born population - Afghanistan (%)
Place of birth for the foreign-born population - Bangladesh (%)
Place of birth for the foreign-born population - India (%)
Place of birth for the foreign-born population - Iran (%)
Place of birth for the foreign-born population - Kazakhstan (%)
Place of birth for the foreign-born population - Nepal (%)
Place of birth for the foreign-born population - Pakistan (%)
Place of birth for the foreign-born population - Sri Lanka (%)
Place of birth for the foreign-born population - Uzbekistan (%)
Place of birth for the foreign-born population - Other South Central Asia (%)
Place of birth for the foreign-born population - Burma (%)
Place of birth for the foreign-born population - Cambodia (%)
Place of birth for the foreign-born population - Indonesia (%)
Place of birth for the foreign-born population - Laos (%)
Place of birth for the foreign-born population - Malaysia (%)
Place of birth for the foreign-born population - Philippines (%)
Place of birth for the foreign-born population - Singapore (%)
Place of birth for the foreign-born population - Thailand (%)
Place of birth for the foreign-born population - Vietnam (%)
Place of birth for the foreign-born population - Other South Eastern Asia (%)
Place of birth for the foreign-born population - Armenia (%)
Place of birth for the foreign-born population - Iraq (%)
Place of birth for the foreign-born population - Israel (%)
Place of birth for the foreign-born population - Jordan (%)
Place of birth for the foreign-born population - Kuwait (%)
Place of birth for the foreign-born population - Lebanon (%)
Place of birth for the foreign-born population - Saudi Arabia (%)
Place of birth for the foreign-born population - Syria (%)
Place of birth for the foreign-born population - Turkey (%)
Place of birth for the foreign-born population - Yemen (%)
Place of birth for the foreign-born population - Other Western Asia (%)
Place of birth for the foreign-born population - Eritrea (%)
Place of birth for the foreign-born population - Ethiopia (%)
Place of birth for the foreign-born population - Kenya (%)
Place of birth for the foreign-born population - Somalia (%)
Place of birth for the foreign-born population - Uganda (%)
Place of birth for the foreign-born population - Zimbabwe (%)
Place of birth for the foreign-born population - Other Eastern Africa (%)
Place of birth for the foreign-born population - Cameroon (%)
Place of birth for the foreign-born population - Congo (%)
Place of birth for the foreign-born population - Democratic Republic of Congo (Zaire) (%)
Place of birth for the foreign-born population - Other Middle Africa (%)
Place of birth for the foreign-born population - Egypt (%)
Place of birth for the foreign-born population - Morocco (%)
Place of birth for the foreign-born population - Sudan (%)
Place of birth for the foreign-born population - Other Northern Africa (%)
Place of birth for the foreign-born population - South Africa (%)
Place of birth for the foreign-born population - Other Southern Africa (%)
Place of birth for the foreign-born population - Cabo Verde (%)
Place of birth for the foreign-born population - Ghana (%)
Place of birth for the foreign-born population - Liberia (%)
Place of birth for the foreign-born population - Nigeria (%)
Place of birth for the foreign-born population - Senegal (%)
Place of birth for the foreign-born population - Sierra Leone (%)
Place of birth for the foreign-born population - Other Western Africa (%)
Place of birth for the foreign-born population - Australia (%)
Place of birth for the foreign-born population - New Zealand (%)
Place of birth for the foreign-born population - Fiji (%)
Place of birth for the foreign-born population - Micronesia (%)
Place of birth for the foreign-born population - Bahamas (%)
Place of birth for the foreign-born population - Barbados (%)
Place of birth for the foreign-born population - Cuba (%)
Place of birth for the foreign-born population - Dominica (%)
Place of birth for the foreign-born population - Dominican Republic (%)
Place of birth for the foreign-born population - Grenada (%)
Place of birth for the foreign-born population - Haiti (%)
Place of birth for the foreign-born population - Jamaica (%)
Place of birth for the foreign-born population - St. Vincent and the Grenadines (%)
Place of birth for the foreign-born population - Trinidad and Tobago (%)
Place of birth for the foreign-born population - West Indies (%)
Place of birth for the foreign-born population - Other Caribbean (%)
Place of birth for the foreign-born population - Belize (%)
Place of birth for the foreign-born population - Costa Rica (%)
Place of birth for the foreign-born population - El Salvador (%)
Place of birth for the foreign-born population - Guatemala (%)
Place of birth for the foreign-born population - Honduras (%)
Place of birth for the foreign-born population - Mexico (%)
Place of birth for the foreign-born population - Nicaragua (%)
Place of birth for the foreign-born population - Panama (%)
Place of birth for the foreign-born population - Other Central America (%)
Place of birth for the foreign-born population - Argentina (%)
Place of birth for the foreign-born population - Bolivia (%)
Place of birth for the foreign-born population - Brazil (%)
Place of birth for the foreign-born population - Chile (%)
Place of birth for the foreign-born population - Colombia (%)
Place of birth for the foreign-born population - Ecuador (%)
Place of birth for the foreign-born population - Guyana (%)
Place of birth for the foreign-born population - Peru (%)
Place of birth for the foreign-born population - Uruguay (%)
Place of birth for the foreign-born population - Venezuela (%)
Place of birth for the foreign-born population - Other South America (%)
Place of birth for the foreign-born population - Canada (%)
Place of birth for the foreign-born population - Other Northern America (%)
Place of birth for the foreign-born population - Other (%)
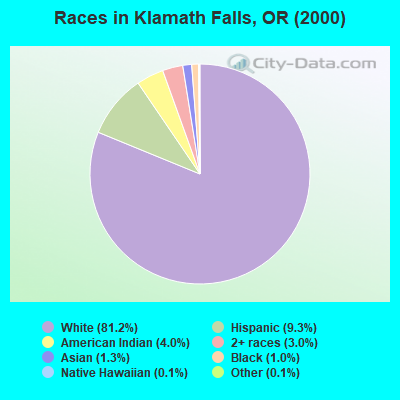
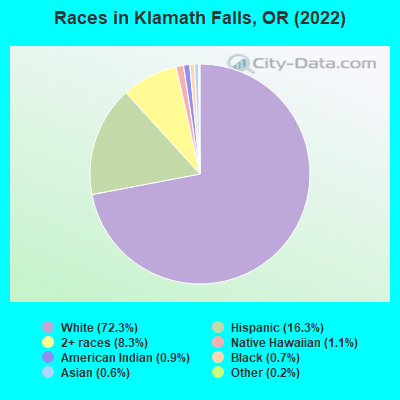
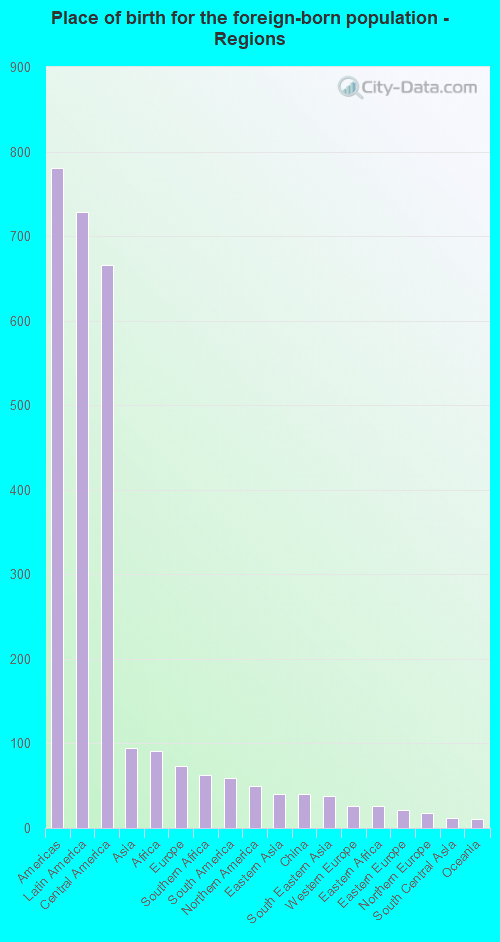
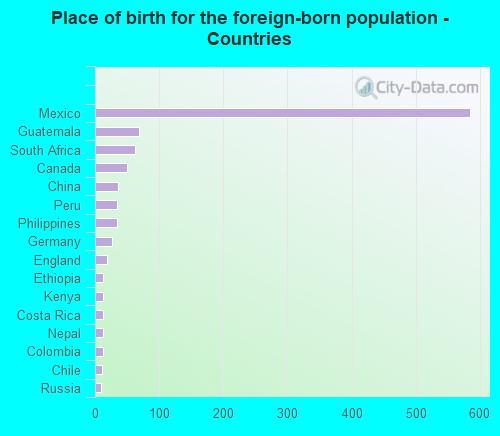
According to 2022 data, the most numerous races in Klamath Falls, OR are White alone (15,924 residents), Hispanic (3,596 residents), and Two or more races (1,821 residents). 87.7% of Klamath Falls residents speak English at home. 4.8% of Klamath Falls, OR residents are foreign-born (3.3% born in Latin America), which is 88.4% less than the foreign-born rate of 9.0% across the entire state of Oregon.
Race distribution in Klamath Falls
2000 2022
2,857,616 83.5% White alone 275,314 8.0% Hispanic 100,333 2.9% Asian alone 82,733 2.4% Two or more races 53,325 1.6% Black alone 40,130 1.2% American Indian alone 7,398 0.2% Native Hawaiian and Other 4,550 0.1% Other race alone
3,037,571 71.6% White alone 609,538 14.4% Hispanic 252,744 6.0% Two or more races 191,283 4.5% Asian alone 78,228 1.8% Black alone 29,399 0.7% American Indian alone 25,731 0.6% Other race alone 15,643 0.4% Native Hawaiian and Other
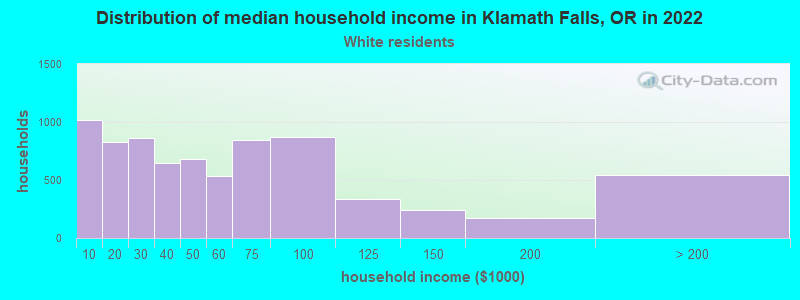
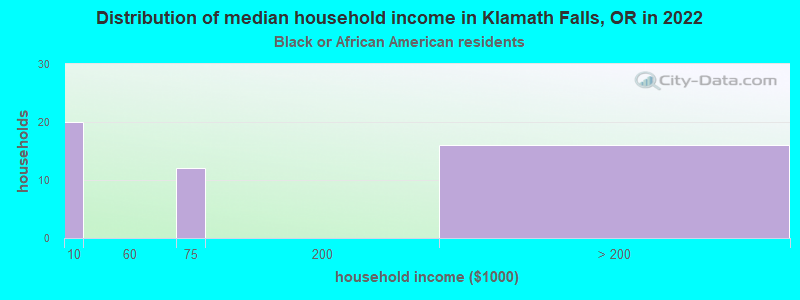
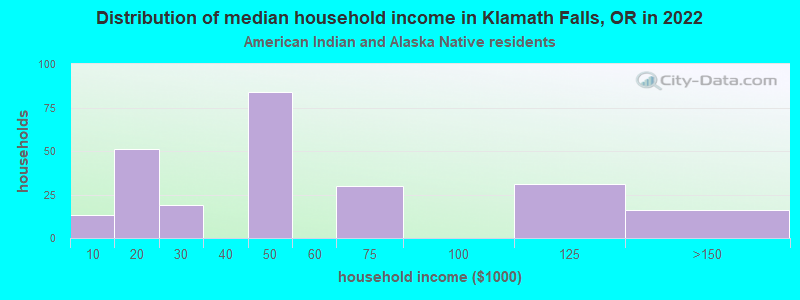
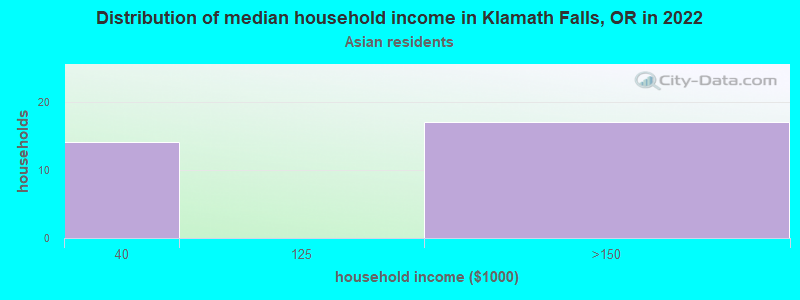
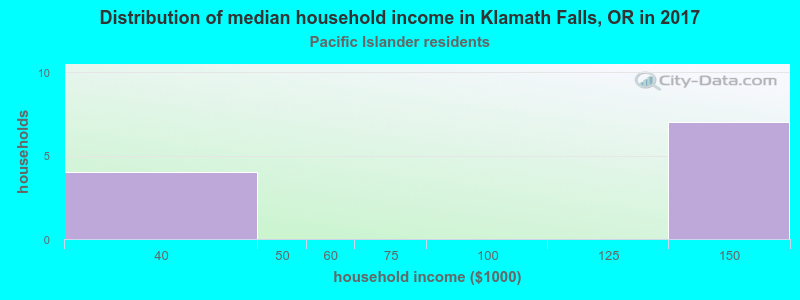
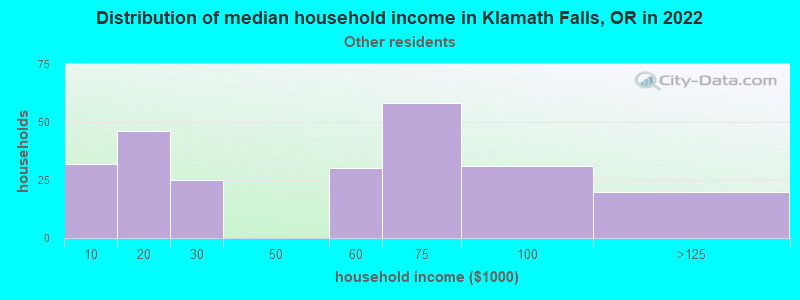
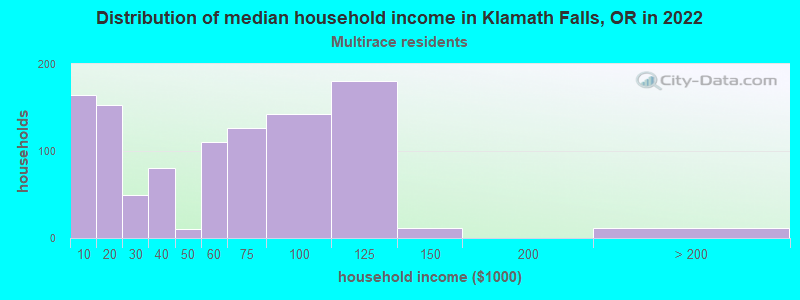
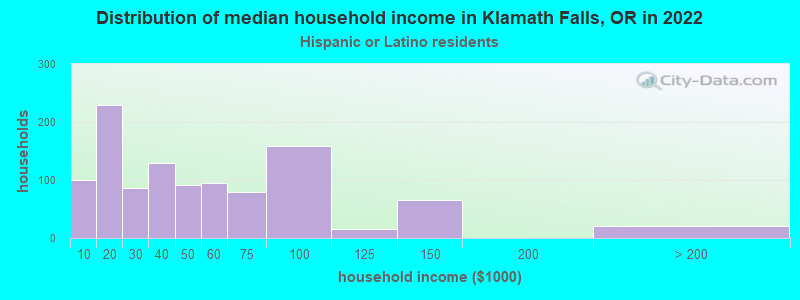
Income and house value in Klamath Falls Median household income in 2022 $45,828 White non-Hispanic householders$58,541 Two or more races householders$45,615 Hispanic or Latino race householdersMedian 2022 house value $278,263 White Non-Hispanic householders$300,587 Black or African American householders$228,585 American Indian or Alaska Native householders $375,734 Asian householders$204,374 Native Hawaiian and other Pacific Islander householders$204,374 Some other race householders$199,972 Two or more races householders$153,752 Hispanic or Latino householders
Median age by race in Klamath Falls
36.6 Median age for White residents35.1 37.4 47.2 Median age for Black or African American residents49.4 34.1 50.2 Median age for American Indian / Alaska Native residents15.3 76.4 15.7 Median age for Asian residents47.9 17.5 22.3 Median age for Native Hawaiian / Pacific Islander residents-764,119,600.6 23.1 40.2 Median age for Other race residents28.3 108.3 23.8 Median age for Two or more races residents26.3 21.4 38.5 Median age for White alone residents38.7 38.2 25.2 Median age for Hispanic or Latino residents18.7 31.2
Owner/renter occupied households by race in Klamath Falls
House owners and renters - White residents 3,975 56.0% Owner occupied3,120 44.0% Renter occupiedHouse owners and renters - Black or African American residents 17 35.3% Owner occupied31 64.7% Renter occupiedHouse owners and renters - American Indian / Alaska Native residents 31 24.1% Owner occupied98 75.9% Renter occupiedHouse owners and renters - Asian residents 18 68.1% Owner occupied9 31.9% Renter occupiedHouse owners and renters - Native Hawaiian / Pacific Islander residents 43 100.0% Renter occupiedHouse owners and renters - Other race residents 65 24.4% Owner occupied202 75.6% Renter occupiedHouse owners and renters - Two or more races residents 409 37.6% Owner occupied678 62.4% Renter occupiedHouse owners and renters - White alone residents 3,810 54.7% Owner occupied3,151 45.3% Renter occupiedHouse owners and renters - Hispanic or Latino residents 382 46.1% Owner occupied446 53.9% Renter occupied
Language usage in Klamath Falls
English speakers - Total 87.7% of residents of Klamath Falls speak English at home.
10.0% of residents speak Spanish at home 1,676 79.7% Speak English very well427 20.3% Speak English less than very well2.7% of residents speak other language at home 521 90.8% Speak English very well53 9.2% Speak English less than very well
English speakers - Born in the United States 96.2% of residents of Klamath Falls speak English at home.
1.8% of residents speak Spanish at home 168 90.3% Speak English very well18 9.7% Speak English less than very well1.0% of residents speak other language at home 79 76.7% Speak English very well24 23.3% Speak English less than very well
English speakers - Native, born elsewhere 95.8% of residents of Klamath Falls speak English at home.
10.2% of residents speak other language at home 12 100.0% Speak English very well
English speakers - Foreign-born 17.3% of residents of Klamath Falls speak English at home.
61.0% of residents speak Spanish at home 338 51.7% Speak English very well316 48.3% Speak English less than very well21.2% of residents speak other language at home 161 70.9% Speak English very well66 29.1% Speak English less than very well
White (Caucasian) - Speak only English Native:
95.4% (15,275)Foreign-born:
32.8% (115)
White (Caucasian) - Speak another language Native:
4.3% (692)Foreign-born:
65.0% (228)
Black or African American - Speak only English Native:
99.5% (132)Foreign-born:
100.0% (16)
American Indian / Alaska Native - Speak only English Native:
96.2% (586)Foreign-born:
86.0% (34)
Asian - Speak only English Native:
67.7% (48)Foreign-born:
18.6% (14)
Asian - Speak another language Native:
32.5% (23)Foreign-born:
81.5% (61)
Native Hawaiian / Pacific Islander - Speak another language Native:
17.6% (23)Foreign-born:
96.9% (6)
Other race - Speak only English Native:
74.2% (304)Foreign-born:
5.0% (14)
Other race - Speak another language Native:
30.0% (123)Foreign-born:
95.0% (274)
Two or more races - Speak only English Native:
80.1% (2,327)Foreign-born:
19.3% (33)
Two or more races - Speak another language Native:
20.5% (595)Foreign-born:
96.0% (164)
White alone - Speak only English Native:
97.2% (14,698)Foreign-born:
83.4% (103)
White alone - Speak another language Native:
2.8% (426)Foreign-born:
18.0% (22)
Hispanic or Latino - Speak only English Native:
63.9% (1,756)Foreign-born:
10.2% (73)
Hispanic or Latino - Speak another language Native:
35.9% (986)Foreign-born:
95.0% (682)
Foreign-born residents in Klamath Falls 1,052 residents are foreign born (3.3% Latin America ).
This city:
4.8%Oregon:
9.8%
Marital status for residents in Klamath Falls Marital status - White (Caucasian) population 15 years and over
Males 41.0% Never married37.7% Now married2.8% Separated2.6% Widowed15.9% DivorcedFemales 27.6% Never married40.5% Now married1.9% Separated8.7% Widowed21.3% DivorcedWomen who gave birth in the past 12 months Now married:
51.6% (126)Unmarried:
48.4% (118)
Women who did not give birth in the past 12 months Now married:
40.5% (1,595)Unmarried:
59.5% (2,339)
Marital status - Black or African American population 15 years and over
Males 35.2% Never married64.8% Now married0.0% Separated0.0% Widowed0.0% DivorcedFemales 22.7% Never married40.9% Now married0.0% Separated0.0% Widowed36.4% DivorcedWomen who gave birth in the past 12 months Now married:
100.0% (10)Unmarried:
0.0% (0)
Women who did not give birth in the past 12 months Now married:
0.0% (0)Unmarried:
100.0% (5)
Marital status - American Indian / Alaska Native population 15 years and over
Males 38.2% Never married20.7% Now married2.2% Separated0.0% Widowed38.9% DivorcedFemales 30.5% Never married28.1% Now married13.2% Separated0.0% Widowed28.1% DivorcedWomen who gave birth in the past 12 months Now married:
0.0% (0)Unmarried:
100.0% (10)
Women who did not give birth in the past 12 months Now married:
33.9% (40)Unmarried:
66.1% (79)
Marital status - Asian population 15 years and over
Males 21.1% Never married21.1% Now married0.0% Separated23.7% Widowed34.2% DivorcedFemales 59.3% Never married30.8% Now married0.0% Separated9.9% Widowed0.0% DivorcedWomen who did not give birth in the past 12 months Now married:
10.0% (6)Unmarried:
90.0% (56)
Marital status - Other race population 15 years and over
Males 45.6% Never married33.2% Now married0.0% Separated0.0% Widowed21.2% DivorcedFemales 45.9% Never married28.6% Now married0.0% Separated19.0% Widowed6.5% DivorcedWomen who did not give birth in the past 12 months Now married:
30.3% (63)Unmarried:
69.7% (145)
Marital status - Two or more races population 15 years and over
Males 47.3% Never married35.4% Now married0.0% Separated0.6% Widowed16.7% DivorcedFemales 42.5% Never married36.8% Now married0.0% Separated3.0% Widowed17.7% DivorcedWomen who gave birth in the past 12 months Now married:
68.5% (46)Unmarried:
31.5% (21)
Women who did not give birth in the past 12 months Now married:
39.7% (300)Unmarried:
60.3% (455)
Marital status - White alone, not Hispanic / Latino population 15 years and over
Males 40.2% Never married38.6% Now married2.6% Separated2.8% Widowed15.8% DivorcedFemales 27.2% Never married39.4% Now married2.0% Separated9.0% Widowed22.4% DivorcedWomen who gave birth in the past 12 months Now married:
44.8% (97)Unmarried:
55.2% (120)
Women who did not give birth in the past 12 months Now married:
39.2% (1,420)Unmarried:
60.8% (2,200)
Marital status - Hispanic or Latino population 15 years and over
Males 53.2% Never married26.0% Now married2.5% Separated0.0% Widowed18.3% DivorcedFemales 42.0% Never married41.4% Now married0.0% Separated6.1% Widowed10.5% DivorcedWomen who gave birth in the past 12 months Now married:
64.6% (33)Unmarried:
35.4% (18)
Women who did not give birth in the past 12 months Now married:
44.7% (397)Unmarried:
55.3% (492)
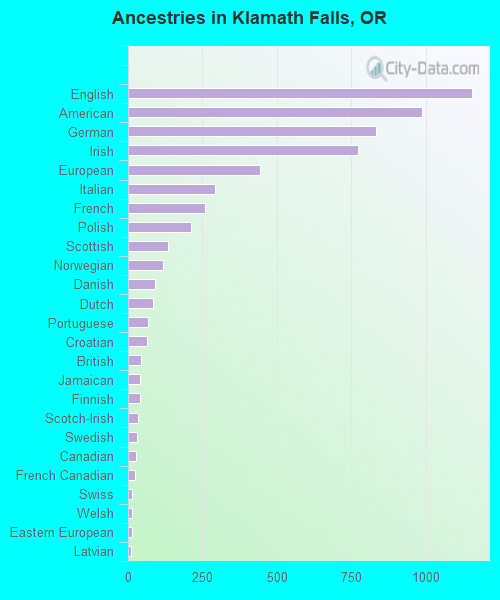
Ancestries in Klamath Falls
1,155 12.4% English987 10.6% American834 9.0% German772 8.3% Irish442 4.8% European292 3.1% Italian258 2.8% French211 2.3% Polish134 1.4% Scottish118 1.3% Norwegian91 1.0% Danish85 0.9% Dutch66 0.7% Portuguese65 0.7% Croatian42 0.5% British40 0.4% Jamaican39 0.4% Finnish33 0.4% Scotch-Irish31 0.3% Swedish28 0.3% Canadian22 0.2% French Canadian14 0.2% Swiss13 0.1% Welsh12 0.1% Eastern European11 0.1% Latvian11 0.1% Ethiopian9 0.10% Pennsylvania German8 0.09% Estonian6 0.06% Australian6 0.06% Belgian6 0.06% Russian5 0.05% Hungarian5 0.05% Romanian3 0.03% African2 0.02% Arab2 0.02% Sierra Leonean
Geographical mobility in Klamath Falls Same house 1 year ago 13,690 80.7% White (Caucasian)136 93.5% Black or African American113 32.4% American Indian / Alaska Native102 70.6% Asian152 89.5% Native Hawaiian / Pacific Islander602 87.4% Other race2,649 80.6% Two or more races12,499 79.3% White alone, not Hispanic / Latino3,144 87.6% Hispanic or LatinoMoved within same county 1,658 9.8% White / Caucasian231 66.0% American Indian / Alaska Native6 3.4% Native Hawaiian / Pacific Islander56 8.1% Other race225 6.8% Two or more races1,695 10.8% White alone, not Hispanic / Latino234 6.5% Hispanic or LatinoMoved within same state 797 4.7% White / Caucasian17 4.9% American Indian / Alaska Native41 28.2% Asian91 2.8% Two or more races771 4.9% White alone, not Hispanic / Latino69 1.9% Hispanic or LatinoMoved from different state 533 3.1% White / Caucasian16 11.2% Black or African American32 9.1% American Indian / Alaska Native7 4.3% Native Hawaiian / Pacific Islander35 5.2% Other race214 6.5% Two or more races538 3.4% White alone, not Hispanic / Latino79 2.2% Hispanic or LatinoMoved from abroad 19 0.1% White9 6.1% Asian20 0.1% White alone, not Hispanic / Latino
Children Nativity (place of birth) in Klamath Falls
Children under 6 years - Living with two parents Both parents native 751 100.0% NativeOne native, one foreign-born parent 32 100.0% NativeChildren under 6 years - Living with one parent Native parent 374 100.0% NativeForeign-born parent 11 100.0% NativeChildren 6 to 17 years - Living with two parents Both parents native 1,777 100.0% NativeBoth parents foreign-born 175 89.5% Native21 10.5% Foreign-bornOne native, one foreign-born parent 149 100.0% NativeChildren 6 to 17 years - Living with one parent Native parent 1,137 100.0% NativeForeign-born parent 123 50.1% Native122 49.9% Foreign-born
Grandparents responsible for own grandchildren in Klamath Falls
Grandparents (30 to 59 years) White / Caucasian 83 100.0% Responsible for grandchildrenTwo or more races 8 100.0% Responsible for grandchildrenWhite alone, not Hispanic / Latino 86 100.0% Responsible for grandchildrenGrandparents (60 years and over) White / Caucasian 4 9.6% Responsible for grandchildren36 90.4% Not responsible for grandchildrenTwo or more races 47 100.0% Not responsible for grandchildrenWhite alone, not Hispanic / Latino 4 9.5% Responsible for grandchildren38 90.5% Not responsible for grandchildren