Races in Kennedale, Texas (TX) Detailed Stats
Data:
Races - White alone (%)
Races - White alone (% change since 2000)
Races - Black alone (%)
Races - Black alone (% change since 2000)
Races - American Indian alone (%)
Races - American Indian alone (% change since 2000)
Races - Asian alone (%)
Races - Asian alone (% change since 2000)
Races - Hispanic (%)
Races - Hispanic (% change since 2000)
Races - Native Hawaiian and Other Pacific Islander alone (%)
Races - Native Hawaiian and Other Pacific Islander alone (% change since 2000)
Races - Two or more races(%)
Races - Two or more races(% change since 2000)
Races - Other race alone (%)
Races - Other race alone (% change since 2000)
Racial diversity
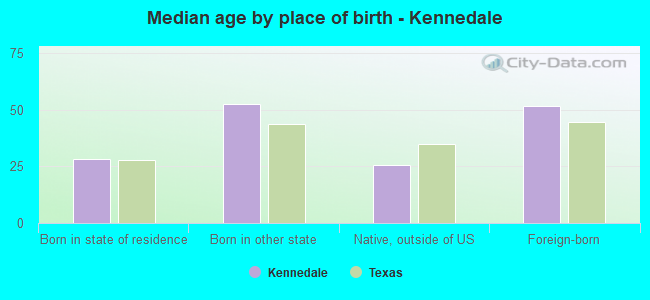
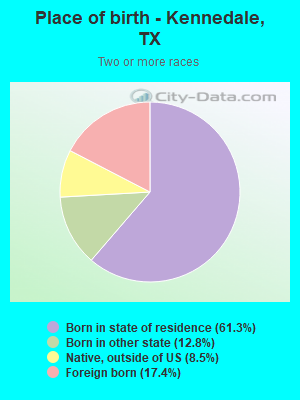
Place of birth - Born in state of residence (%)
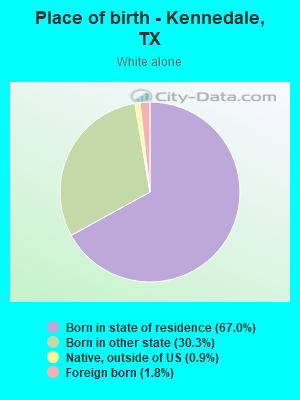
Place of birth - Born in state of residence (%) - White
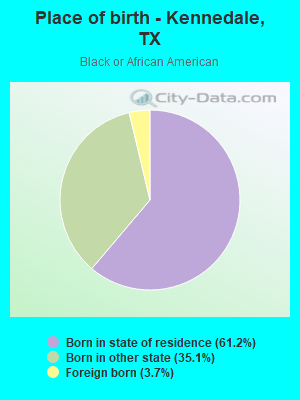
Place of birth - Born in state of residence (%) - Black or African American
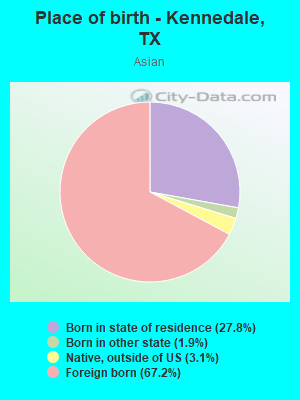
Place of birth - Born in state of residence (%) - Asian
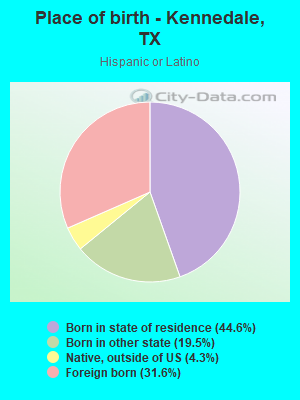
Place of birth - Born in state of residence (%) - Hispanic or Latino
Place of birth - Born in state of residence (%) - American Indian and Alaska Native
Place of birth - Born in state of residence (%) - Multirace
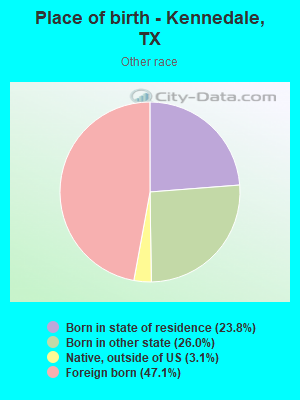
Place of birth - Born in state of residence (%) - Other Race
Place of birth - Born in other state (%)
Place of birth - Born in other state (%) - White
Place of birth - Born in other state (%) - Black or African American
Place of birth - Born in other state (%) - Asian
Place of birth - Born in other state (%) - Hispanic or Latino
Place of birth - Born in other state (%) - American Indian and Alaska Native
Place of birth - Born in other state (%) - Multirace
Place of birth - Born in other state (%) - Other Race
Place of birth - Native, outside of US (%)
Place of birth - Native, outside of US (%) - White
Place of birth - Native, outside of US (%) - Black or African American
Place of birth - Native, outside of US (%) - Asian
Place of birth - Native, outside of US (%) - Hispanic or Latino
Place of birth - Native, outside of US (%) - American Indian and Alaska Native
Place of birth - Native, outside of US (%) - Multirace
Place of birth - Native, outside of US (%) - Other Race
Place of birth - Foreign born (%)
Place of birth - Foreign born (%) - White
Place of birth - Foreign born (%) - Black or African American
Place of birth - Foreign born (%) - Asian
Place of birth - Foreign born (%) - Hispanic or Latino
Place of birth - Foreign born (%) - American Indian and Alaska Native
Place of birth - Foreign born (%) - Multirace
Place of birth - Foreign born (%) - Other Race
Residents speaking English at home (%)
Residents speaking English at home - Born in the United States (%)
Residents speaking English at home - Native, born elsewhere (%)
Residents speaking English at home - Foreign born (%)
Residents speaking Spanish at home (%)
Residents speaking Spanish at home - Born in the United States (%)
Residents speaking Spanish at home - Native, born elsewhere (%)
Residents speaking Spanish at home - Foreign born (%)
Residents speaking other language at home (%)
Residents speaking other language at home - Born in the United States (%)
Residents speaking other language at home - Native, born elsewhere (%)
Residents speaking other language at home - Foreign born (%)
Marital status - Never married (%)
Marital status - Now married (%)
Marital status - Separated (%)
Marital status - Widowed (%)
Marital status - Divorced (%)
Ancestries Reported - Arab (%)
Ancestries Reported - Czech (%)
Ancestries Reported - Danish (%)
Ancestries Reported - Dutch (%)
Ancestries Reported - English (%)
Ancestries Reported - French (%)
Ancestries Reported - French Canadian (%)
Ancestries Reported - German (%)
Ancestries Reported - Greek (%)
Ancestries Reported - Hungarian (%)
Ancestries Reported - Irish (%)
Ancestries Reported - Italian (%)
Ancestries Reported - Lithuanian (%)
Ancestries Reported - Norwegian (%)
Ancestries Reported - Polish (%)
Ancestries Reported - Portuguese (%)
Ancestries Reported - Russian (%)
Ancestries Reported - Scotch-Irish (%)
Ancestries Reported - Scottish (%)
Ancestries Reported - Slovak (%)
Ancestries Reported - Subsaharan African (%)
Ancestries Reported - Swedish (%)
Ancestries Reported - Swiss (%)
Ancestries Reported - Ukrainian (%)
Ancestries Reported - United States (%)
Ancestries Reported - Welsh (%)
Ancestries Reported - West Indian (%)
Ancestries Reported - Other (%)
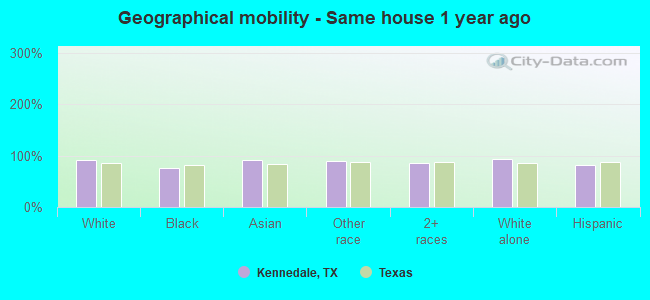
Geographical mobility - Same house 1 year ago (%)
Geographical mobility - Same house 1 year ago (%) - White
Geographical mobility - Same house 1 year ago (%) - Black or African American
Geographical mobility - Same house 1 year ago (%) - Asian
Geographical mobility - Same house 1 year ago (%) - Hispanic or Latino
Geographical mobility - Same house 1 year ago (%) - American Indian and Alaska Native
Geographical mobility - Same house 1 year ago (%) - Multirace
Geographical mobility - Same house 1 year ago (%) - Other Race
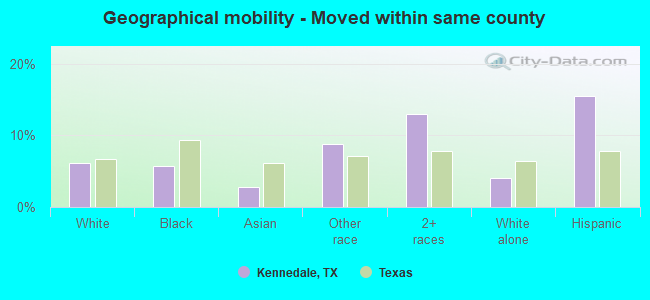
Geographical mobility - Moved within same county (%)
Geographical mobility - Moved within same county (%) - White
Geographical mobility - Moved within same county (%) - Black or African American
Geographical mobility - Moved within same county (%) - Asian
Geographical mobility - Moved within same county (%) - Hispanic or Latino
Geographical mobility - Moved within same county (%) - American Indian and Alaska Native
Geographical mobility - Moved within same county (%) - Multirace
Geographical mobility - Moved within same county (%) - Other Race
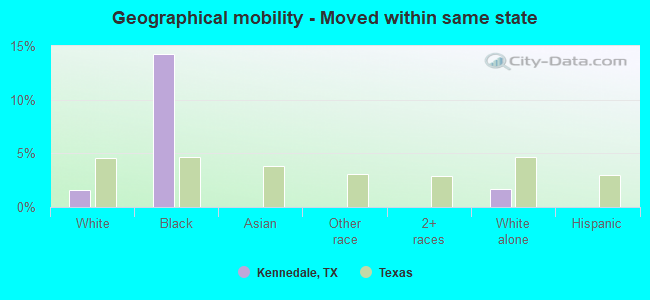
Geographical mobility - Moved from different county within same state (%)
Geographical mobility - Moved from different county within same state (%) - White
Geographical mobility - Moved from different county within same state (%) - Black or African American
Geographical mobility - Moved from different county within same state (%) - Asian
Geographical mobility - Moved from different county within same state (%) - Hispanic or Latino
Geographical mobility - Moved from different county within same state (%) - American Indian and Alaska Native
Geographical mobility - Moved from different county within same state (%) - Multirace
Geographical mobility - Moved from different county within same state (%) - Other Race
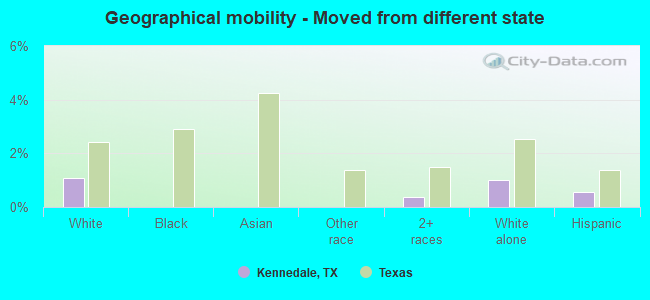
Geographical mobility - Moved from different state (%)
Geographical mobility - Moved from different state (%) - White
Geographical mobility - Moved from different state (%) - Black or African American
Geographical mobility - Moved from different state (%) - Asian
Geographical mobility - Moved from different state (%) - Hispanic or Latino
Geographical mobility - Moved from different state (%) - American Indian and Alaska Native
Geographical mobility - Moved from different state (%) - Multirace
Geographical mobility - Moved from different state (%) - Other Race
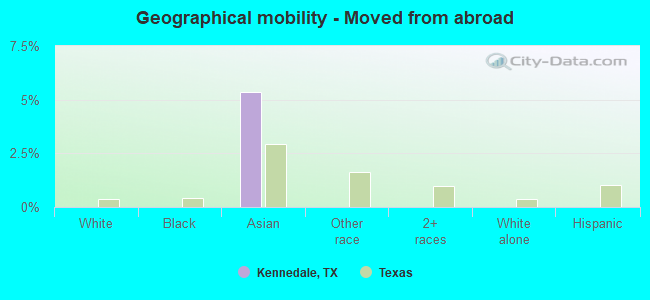
Geographical mobility - Moved from abroad (%)
Geographical mobility - Moved from abroad (%) - White
Geographical mobility - Moved from abroad (%) - Black or African American
Geographical mobility - Moved from abroad (%) - Asian
Geographical mobility - Moved from abroad (%) - Hispanic or Latino
Geographical mobility - Moved from abroad (%) - American Indian and Alaska Native
Geographical mobility - Moved from abroad (%) - Multirace
Geographical mobility - Moved from abroad (%) - Other Race
Place of birth for the foreign-born population - Ireland (%)
Place of birth for the foreign-born population - Denmark (%)
Place of birth for the foreign-born population - Norway (%)
Place of birth for the foreign-born population - Sweden (%)
Place of birth for the foreign-born population - United Kingdom (%)
Place of birth for the foreign-born population - England (%)
Place of birth for the foreign-born population - Scotland (%)
Place of birth for the foreign-born population - Other Northern Europe (%)
Place of birth for the foreign-born population - Austria (%)
Place of birth for the foreign-born population - Belgium (%)
Place of birth for the foreign-born population - France (%)
Place of birth for the foreign-born population - Germany (%)
Place of birth for the foreign-born population - Netherlands (%)
Place of birth for the foreign-born population - Switzerland (%)
Place of birth for the foreign-born population - Other Western Europe (%)
Place of birth for the foreign-born population - Greece (%)
Place of birth for the foreign-born population - Italy (%)
Place of birth for the foreign-born population - Portugal (%)
Place of birth for the foreign-born population - Spain (%)
Place of birth for the foreign-born population - Other Southern Europe (%)
Place of birth for the foreign-born population - Albania (%)
Place of birth for the foreign-born population - Belarus (%)
Place of birth for the foreign-born population - Bosnia and Herzegovina (%)
Place of birth for the foreign-born population - Bulgaria (%)
Place of birth for the foreign-born population - Croatia (%)
Place of birth for the foreign-born population - Czechoslovakia (%)
Place of birth for the foreign-born population - Hungary (%)
Place of birth for the foreign-born population - Latvia (%)
Place of birth for the foreign-born population - Lithuania (%)
Place of birth for the foreign-born population - North Macedonia (Macedonia) (%)
Place of birth for the foreign-born population - Moldova (%)
Place of birth for the foreign-born population - Poland (%)
Place of birth for the foreign-born population - Romania (%)
Place of birth for the foreign-born population - Russia (%)
Place of birth for the foreign-born population - Serbia (%)
Place of birth for the foreign-born population - Ukraine (%)
Place of birth for the foreign-born population - Other Eastern Europe (%)
Place of birth for the foreign-born population - China (%)
Place of birth for the foreign-born population - Hong Kong (%)
Place of birth for the foreign-born population - Taiwan (%)
Place of birth for the foreign-born population - Japan (%)
Place of birth for the foreign-born population - Korea (%)
Place of birth for the foreign-born population - Other Eastern Asia (%)
Place of birth for the foreign-born population - Afghanistan (%)
Place of birth for the foreign-born population - Bangladesh (%)
Place of birth for the foreign-born population - India (%)
Place of birth for the foreign-born population - Iran (%)
Place of birth for the foreign-born population - Kazakhstan (%)
Place of birth for the foreign-born population - Nepal (%)
Place of birth for the foreign-born population - Pakistan (%)
Place of birth for the foreign-born population - Sri Lanka (%)
Place of birth for the foreign-born population - Uzbekistan (%)
Place of birth for the foreign-born population - Other South Central Asia (%)
Place of birth for the foreign-born population - Burma (%)
Place of birth for the foreign-born population - Cambodia (%)
Place of birth for the foreign-born population - Indonesia (%)
Place of birth for the foreign-born population - Laos (%)
Place of birth for the foreign-born population - Malaysia (%)
Place of birth for the foreign-born population - Philippines (%)
Place of birth for the foreign-born population - Singapore (%)
Place of birth for the foreign-born population - Thailand (%)
Place of birth for the foreign-born population - Vietnam (%)
Place of birth for the foreign-born population - Other South Eastern Asia (%)
Place of birth for the foreign-born population - Armenia (%)
Place of birth for the foreign-born population - Iraq (%)
Place of birth for the foreign-born population - Israel (%)
Place of birth for the foreign-born population - Jordan (%)
Place of birth for the foreign-born population - Kuwait (%)
Place of birth for the foreign-born population - Lebanon (%)
Place of birth for the foreign-born population - Saudi Arabia (%)
Place of birth for the foreign-born population - Syria (%)
Place of birth for the foreign-born population - Turkey (%)
Place of birth for the foreign-born population - Yemen (%)
Place of birth for the foreign-born population - Other Western Asia (%)
Place of birth for the foreign-born population - Eritrea (%)
Place of birth for the foreign-born population - Ethiopia (%)
Place of birth for the foreign-born population - Kenya (%)
Place of birth for the foreign-born population - Somalia (%)
Place of birth for the foreign-born population - Uganda (%)
Place of birth for the foreign-born population - Zimbabwe (%)
Place of birth for the foreign-born population - Other Eastern Africa (%)
Place of birth for the foreign-born population - Cameroon (%)
Place of birth for the foreign-born population - Congo (%)
Place of birth for the foreign-born population - Democratic Republic of Congo (Zaire) (%)
Place of birth for the foreign-born population - Other Middle Africa (%)
Place of birth for the foreign-born population - Egypt (%)
Place of birth for the foreign-born population - Morocco (%)
Place of birth for the foreign-born population - Sudan (%)
Place of birth for the foreign-born population - Other Northern Africa (%)
Place of birth for the foreign-born population - South Africa (%)
Place of birth for the foreign-born population - Other Southern Africa (%)
Place of birth for the foreign-born population - Cabo Verde (%)
Place of birth for the foreign-born population - Ghana (%)
Place of birth for the foreign-born population - Liberia (%)
Place of birth for the foreign-born population - Nigeria (%)
Place of birth for the foreign-born population - Senegal (%)
Place of birth for the foreign-born population - Sierra Leone (%)
Place of birth for the foreign-born population - Other Western Africa (%)
Place of birth for the foreign-born population - Australia (%)
Place of birth for the foreign-born population - New Zealand (%)
Place of birth for the foreign-born population - Fiji (%)
Place of birth for the foreign-born population - Micronesia (%)
Place of birth for the foreign-born population - Bahamas (%)
Place of birth for the foreign-born population - Barbados (%)
Place of birth for the foreign-born population - Cuba (%)
Place of birth for the foreign-born population - Dominica (%)
Place of birth for the foreign-born population - Dominican Republic (%)
Place of birth for the foreign-born population - Grenada (%)
Place of birth for the foreign-born population - Haiti (%)
Place of birth for the foreign-born population - Jamaica (%)
Place of birth for the foreign-born population - St. Vincent and the Grenadines (%)
Place of birth for the foreign-born population - Trinidad and Tobago (%)
Place of birth for the foreign-born population - West Indies (%)
Place of birth for the foreign-born population - Other Caribbean (%)
Place of birth for the foreign-born population - Belize (%)
Place of birth for the foreign-born population - Costa Rica (%)
Place of birth for the foreign-born population - El Salvador (%)
Place of birth for the foreign-born population - Guatemala (%)
Place of birth for the foreign-born population - Honduras (%)
Place of birth for the foreign-born population - Mexico (%)
Place of birth for the foreign-born population - Nicaragua (%)
Place of birth for the foreign-born population - Panama (%)
Place of birth for the foreign-born population - Other Central America (%)
Place of birth for the foreign-born population - Argentina (%)
Place of birth for the foreign-born population - Bolivia (%)
Place of birth for the foreign-born population - Brazil (%)
Place of birth for the foreign-born population - Chile (%)
Place of birth for the foreign-born population - Colombia (%)
Place of birth for the foreign-born population - Ecuador (%)
Place of birth for the foreign-born population - Guyana (%)
Place of birth for the foreign-born population - Peru (%)
Place of birth for the foreign-born population - Uruguay (%)
Place of birth for the foreign-born population - Venezuela (%)
Place of birth for the foreign-born population - Other South America (%)
Place of birth for the foreign-born population - Canada (%)
Place of birth for the foreign-born population - Other Northern America (%)
Place of birth for the foreign-born population - Other (%)
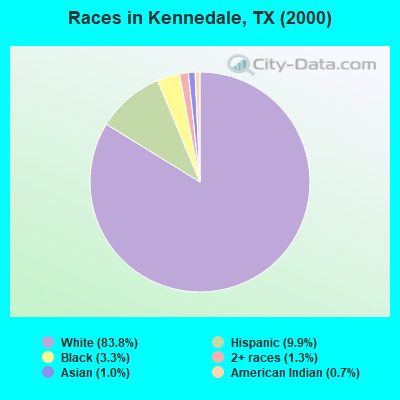
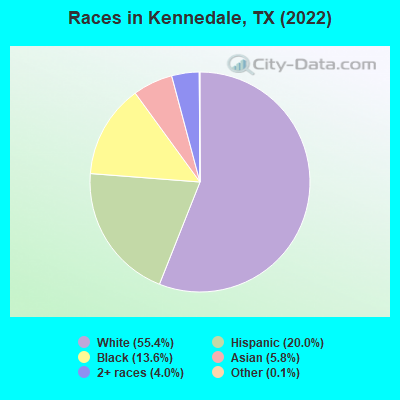
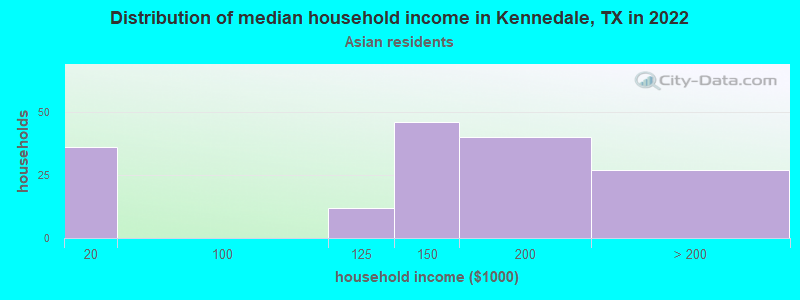
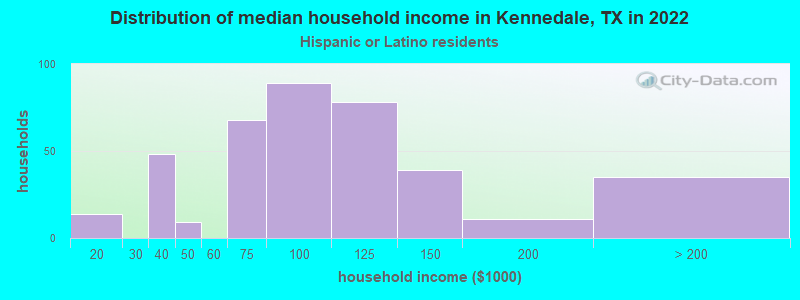
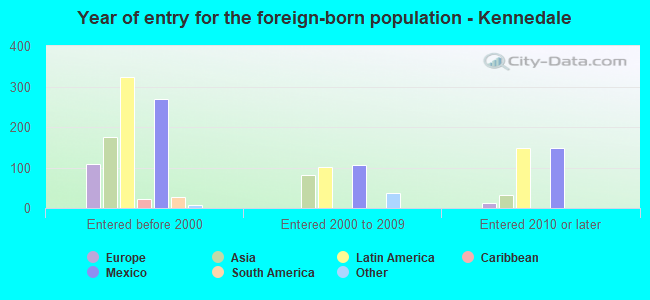
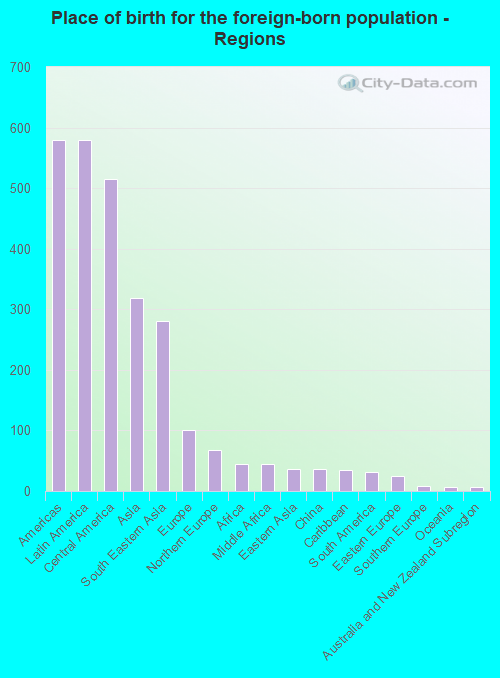
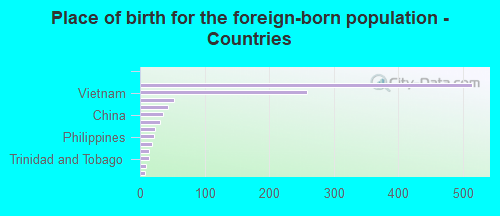
According to 2022 data, the most numerous races in Kennedale, TX are Hispanic (1,751 residents), White alone (4,848 residents), and Black alone (1,195 residents). 78.0% of Kennedale residents speak English at home. 12.0% of Kennedale, TX residents are foreign-born (6.5% born in Latin America, 3.6% born in Asia), which is 41.6% less than the foreign-born rate of 17.0% across the entire state of Texas.
Race distribution in Kennedale
2000 2022
10,933,313 52.4% White alone 6,669,666 32.0% Hispanic 2,364,255 11.3% Black alone 554,445 2.7% Asian alone 230,567 1.1% Two or more races 68,859 0.3% American Indian alone 19,958 0.10% Other race alone 10,757 0.05% Native Hawaiian and Other
12,070,642 40.2% Hispanic 11,683,430 38.9% White alone 3,508,706 11.7% Black alone 1,608,173 5.4% Asian alone 956,560 3.2% Two or more races 125,763 0.4% Other race alone 47,023 0.2% American Indian alone 29,275 0.10% Native Hawaiian and Other
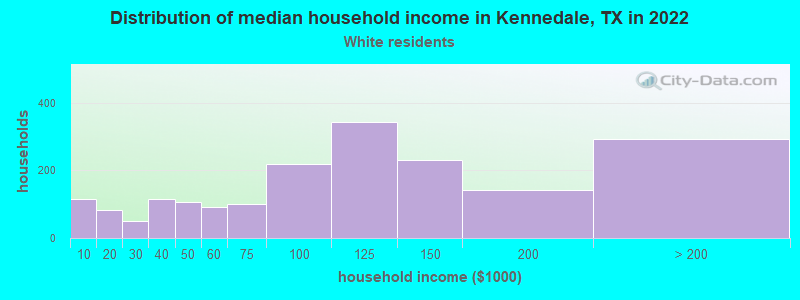
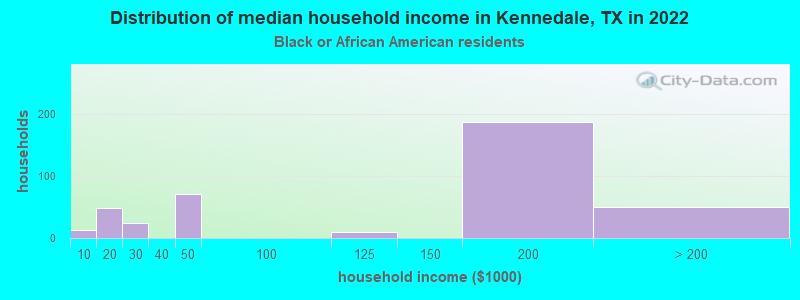
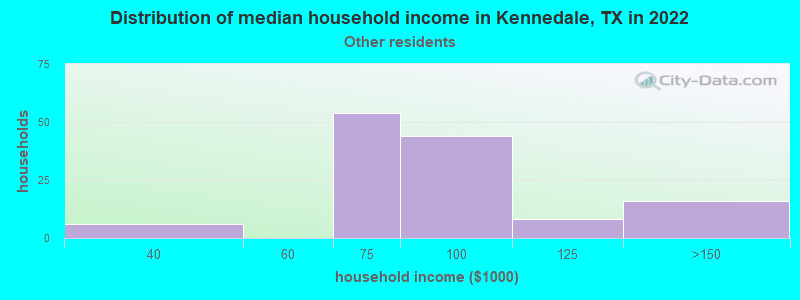
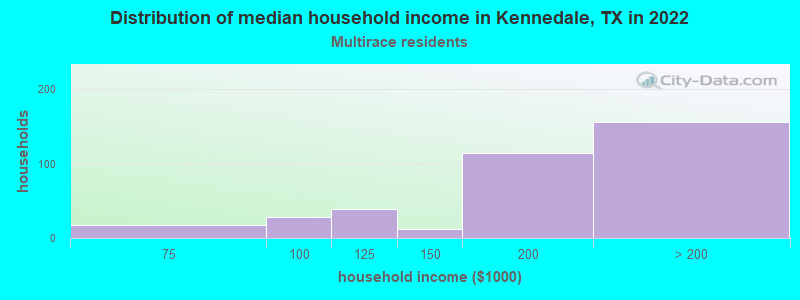
Income and house value in Kennedale Median household income in 2022 $107,385 White non-Hispanic householders$148,852 Asian householders$92,272 Some other race householders$162,373 Two or more races householders$94,183 Hispanic or Latino race householdersMedian 2022 house value $404,824 White Non-Hispanic householders$712,851 Black or African American householders $266,601 Asian householdersover $1,000,000 Some other race householders$389,648 Two or more races householders$743,613 Hispanic or Latino householders
Median age by race in Kennedale
47.2 Median age for White residents45.7 50.4 38.7 Median age for Black or African American residents26.1 41.2 -831,349,205.5 Median age for American Indian / Alaska Native residents-867,996,200.5 -763,406,939.3 47.8 Median age for Asian residents50.5 40.5 -565,040,649.8 Median age for Native Hawaiian / Pacific Islander residents-550,102,248.9 -551,928,782.8 29.1 Median age for Other race residents27.4 29.7 45.4 Median age for Two or more races residents46.5 38.8 48.9 Median age for White alone residents45.6 50.2 28.3 Median age for Hispanic or Latino residents30.3 26.1
Owner/renter occupied households by race in Kennedale
House owners and renters - White residents 1,327 70.6% Owner occupied554 29.4% Renter occupiedHouse owners and renters - Black or African American residents 251 64.9% Owner occupied136 35.1% Renter occupiedHouse owners and renters - Asian residents 157 100.0% Owner occupiedHouse owners and renters - Other race residents 86 59.7% Owner occupied58 40.3% Renter occupiedHouse owners and renters - Two or more races residents 370 100.0% Owner occupiedHouse owners and renters - White alone residents 1,338 70.5% Owner occupied559 29.5% Renter occupiedHouse owners and renters - Hispanic or Latino residents 272 66.0% Owner occupied140 34.0% Renter occupied
Language usage in Kennedale
English speakers - Total 78.0% of residents of Kennedale speak English at home.
14.1% of residents speak Spanish at home 723 61.5% Speak English very well453 38.5% Speak English less than very well7.5% of residents speak other language at home 330 52.5% Speak English very well298 47.5% Speak English less than very well
English speakers - Born in the United States 89.4% of residents of Kennedale speak English at home.
8.4% of residents speak Spanish at home 141 74.2% Speak English very well49 25.8% Speak English less than very well2.3% of residents speak other language at home 9 17.3% Speak English very well43 82.7% Speak English less than very well
English speakers - Native, born elsewhere 49.0% of residents of Kennedale speak English at home.
28.1% of residents speak Spanish at home 43 100.0% Speak English very well22.2% of residents speak other language at home 27 79.4% Speak English very well7 20.6% Speak English less than very well
English speakers - Foreign-born 4.5% of residents of Kennedale speak English at home.
54.2% of residents speak Spanish at home 155 27.7% Speak English very well405 72.3% Speak English less than very well40.8% of residents speak other language at home 173 41.1% Speak English very well248 58.9% Speak English less than very well
White (Caucasian) - Speak only English Native:
96.3% (4,638)Foreign-born:
25.3% (29)
White (Caucasian) - Speak another language Native:
5.0% (240)Foreign-born:
74.5% (86)
Asian - Speak only English Native:
24.1% (42)Foreign-born:
4.9% (17)
Asian - Speak another language Native:
69.3% (122)Foreign-born:
94.3% (320)
Other race - Speak another language Native:
73.3% (148)Foreign-born:
97.6% (270)
Two or more races - Speak another language Native:
13.8% (105)Foreign-born:
100.0% (165)
White alone - Speak only English Native:
98.1% (4,517)Foreign-born:
37.3% (32)
White alone - Speak another language Native:
1.9% (89)Foreign-born:
62.4% (54)
Hispanic or Latino - Speak another language Native:
55.1% (575)Foreign-born:
100.0% (561)
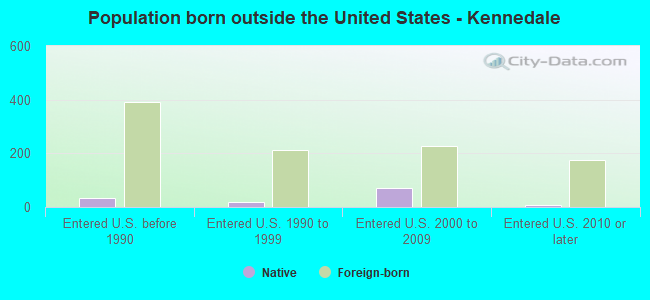
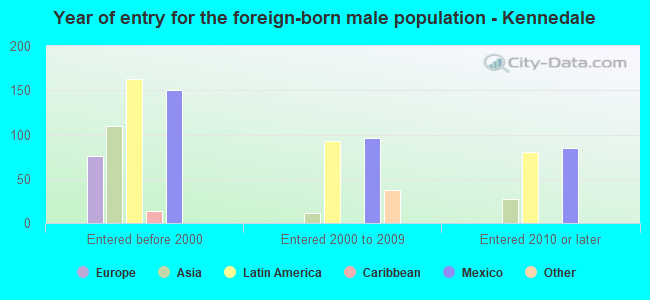
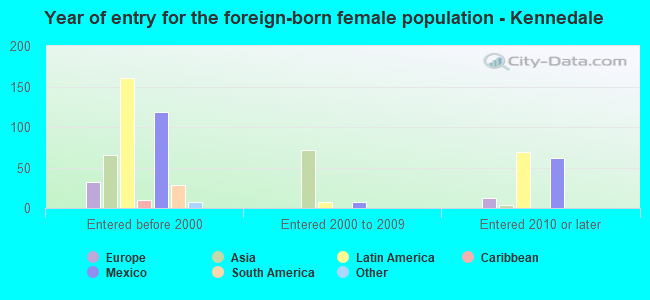
Foreign-born residents in Kennedale 1,051 residents are foreign born (6.5% Latin America , 3.6% Asia ).
This city:
12.0%Texas:
17.1%
Marital status for residents in Kennedale Marital status - White (Caucasian) population 15 years and over
Males 27.6% Never married50.2% Now married0.5% Separated4.3% Widowed17.3% DivorcedFemales 20.5% Never married58.0% Now married0.4% Separated8.4% Widowed12.6% DivorcedWomen who gave birth in the past 12 months Now married:
100.0% (19)Unmarried:
0.0% (0)
Women who did not give birth in the past 12 months Now married:
50.3% (486)Unmarried:
49.7% (480)
Marital status - Black or African American population 15 years and over
Males 27.4% Never married69.2% Now married0.0% Separated3.4% Widowed0.0% DivorcedFemales 22.0% Never married46.1% Now married4.2% Separated12.4% Widowed15.3% DivorcedWomen who did not give birth in the past 12 months Now married:
48.2% (173)Unmarried:
51.8% (185)
Marital status - Asian population 15 years and over
Males 25.9% Never married74.1% Now married0.0% Separated0.0% Widowed0.0% DivorcedFemales 0.0% Never married83.8% Now married0.0% Separated0.0% Widowed16.2% DivorcedWomen who did not give birth in the past 12 months Now married:
71.7% (70)Unmarried:
28.3% (28)
Marital status - Other race population 15 years and over
Males 54.5% Never married38.2% Now married0.0% Separated7.2% Widowed0.0% DivorcedFemales 6.1% Never married93.9% Now married0.0% Separated0.0% Widowed0.0% DivorcedWomen who gave birth in the past 12 months Now married:
100.0% (51)Unmarried:
0.0% (0)
Women who did not give birth in the past 12 months Now married:
0.0% (0)Unmarried:
100.0% (8)
Marital status - Two or more races population 15 years and over
Males 35.2% Never married63.9% Now married0.0% Separated0.0% Widowed0.9% DivorcedFemales 6.2% Never married81.4% Now married0.0% Separated0.0% Widowed12.4% DivorcedWomen who did not give birth in the past 12 months Now married:
100.0% (173)Unmarried:
0.0% (0)
Marital status - White alone, not Hispanic / Latino population 15 years and over
Males 26.5% Never married50.8% Now married0.6% Separated4.8% Widowed17.3% DivorcedFemales 16.4% Never married59.5% Now married0.0% Separated9.6% Widowed14.5% DivorcedWomen who gave birth in the past 12 months Now married:
100.0% (12)Unmarried:
0.0% (0)
Women who did not give birth in the past 12 months Now married:
53.9% (477)Unmarried:
46.1% (409)
Marital status - Hispanic or Latino population 15 years and over
Males 43.5% Never married47.0% Now married0.0% Separated3.9% Widowed5.5% DivorcedFemales 31.1% Never married66.7% Now married2.1% Separated0.0% Widowed0.2% DivorcedWomen who gave birth in the past 12 months Now married:
100.0% (67)Unmarried:
0.0% (0)
Women who did not give birth in the past 12 months Now married:
46.6% (130)Unmarried:
53.4% (149)
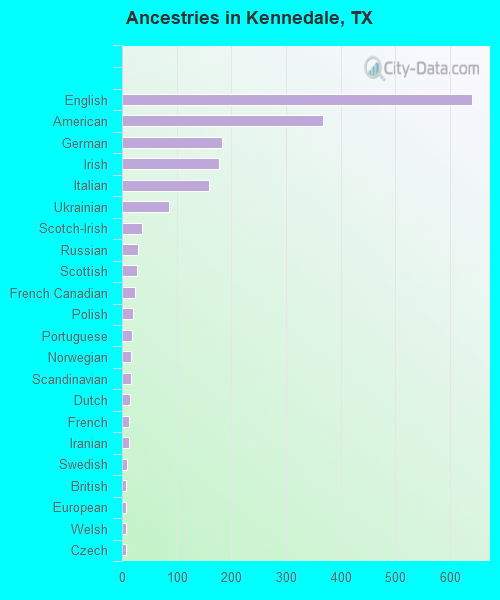
Ancestries in Kennedale
639 14.7% English367 8.4% American182 4.2% German178 4.1% Irish159 3.6% Italian86 2.0% Ukrainian36 0.8% Scotch-Irish30 0.7% Russian27 0.6% Scottish24 0.6% French Canadian21 0.5% Polish19 0.4% Portuguese16 0.4% Norwegian16 0.4% Scandinavian15 0.3% Dutch13 0.3% French12 0.3% Iranian10 0.2% Swedish8 0.2% British8 0.2% European8 0.2% Welsh7 0.2% Czech
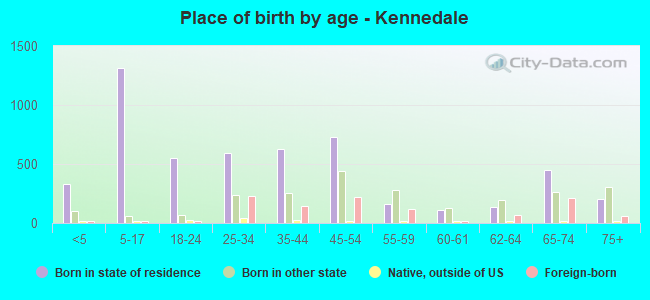
Children Nativity (place of birth) in Kennedale
Children under 6 years - Living with two parents Both parents native 273 100.0% NativeBoth parents foreign-born 51 100.0% NativeOne native, one foreign-born parent 76 100.0% NativeChildren under 6 years - Living with one parent Native parent 51 100.0% NativeChildren 6 to 17 years - Living with two parents Both parents native 656 100.0% NativeBoth parents foreign-born 181 100.0% NativeOne native, one foreign-born parent 353 100.0% NativeChildren 6 to 17 years - Living with one parent Native parent 171 100.0% NativeForeign-born parent 26 49.9% Native26 50.1% Foreign-born
Grandparents responsible for own grandchildren in Kennedale
Grandparents (30 to 59 years) White / Caucasian 3 100.0% Not responsible for grandchildrenTwo or more races 13 100.0% Not responsible for grandchildrenWhite alone, not Hispanic / Latino 4 100.0% Not responsible for grandchildrenGrandparents (60 years and over) White / Caucasian 59 60.3% Responsible for grandchildren39 39.7% Not responsible for grandchildrenTwo or more races 46 100.0% Not responsible for grandchildrenWhite alone, not Hispanic / Latino 64 61.3% Responsible for grandchildren40 38.7% Not responsible for grandchildren