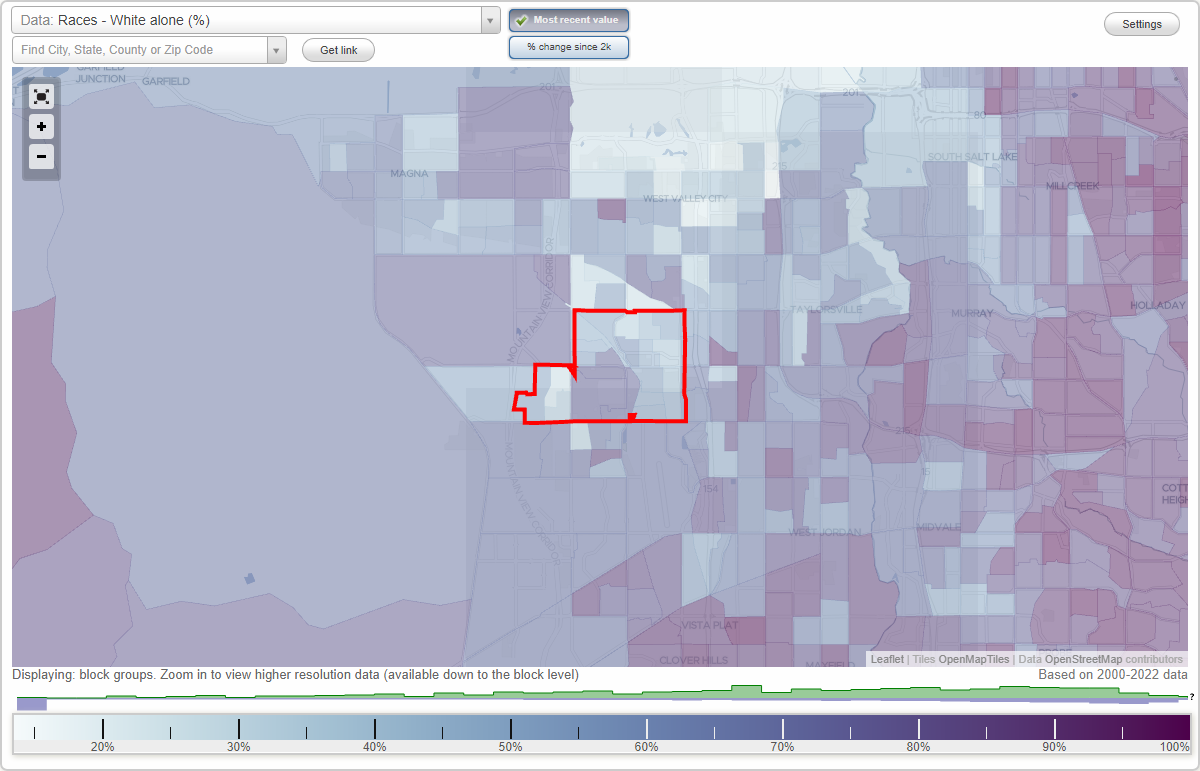
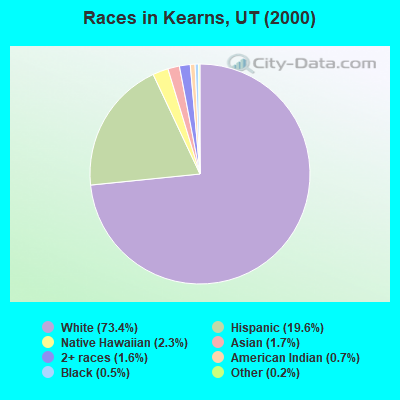
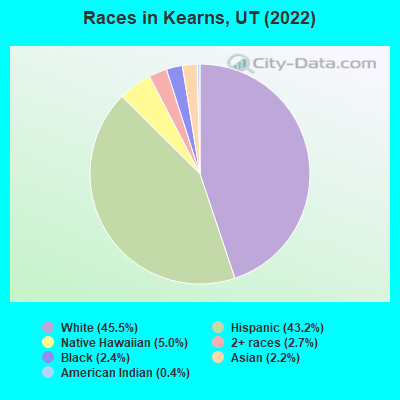
Races in Kearns, Utah (UT) Detailed Stats
Data:
Races - White alone (%)
Races - White alone (% change since 2000)
Races - Black alone (%)
Races - Black alone (% change since 2000)
Races - American Indian alone (%)
Races - American Indian alone (% change since 2000)
Races - Asian alone (%)
Races - Asian alone (% change since 2000)
Races - Hispanic (%)
Races - Hispanic (% change since 2000)
Races - Native Hawaiian and Other Pacific Islander alone (%)
Races - Native Hawaiian and Other Pacific Islander alone (% change since 2000)
Races - Two or more races(%)
Races - Two or more races(% change since 2000)
Races - Other race alone (%)
Races - Other race alone (% change since 2000)
Racial diversity
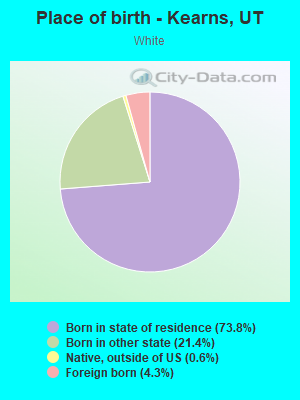
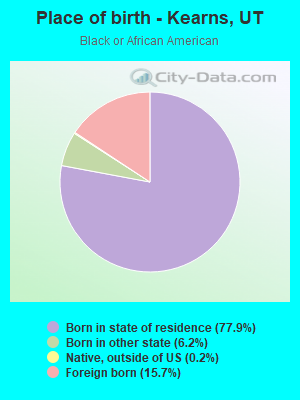
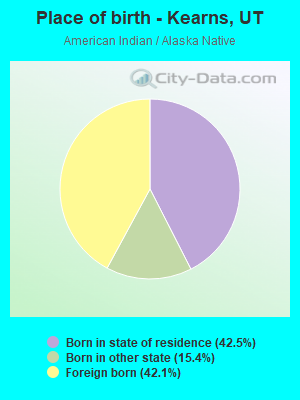
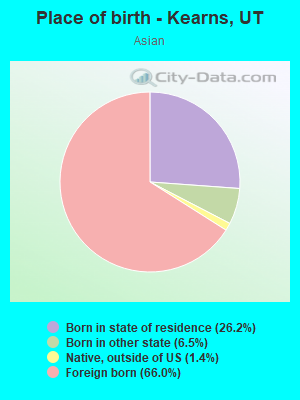
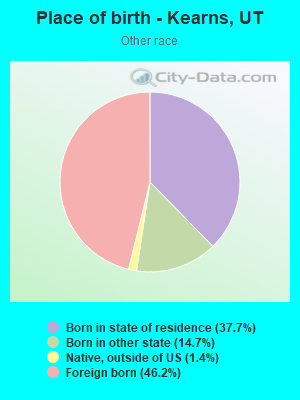
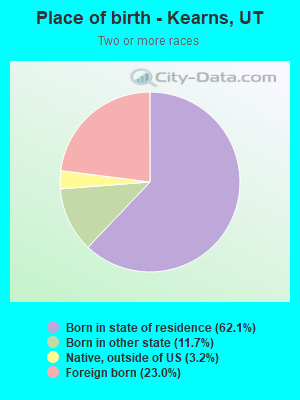
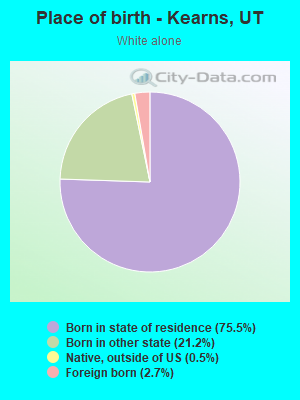
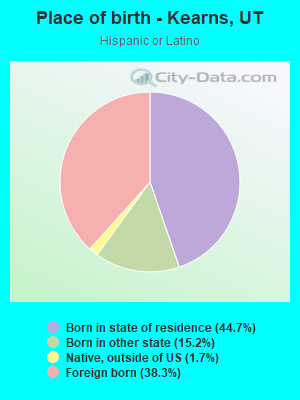
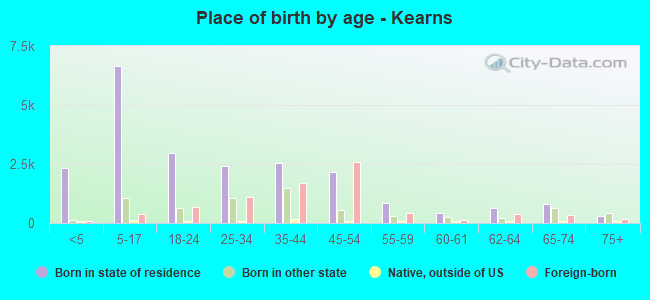
Place of birth - Born in state of residence (%)
Place of birth - Born in state of residence (%) - White
Place of birth - Born in state of residence (%) - Black or African American
Place of birth - Born in state of residence (%) - Asian
Place of birth - Born in state of residence (%) - Hispanic or Latino
Place of birth - Born in state of residence (%) - American Indian and Alaska Native
Place of birth - Born in state of residence (%) - Multirace
Place of birth - Born in state of residence (%) - Other Race
Place of birth - Born in other state (%)
Place of birth - Born in other state (%) - White
Place of birth - Born in other state (%) - Black or African American
Place of birth - Born in other state (%) - Asian
Place of birth - Born in other state (%) - Hispanic or Latino
Place of birth - Born in other state (%) - American Indian and Alaska Native
Place of birth - Born in other state (%) - Multirace
Place of birth - Born in other state (%) - Other Race
Place of birth - Native, outside of US (%)
Place of birth - Native, outside of US (%) - White
Place of birth - Native, outside of US (%) - Black or African American
Place of birth - Native, outside of US (%) - Asian
Place of birth - Native, outside of US (%) - Hispanic or Latino
Place of birth - Native, outside of US (%) - American Indian and Alaska Native
Place of birth - Native, outside of US (%) - Multirace
Place of birth - Native, outside of US (%) - Other Race
Place of birth - Foreign born (%)
Place of birth - Foreign born (%) - White
Place of birth - Foreign born (%) - Black or African American
Place of birth - Foreign born (%) - Asian
Place of birth - Foreign born (%) - Hispanic or Latino
Place of birth - Foreign born (%) - American Indian and Alaska Native
Place of birth - Foreign born (%) - Multirace
Place of birth - Foreign born (%) - Other Race
Residents speaking English at home (%)
Residents speaking English at home - Born in the United States (%)
Residents speaking English at home - Native, born elsewhere (%)
Residents speaking English at home - Foreign born (%)
Residents speaking Spanish at home (%)
Residents speaking Spanish at home - Born in the United States (%)
Residents speaking Spanish at home - Native, born elsewhere (%)
Residents speaking Spanish at home - Foreign born (%)
Residents speaking other language at home (%)
Residents speaking other language at home - Born in the United States (%)
Residents speaking other language at home - Native, born elsewhere (%)
Residents speaking other language at home - Foreign born (%)
Marital status - Never married (%)
Marital status - Now married (%)
Marital status - Separated (%)
Marital status - Widowed (%)
Marital status - Divorced (%)
Ancestries Reported - Arab (%)
Ancestries Reported - Czech (%)
Ancestries Reported - Danish (%)
Ancestries Reported - Dutch (%)
Ancestries Reported - English (%)
Ancestries Reported - French (%)
Ancestries Reported - French Canadian (%)
Ancestries Reported - German (%)
Ancestries Reported - Greek (%)
Ancestries Reported - Hungarian (%)
Ancestries Reported - Irish (%)
Ancestries Reported - Italian (%)
Ancestries Reported - Lithuanian (%)
Ancestries Reported - Norwegian (%)
Ancestries Reported - Polish (%)
Ancestries Reported - Portuguese (%)
Ancestries Reported - Russian (%)
Ancestries Reported - Scotch-Irish (%)
Ancestries Reported - Scottish (%)
Ancestries Reported - Slovak (%)
Ancestries Reported - Subsaharan African (%)
Ancestries Reported - Swedish (%)
Ancestries Reported - Swiss (%)
Ancestries Reported - Ukrainian (%)
Ancestries Reported - United States (%)
Ancestries Reported - Welsh (%)
Ancestries Reported - West Indian (%)
Ancestries Reported - Other (%)
Geographical mobility - Same house 1 year ago (%)
Geographical mobility - Same house 1 year ago (%) - White
Geographical mobility - Same house 1 year ago (%) - Black or African American
Geographical mobility - Same house 1 year ago (%) - Asian
Geographical mobility - Same house 1 year ago (%) - Hispanic or Latino
Geographical mobility - Same house 1 year ago (%) - American Indian and Alaska Native
Geographical mobility - Same house 1 year ago (%) - Multirace
Geographical mobility - Same house 1 year ago (%) - Other Race
Geographical mobility - Moved within same county (%)
Geographical mobility - Moved within same county (%) - White
Geographical mobility - Moved within same county (%) - Black or African American
Geographical mobility - Moved within same county (%) - Asian
Geographical mobility - Moved within same county (%) - Hispanic or Latino
Geographical mobility - Moved within same county (%) - American Indian and Alaska Native
Geographical mobility - Moved within same county (%) - Multirace
Geographical mobility - Moved within same county (%) - Other Race
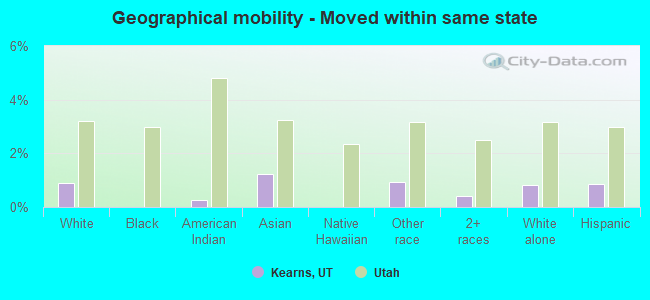
Geographical mobility - Moved from different county within same state (%)
Geographical mobility - Moved from different county within same state (%) - White
Geographical mobility - Moved from different county within same state (%) - Black or African American
Geographical mobility - Moved from different county within same state (%) - Asian
Geographical mobility - Moved from different county within same state (%) - Hispanic or Latino
Geographical mobility - Moved from different county within same state (%) - American Indian and Alaska Native
Geographical mobility - Moved from different county within same state (%) - Multirace
Geographical mobility - Moved from different county within same state (%) - Other Race
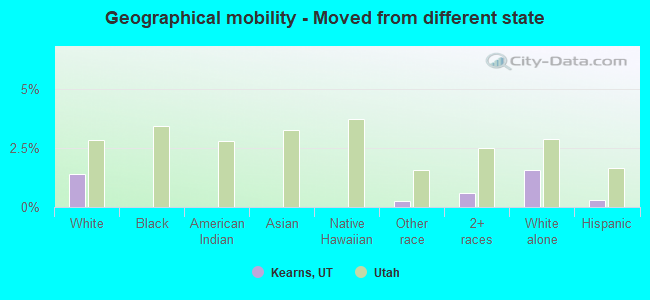
Geographical mobility - Moved from different state (%)
Geographical mobility - Moved from different state (%) - White
Geographical mobility - Moved from different state (%) - Black or African American
Geographical mobility - Moved from different state (%) - Asian
Geographical mobility - Moved from different state (%) - Hispanic or Latino
Geographical mobility - Moved from different state (%) - American Indian and Alaska Native
Geographical mobility - Moved from different state (%) - Multirace
Geographical mobility - Moved from different state (%) - Other Race
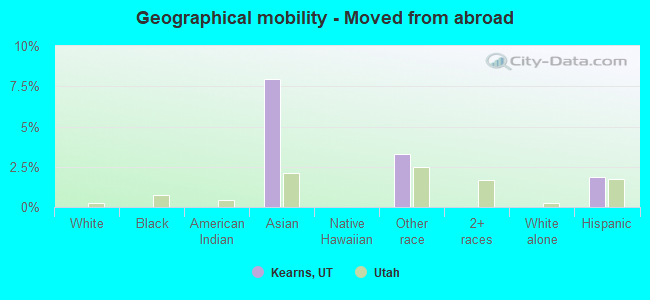
Geographical mobility - Moved from abroad (%)
Geographical mobility - Moved from abroad (%) - White
Geographical mobility - Moved from abroad (%) - Black or African American
Geographical mobility - Moved from abroad (%) - Asian
Geographical mobility - Moved from abroad (%) - Hispanic or Latino
Geographical mobility - Moved from abroad (%) - American Indian and Alaska Native
Geographical mobility - Moved from abroad (%) - Multirace
Geographical mobility - Moved from abroad (%) - Other Race
Place of birth for the foreign-born population - Ireland (%)
Place of birth for the foreign-born population - Denmark (%)
Place of birth for the foreign-born population - Norway (%)
Place of birth for the foreign-born population - Sweden (%)
Place of birth for the foreign-born population - United Kingdom (%)
Place of birth for the foreign-born population - England (%)
Place of birth for the foreign-born population - Scotland (%)
Place of birth for the foreign-born population - Other Northern Europe (%)
Place of birth for the foreign-born population - Austria (%)
Place of birth for the foreign-born population - Belgium (%)
Place of birth for the foreign-born population - France (%)
Place of birth for the foreign-born population - Germany (%)
Place of birth for the foreign-born population - Netherlands (%)
Place of birth for the foreign-born population - Switzerland (%)
Place of birth for the foreign-born population - Other Western Europe (%)
Place of birth for the foreign-born population - Greece (%)
Place of birth for the foreign-born population - Italy (%)
Place of birth for the foreign-born population - Portugal (%)
Place of birth for the foreign-born population - Spain (%)
Place of birth for the foreign-born population - Other Southern Europe (%)
Place of birth for the foreign-born population - Albania (%)
Place of birth for the foreign-born population - Belarus (%)
Place of birth for the foreign-born population - Bosnia and Herzegovina (%)
Place of birth for the foreign-born population - Bulgaria (%)
Place of birth for the foreign-born population - Croatia (%)
Place of birth for the foreign-born population - Czechoslovakia (%)
Place of birth for the foreign-born population - Hungary (%)
Place of birth for the foreign-born population - Latvia (%)
Place of birth for the foreign-born population - Lithuania (%)
Place of birth for the foreign-born population - North Macedonia (Macedonia) (%)
Place of birth for the foreign-born population - Moldova (%)
Place of birth for the foreign-born population - Poland (%)
Place of birth for the foreign-born population - Romania (%)
Place of birth for the foreign-born population - Russia (%)
Place of birth for the foreign-born population - Serbia (%)
Place of birth for the foreign-born population - Ukraine (%)
Place of birth for the foreign-born population - Other Eastern Europe (%)
Place of birth for the foreign-born population - China (%)
Place of birth for the foreign-born population - Hong Kong (%)
Place of birth for the foreign-born population - Taiwan (%)
Place of birth for the foreign-born population - Japan (%)
Place of birth for the foreign-born population - Korea (%)
Place of birth for the foreign-born population - Other Eastern Asia (%)
Place of birth for the foreign-born population - Afghanistan (%)
Place of birth for the foreign-born population - Bangladesh (%)
Place of birth for the foreign-born population - India (%)
Place of birth for the foreign-born population - Iran (%)
Place of birth for the foreign-born population - Kazakhstan (%)
Place of birth for the foreign-born population - Nepal (%)
Place of birth for the foreign-born population - Pakistan (%)
Place of birth for the foreign-born population - Sri Lanka (%)
Place of birth for the foreign-born population - Uzbekistan (%)
Place of birth for the foreign-born population - Other South Central Asia (%)
Place of birth for the foreign-born population - Burma (%)
Place of birth for the foreign-born population - Cambodia (%)
Place of birth for the foreign-born population - Indonesia (%)
Place of birth for the foreign-born population - Laos (%)
Place of birth for the foreign-born population - Malaysia (%)
Place of birth for the foreign-born population - Philippines (%)
Place of birth for the foreign-born population - Singapore (%)
Place of birth for the foreign-born population - Thailand (%)
Place of birth for the foreign-born population - Vietnam (%)
Place of birth for the foreign-born population - Other South Eastern Asia (%)
Place of birth for the foreign-born population - Armenia (%)
Place of birth for the foreign-born population - Iraq (%)
Place of birth for the foreign-born population - Israel (%)
Place of birth for the foreign-born population - Jordan (%)
Place of birth for the foreign-born population - Kuwait (%)
Place of birth for the foreign-born population - Lebanon (%)
Place of birth for the foreign-born population - Saudi Arabia (%)
Place of birth for the foreign-born population - Syria (%)
Place of birth for the foreign-born population - Turkey (%)
Place of birth for the foreign-born population - Yemen (%)
Place of birth for the foreign-born population - Other Western Asia (%)
Place of birth for the foreign-born population - Eritrea (%)
Place of birth for the foreign-born population - Ethiopia (%)
Place of birth for the foreign-born population - Kenya (%)
Place of birth for the foreign-born population - Somalia (%)
Place of birth for the foreign-born population - Uganda (%)
Place of birth for the foreign-born population - Zimbabwe (%)
Place of birth for the foreign-born population - Other Eastern Africa (%)
Place of birth for the foreign-born population - Cameroon (%)
Place of birth for the foreign-born population - Congo (%)
Place of birth for the foreign-born population - Democratic Republic of Congo (Zaire) (%)
Place of birth for the foreign-born population - Other Middle Africa (%)
Place of birth for the foreign-born population - Egypt (%)
Place of birth for the foreign-born population - Morocco (%)
Place of birth for the foreign-born population - Sudan (%)
Place of birth for the foreign-born population - Other Northern Africa (%)
Place of birth for the foreign-born population - South Africa (%)
Place of birth for the foreign-born population - Other Southern Africa (%)
Place of birth for the foreign-born population - Cabo Verde (%)
Place of birth for the foreign-born population - Ghana (%)
Place of birth for the foreign-born population - Liberia (%)
Place of birth for the foreign-born population - Nigeria (%)
Place of birth for the foreign-born population - Senegal (%)
Place of birth for the foreign-born population - Sierra Leone (%)
Place of birth for the foreign-born population - Other Western Africa (%)
Place of birth for the foreign-born population - Australia (%)
Place of birth for the foreign-born population - New Zealand (%)
Place of birth for the foreign-born population - Fiji (%)
Place of birth for the foreign-born population - Micronesia (%)
Place of birth for the foreign-born population - Bahamas (%)
Place of birth for the foreign-born population - Barbados (%)
Place of birth for the foreign-born population - Cuba (%)
Place of birth for the foreign-born population - Dominica (%)
Place of birth for the foreign-born population - Dominican Republic (%)
Place of birth for the foreign-born population - Grenada (%)
Place of birth for the foreign-born population - Haiti (%)
Place of birth for the foreign-born population - Jamaica (%)
Place of birth for the foreign-born population - St. Vincent and the Grenadines (%)
Place of birth for the foreign-born population - Trinidad and Tobago (%)
Place of birth for the foreign-born population - West Indies (%)
Place of birth for the foreign-born population - Other Caribbean (%)
Place of birth for the foreign-born population - Belize (%)
Place of birth for the foreign-born population - Costa Rica (%)
Place of birth for the foreign-born population - El Salvador (%)
Place of birth for the foreign-born population - Guatemala (%)
Place of birth for the foreign-born population - Honduras (%)
Place of birth for the foreign-born population - Mexico (%)
Place of birth for the foreign-born population - Nicaragua (%)
Place of birth for the foreign-born population - Panama (%)
Place of birth for the foreign-born population - Other Central America (%)
Place of birth for the foreign-born population - Argentina (%)
Place of birth for the foreign-born population - Bolivia (%)
Place of birth for the foreign-born population - Brazil (%)
Place of birth for the foreign-born population - Chile (%)
Place of birth for the foreign-born population - Colombia (%)
Place of birth for the foreign-born population - Ecuador (%)
Place of birth for the foreign-born population - Guyana (%)
Place of birth for the foreign-born population - Peru (%)
Place of birth for the foreign-born population - Uruguay (%)
Place of birth for the foreign-born population - Venezuela (%)
Place of birth for the foreign-born population - Other South America (%)
Place of birth for the foreign-born population - Canada (%)
Place of birth for the foreign-born population - Other Northern America (%)
Place of birth for the foreign-born population - Other (%)
Latest news about races in Kearns, UT collected exclusively by city-data.com from local newspapers, TV, and radio stations
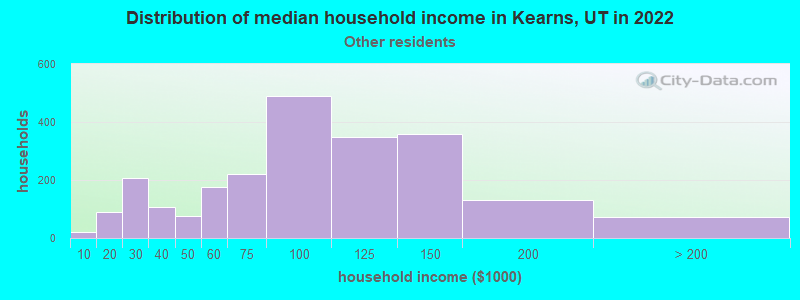
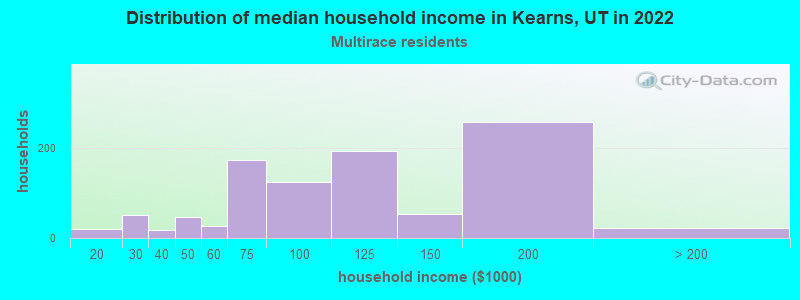
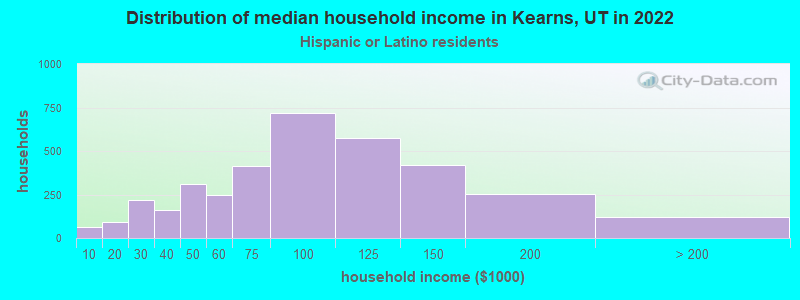
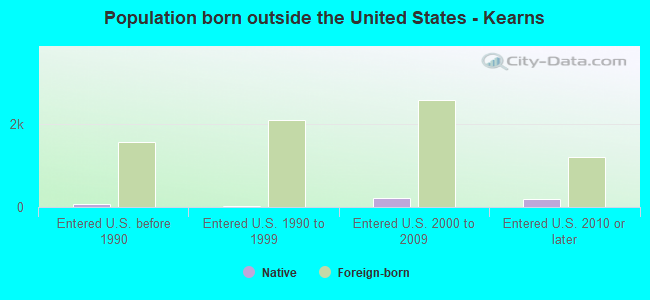
According to 2022 data, the most numerous races in Kearns, UT are White alone (16,857 residents), Hispanic (15,996 residents), and Two or more races (990 residents). 58.9% of Kearns residents speak English at home. 21.1% of Kearns, UT residents are foreign-born (15.6% born in Latin America), which is 62.1% greater than the foreign-born rate of 8.0% across the entire state of Utah.
Race distribution in Kearns
2000 2022
1,904,265 85.3% White alone 201,559 9.0% Hispanic 36,483 1.6% Asian alone 31,308 1.4% Two or more races 26,663 1.2% American Indian alone 14,806 0.7% Native Hawaiian and Other 16,137 0.7% Black alone 1,948 0.09% Other race alone
2,557,466 75.6% White alone 512,086 15.1% Hispanic 119,308 3.5% Two or more races 82,388 2.4% Asian alone 36,978 1.1% Native Hawaiian and Other 34,873 1.0% Black alone 22,803 0.7% American Indian alone 14,898 0.4% Other race alone
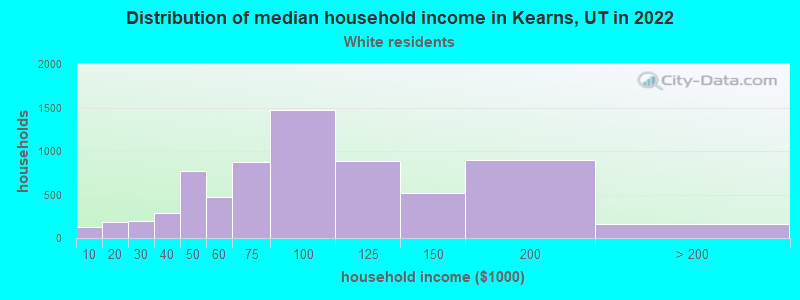
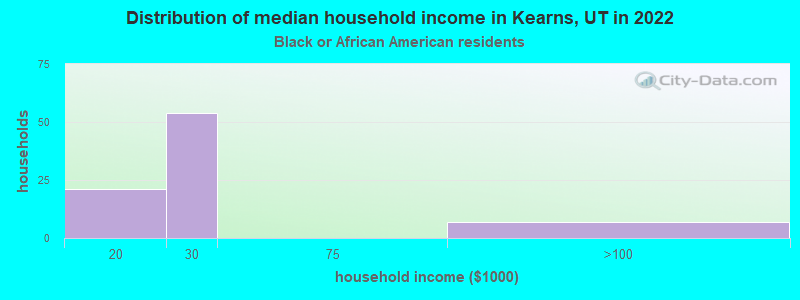
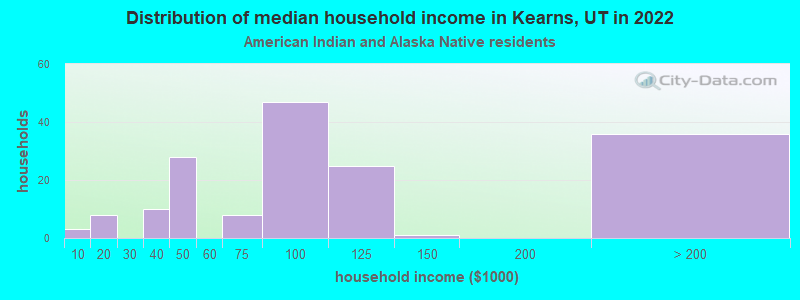
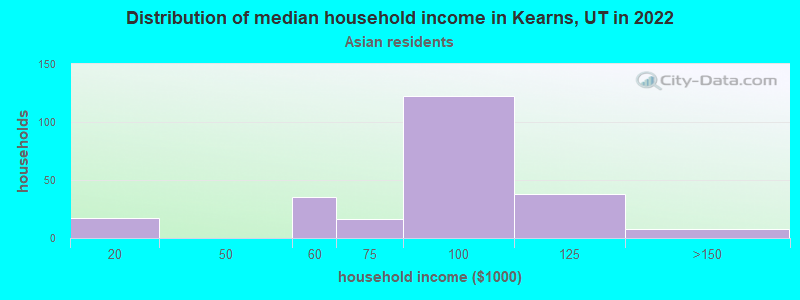
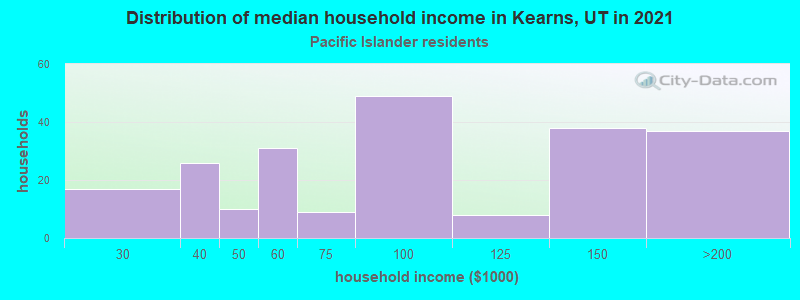
Income and house value in Kearns Median household income in 2022 $80,868 White non-Hispanic householders$41,025 Black householders$81,167 American Indian and Alaska Native householders$82,210 Asian householders$81,301 Native Hawaiian and other Pacific Islander householders$83,772 Some other race householders$109,433 Two or more races householders$81,117 Hispanic or Latino race householdersMedian 2022 house value $359,826 White Non-Hispanic householders$513,632 Black or African American householders$370,205 American Indian or Alaska Native householders $417,700 Asian householders$348,502 Native Hawaiian and other Pacific Islander householders$358,882 Some other race householders$361,398 Two or more races householders$355,737 Hispanic or Latino householders
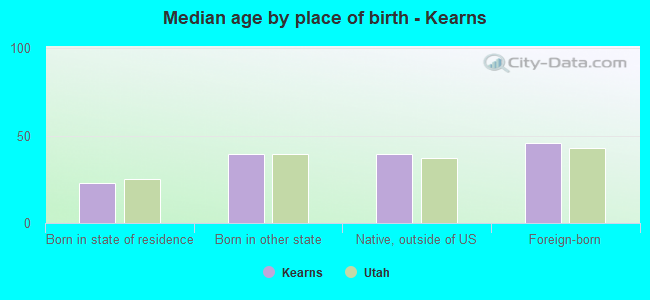
Median age by race in Kearns
38.8 Median age for White residents39.3 38.4 12.5 Median age for Black or African American residents13.8 12.7 30.4 Median age for American Indian / Alaska Native residents37.4 28.0 34.7 Median age for Asian residents49.8 26.8 24.5 Median age for Native Hawaiian / Pacific Islander residents29.5 24.7 27.1 Median age for Other race residents26.9 26.8 23.9 Median age for Two or more races residents25.5 23.5 39.3 Median age for White alone residents39.2 39.9 26.3 Median age for Hispanic or Latino residents27.2 24.3
Owner/renter occupied households by race in Kearns
House owners and renters - White residents 6,085 86.6% Owner occupied945 13.4% Renter occupiedHouse owners and renters - Black or African American residents 7 8.6% Owner occupied75 91.4% Renter occupiedHouse owners and renters - American Indian / Alaska Native residents 126 62.8% Owner occupied75 37.2% Renter occupiedHouse owners and renters - Asian residents 223 85.3% Owner occupied38 14.7% Renter occupiedHouse owners and renters - Native Hawaiian / Pacific Islander residents 226 75.4% Owner occupied74 24.6% Renter occupiedHouse owners and renters - Other race residents 1,608 68.5% Owner occupied740 31.5% Renter occupiedHouse owners and renters - Two or more races residents 792 83.2% Owner occupied160 16.8% Renter occupiedHouse owners and renters - White alone residents 5,566 88.2% Owner occupied743 11.8% Renter occupiedHouse owners and renters - Hispanic or Latino residents 2,617 70.7% Owner occupied1,084 29.3% Renter occupied
Language usage in Kearns
English speakers - Total 58.9% of residents of Kearns speak English at home.
34.5% of residents speak Spanish at home 6,803 57.2% Speak English very well5,080 42.8% Speak English less than very well7.0% of residents speak other language at home 1,706 70.4% Speak English very well716 29.6% Speak English less than very well
English speakers - Born in the United States 68.3% of residents of Kearns speak English at home.
29.8% of residents speak Spanish at home 1,802 91.9% Speak English very well159 8.1% Speak English less than very well3.4% of residents speak other language at home 151 66.8% Speak English very well75 33.2% Speak English less than very well
English speakers - Native, born elsewhere 28.0% of residents of Kearns speak English at home.
69.8% of residents speak Spanish at home 150 47.8% Speak English very well164 52.2% Speak English less than very well8.2% of residents speak other language at home 37 100.0% Speak English very well
English speakers - Foreign-born 6.5% of residents of Kearns speak English at home.
75.9% of residents speak Spanish at home 1,467 25.0% Speak English very well4,393 75.0% Speak English less than very well18.3% of residents speak other language at home 805 56.9% Speak English very well610 43.1% Speak English less than very well
White (Caucasian) - Speak only English Native:
94.8% (16,319)Foreign-born:
25.4% (205)
White (Caucasian) - Speak another language Native:
5.1% (874)Foreign-born:
72.7% (588)
Black or African American - Speak another language Native:
100.0% (526)Foreign-born:
92.8% (143)
American Indian / Alaska Native - Speak another language Native:
34.5% (127)Foreign-born:
94.0% (235)
Asian - Speak only English Native:
24.3% (45)Foreign-born:
7.1% (40)
Asian - Speak another language Native:
82.8% (154)Foreign-born:
91.9% (516)
Native Hawaiian / Pacific Islander - Speak only English Native:
53.7% (610)Foreign-born:
8.2% (42)
Native Hawaiian / Pacific Islander - Speak another language Native:
48.7% (554)Foreign-born:
96.9% (502)
Other race - Speak only English Native:
12.9% (604)Foreign-born:
6.2% (284)
Other race - Speak another language Native:
90.4% (4,248)Foreign-born:
92.7% (4,270)
Two or more races - Speak another language Native:
41.1% (1,330)Foreign-born:
100.0% (1,121)
White alone - Speak only English Native:
98.1% (15,379)Foreign-born:
45.3% (207)
White alone - Speak another language Native:
1.9% (294)Foreign-born:
53.9% (246)
Hispanic or Latino - Speak only English Native:
31.5% (2,721)Foreign-born:
4.0% (241)
Hispanic or Latino - Speak another language Native:
67.0% (5,781)Foreign-born:
95.1% (5,776)
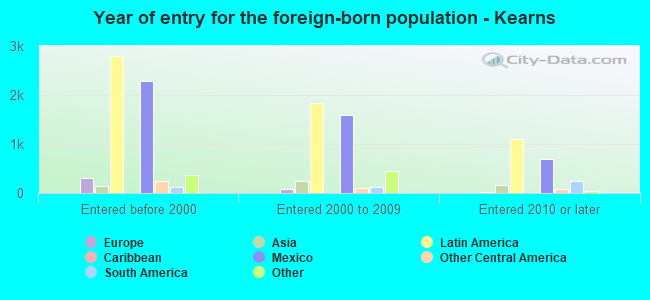
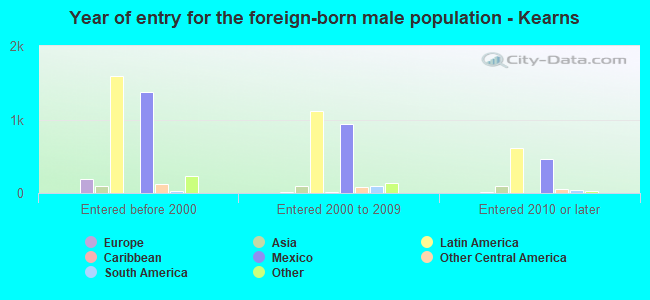
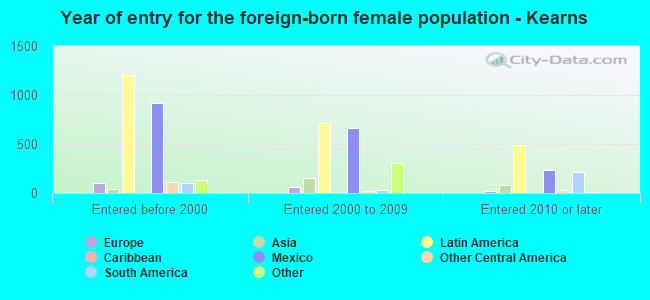
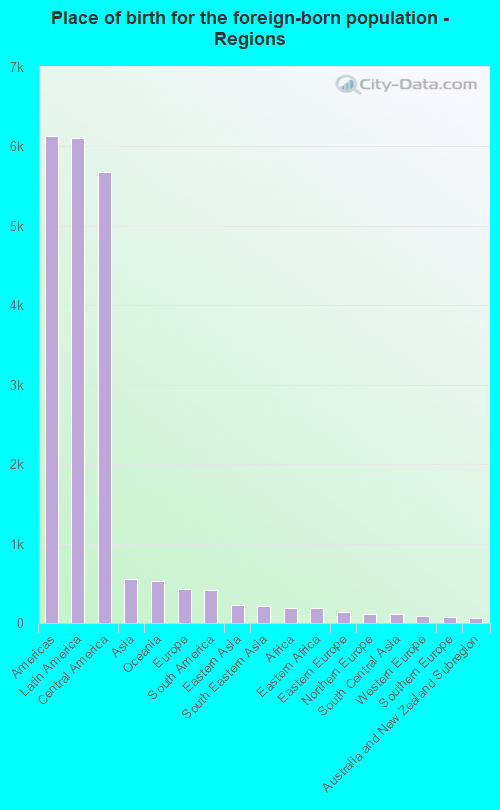
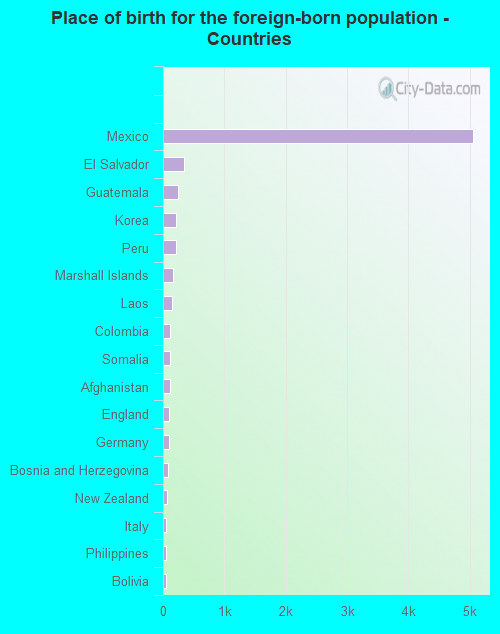
Foreign-born residents in Kearns 7,823 residents are foreign born (15.6% Latin America ).
Marital status for residents in Kearns Marital status - White (Caucasian) population 15 years and over
Males 28.1% Never married57.3% Now married1.2% Separated1.4% Widowed12.0% DivorcedFemales 25.3% Never married52.8% Now married1.3% Separated9.3% Widowed11.3% DivorcedWomen who gave birth in the past 12 months Now married:
63.3% (178)Unmarried:
36.7% (103)
Women who did not give birth in the past 12 months Now married:
50.8% (2,298)Unmarried:
49.2% (2,228)
Marital status - Black or African American population 15 years and over
Males 58.9% Never married39.9% Now married0.0% Separated0.0% Widowed1.3% DivorcedFemales 53.4% Never married35.1% Now married11.5% Separated0.0% Widowed0.0% DivorcedWomen who did not give birth in the past 12 months Now married:
45.0% (86)Unmarried:
55.0% (105)
Marital status - American Indian / Alaska Native population 15 years and over
Males 48.3% Never married20.5% Now married10.8% Separated0.0% Widowed20.5% DivorcedFemales 70.5% Never married28.8% Now married0.7% Separated0.0% Widowed0.0% DivorcedWomen who gave birth in the past 12 months Now married:
16.0% (11)Unmarried:
84.0% (56)
Women who did not give birth in the past 12 months Now married:
13.3% (32)Unmarried:
86.7% (209)
Marital status - Asian population 15 years and over
Males 7.9% Never married85.4% Now married0.0% Separated6.7% Widowed0.0% DivorcedFemales 34.8% Never married61.2% Now married0.0% Separated4.0% Widowed0.0% DivorcedWomen who did not give birth in the past 12 months Now married:
43.1% (88)Unmarried:
56.9% (116)
Marital status - Native Hawaiian / Pacific Islander population 15 years and over
Males 30.4% Never married69.6% Now married0.0% Separated0.0% Widowed0.0% DivorcedFemales 32.9% Never married55.2% Now married2.3% Separated2.9% Widowed6.8% DivorcedWomen who gave birth in the past 12 months Now married:
62.7% (48)Unmarried:
37.3% (29)
Women who did not give birth in the past 12 months Now married:
54.6% (246)Unmarried:
45.4% (205)
Marital status - Other race population 15 years and over
Males 43.7% Never married47.0% Now married3.5% Separated0.2% Widowed5.7% DivorcedFemales 42.6% Never married46.5% Now married4.5% Separated2.2% Widowed4.2% DivorcedWomen who gave birth in the past 12 months Now married:
60.3% (39)Unmarried:
39.7% (26)
Women who did not give birth in the past 12 months Now married:
48.2% (1,345)Unmarried:
51.8% (1,446)
Marital status - Two or more races population 15 years and over
Males 54.0% Never married24.4% Now married0.5% Separated3.1% Widowed18.1% DivorcedFemales 45.4% Never married33.0% Now married6.0% Separated1.6% Widowed13.9% DivorcedWomen who gave birth in the past 12 months Now married:
88.0% (87)Unmarried:
12.0% (12)
Women who did not give birth in the past 12 months Now married:
23.5% (239)Unmarried:
76.5% (780)
Marital status - White alone, not Hispanic / Latino population 15 years and over
Males 27.8% Never married60.6% Now married1.2% Separated1.6% Widowed8.8% DivorcedFemales 25.1% Never married54.1% Now married0.7% Separated8.7% Widowed11.4% DivorcedWomen who gave birth in the past 12 months Now married:
65.8% (182)Unmarried:
34.2% (94)
Women who did not give birth in the past 12 months Now married:
51.4% (2,098)Unmarried:
48.6% (1,985)
Marital status - Hispanic or Latino population 15 years and over
Males 44.5% Never married40.4% Now married2.5% Separated0.1% Widowed12.5% DivorcedFemales 42.1% Never married42.8% Now married4.2% Separated3.9% Widowed7.1% DivorcedWomen who gave birth in the past 12 months Now married:
71.3% (117)Unmarried:
28.7% (47)
Women who did not give birth in the past 12 months Now married:
42.2% (1,792)Unmarried:
57.8% (2,456)
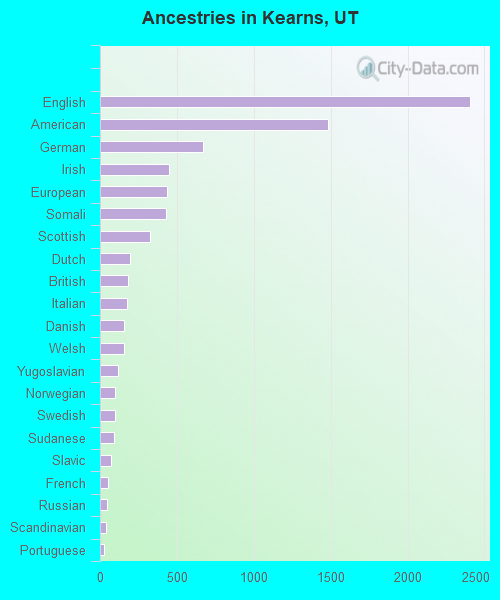
Ancestries in Kearns
2,409 10.9% English1,484 6.7% American671 3.0% German449 2.0% Irish436 2.0% European426 1.9% Somali322 1.5% Scottish193 0.9% Dutch184 0.8% British175 0.8% Italian157 0.7% Danish157 0.7% Welsh118 0.5% Yugoslavian99 0.4% Norwegian95 0.4% Swedish94 0.4% Sudanese70 0.3% Slavic55 0.2% French44 0.2% Russian39 0.2% Scandinavian24 0.1% Portuguese14 0.06% Polish14 0.06% Jamaican10 0.05% French Canadian10 0.05% New Zealander9 0.04% Swiss8 0.04% Canadian8 0.04% Scotch-Irish6 0.03% Bulgarian6 0.03% Lithuanian2 0.01% Czech
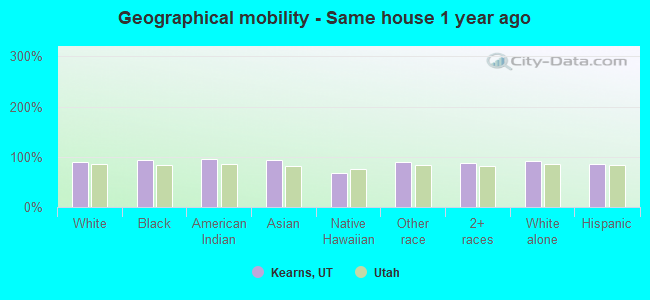
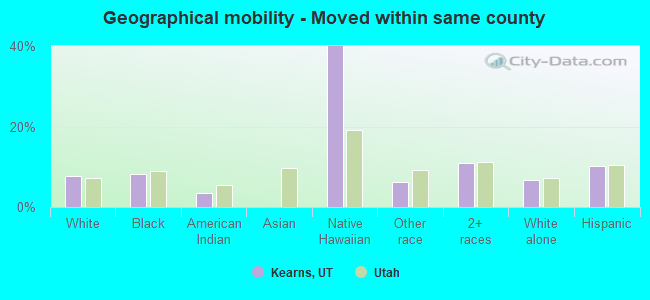
Geographical mobility in Kearns Same house 1 year ago 16,769 89.9% White (Caucasian)822 92.7% Black or African American505 95.3% American Indian / Alaska Native789 93.7% Asian1,212 67.7% Native Hawaiian / Pacific Islander8,942 90.1% Other race4,099 87.1% Two or more races15,156 91.0% White alone, not Hispanic / Latino13,461 86.2% Hispanic or LatinoMoved within same county 1,438 7.7% White / Caucasian73 8.2% Black or African American19 3.6% American Indian / Alaska Native715 40.0% Native Hawaiian / Pacific Islander610 6.1% Other race516 11.0% Two or more races1,123 6.7% White alone, not Hispanic / Latino1,587 10.2% Hispanic or LatinoMoved within same state 168 0.9% White / Caucasian1 0.3% American Indian / Alaska Native10 1.2% Asian94 0.9% Other race18 0.4% Two or more races139 0.8% White alone, not Hispanic / Latino132 0.8% Hispanic or LatinoMoved from different state 259 1.4% White / Caucasian26 0.3% Other race27 0.6% Two or more races260 1.6% White alone, not Hispanic / Latino46 0.3% Hispanic or LatinoMoved from abroad 3 0.0% White67 8.0% Asian328 3.3% Other race295 1.9% Hispanic or Latino
Children Nativity (place of birth) in Kearns
Children under 6 years - Living with two parents Both parents native 995 100.0% NativeBoth parents foreign-born 437 98.4% Native7 1.6% Foreign-bornOne native, one foreign-born parent 278 100.0% NativeChildren under 6 years - Living with one parent Native parent 742 100.0% NativeForeign-born parent 418 97.8% Native9 2.2% Foreign-bornChildren 6 to 17 years - Living with two parents Both parents native 2,408 100.0% NativeBoth parents foreign-born 1,523 91.8% Native135 8.2% Foreign-bornOne native, one foreign-born parent 368 94.9% Native20 5.1% Foreign-bornChildren 6 to 17 years - Living with one parent Native parent 1,260 100.0% NativeForeign-born parent 1,445 55.2% Native1,170 44.8% Foreign-born
Grandparents responsible for own grandchildren in Kearns
Grandparents (30 to 59 years) White / Caucasian 51 19.1% Responsible for grandchildren214 80.9% Not responsible for grandchildrenAmerican Indian / Alaska Native 45 100.0% Responsible for grandchildrenNative Hawaiian / Pacific Islander 89 71.5% Responsible for grandchildren36 28.5% Not responsible for grandchildrenOther race 393 100.0% Not responsible for grandchildrenTwo or more races 32 100.0% Not responsible for grandchildrenWhite alone, not Hispanic / Latino 28 10.7% Responsible for grandchildren233 89.3% Not responsible for grandchildrenHispanic or Latino 62 13.7% Responsible for grandchildren389 86.3% Not responsible for grandchildrenGrandparents (60 years and over) White / Caucasian 119 38.0% Responsible for grandchildren195 62.0% Not responsible for grandchildrenNative Hawaiian / Pacific Islander 150 100.0% Not responsible for grandchildrenOther race 194 100.0% Not responsible for grandchildrenTwo or more races 127 100.0% Not responsible for grandchildrenWhite alone, not Hispanic / Latino 120 37.3% Responsible for grandchildren202 62.7% Not responsible for grandchildrenHispanic or Latino 247 100.0% Not responsible for grandchildren