Races in Jersey City, New Jersey (NJ) Detailed Stats
Data:
Races - White alone (%)
Races - White alone (% change since 2000)
Races - Black alone (%)
Races - Black alone (% change since 2000)
Races - American Indian alone (%)
Races - American Indian alone (% change since 2000)
Races - Asian alone (%)
Races - Asian alone (% change since 2000)
Races - Hispanic (%)
Races - Hispanic (% change since 2000)
Races - Native Hawaiian and Other Pacific Islander alone (%)
Races - Native Hawaiian and Other Pacific Islander alone (% change since 2000)
Races - Two or more races(%)
Races - Two or more races(% change since 2000)
Races - Other race alone (%)
Races - Other race alone (% change since 2000)
Racial diversity
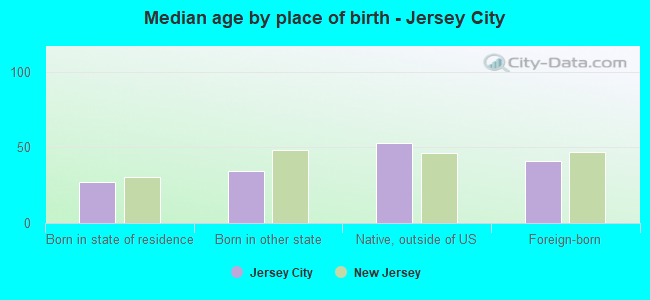
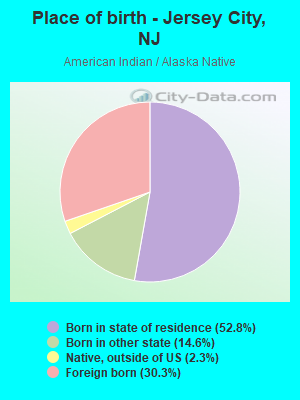
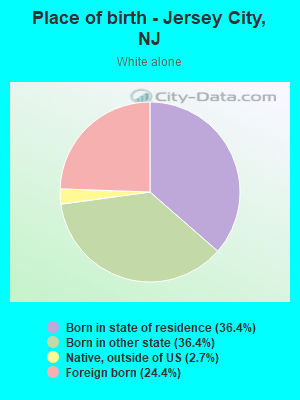
Place of birth - Born in state of residence (%)
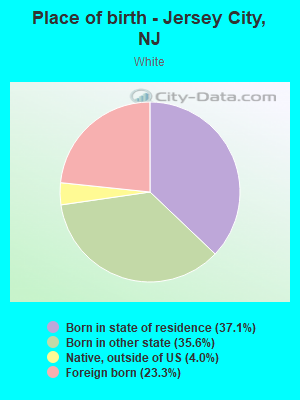
Place of birth - Born in state of residence (%) - White
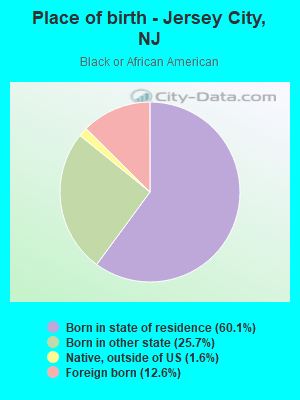
Place of birth - Born in state of residence (%) - Black or African American
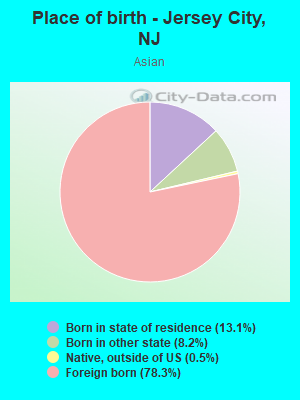
Place of birth - Born in state of residence (%) - Asian
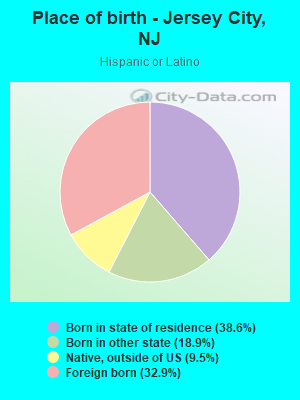
Place of birth - Born in state of residence (%) - Hispanic or Latino
Place of birth - Born in state of residence (%) - American Indian and Alaska Native
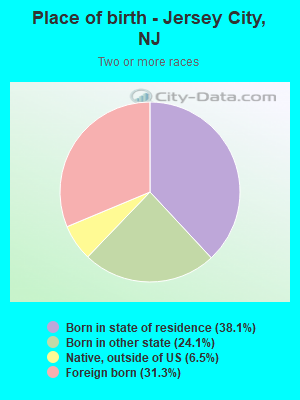
Place of birth - Born in state of residence (%) - Multirace
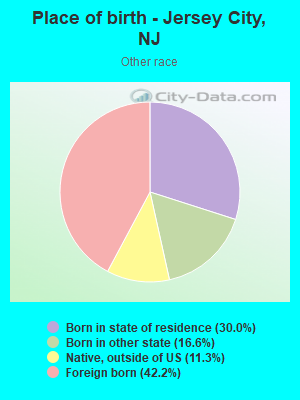
Place of birth - Born in state of residence (%) - Other Race
Place of birth - Born in other state (%)
Place of birth - Born in other state (%) - White
Place of birth - Born in other state (%) - Black or African American
Place of birth - Born in other state (%) - Asian
Place of birth - Born in other state (%) - Hispanic or Latino
Place of birth - Born in other state (%) - American Indian and Alaska Native
Place of birth - Born in other state (%) - Multirace
Place of birth - Born in other state (%) - Other Race
Place of birth - Native, outside of US (%)
Place of birth - Native, outside of US (%) - White
Place of birth - Native, outside of US (%) - Black or African American
Place of birth - Native, outside of US (%) - Asian
Place of birth - Native, outside of US (%) - Hispanic or Latino
Place of birth - Native, outside of US (%) - American Indian and Alaska Native
Place of birth - Native, outside of US (%) - Multirace
Place of birth - Native, outside of US (%) - Other Race
Place of birth - Foreign born (%)
Place of birth - Foreign born (%) - White
Place of birth - Foreign born (%) - Black or African American
Place of birth - Foreign born (%) - Asian
Place of birth - Foreign born (%) - Hispanic or Latino
Place of birth - Foreign born (%) - American Indian and Alaska Native
Place of birth - Foreign born (%) - Multirace
Place of birth - Foreign born (%) - Other Race
Residents speaking English at home (%)
Residents speaking English at home - Born in the United States (%)
Residents speaking English at home - Native, born elsewhere (%)
Residents speaking English at home - Foreign born (%)
Residents speaking Spanish at home (%)
Residents speaking Spanish at home - Born in the United States (%)
Residents speaking Spanish at home - Native, born elsewhere (%)
Residents speaking Spanish at home - Foreign born (%)
Residents speaking other language at home (%)
Residents speaking other language at home - Born in the United States (%)
Residents speaking other language at home - Native, born elsewhere (%)
Residents speaking other language at home - Foreign born (%)
Marital status - Never married (%)
Marital status - Now married (%)
Marital status - Separated (%)
Marital status - Widowed (%)
Marital status - Divorced (%)
Ancestries Reported - Arab (%)
Ancestries Reported - Czech (%)
Ancestries Reported - Danish (%)
Ancestries Reported - Dutch (%)
Ancestries Reported - English (%)
Ancestries Reported - French (%)
Ancestries Reported - French Canadian (%)
Ancestries Reported - German (%)
Ancestries Reported - Greek (%)
Ancestries Reported - Hungarian (%)
Ancestries Reported - Irish (%)
Ancestries Reported - Italian (%)
Ancestries Reported - Lithuanian (%)
Ancestries Reported - Norwegian (%)
Ancestries Reported - Polish (%)
Ancestries Reported - Portuguese (%)
Ancestries Reported - Russian (%)
Ancestries Reported - Scotch-Irish (%)
Ancestries Reported - Scottish (%)
Ancestries Reported - Slovak (%)
Ancestries Reported - Subsaharan African (%)
Ancestries Reported - Swedish (%)
Ancestries Reported - Swiss (%)
Ancestries Reported - Ukrainian (%)
Ancestries Reported - United States (%)
Ancestries Reported - Welsh (%)
Ancestries Reported - West Indian (%)
Ancestries Reported - Other (%)
Geographical mobility - Same house 1 year ago (%)
Geographical mobility - Same house 1 year ago (%) - White
Geographical mobility - Same house 1 year ago (%) - Black or African American
Geographical mobility - Same house 1 year ago (%) - Asian
Geographical mobility - Same house 1 year ago (%) - Hispanic or Latino
Geographical mobility - Same house 1 year ago (%) - American Indian and Alaska Native
Geographical mobility - Same house 1 year ago (%) - Multirace
Geographical mobility - Same house 1 year ago (%) - Other Race
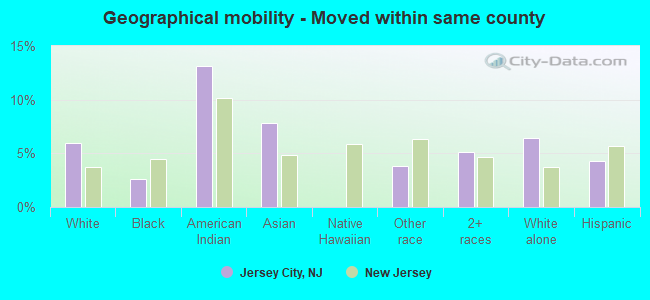
Geographical mobility - Moved within same county (%)
Geographical mobility - Moved within same county (%) - White
Geographical mobility - Moved within same county (%) - Black or African American
Geographical mobility - Moved within same county (%) - Asian
Geographical mobility - Moved within same county (%) - Hispanic or Latino
Geographical mobility - Moved within same county (%) - American Indian and Alaska Native
Geographical mobility - Moved within same county (%) - Multirace
Geographical mobility - Moved within same county (%) - Other Race
Geographical mobility - Moved from different county within same state (%)
Geographical mobility - Moved from different county within same state (%) - White
Geographical mobility - Moved from different county within same state (%) - Black or African American
Geographical mobility - Moved from different county within same state (%) - Asian
Geographical mobility - Moved from different county within same state (%) - Hispanic or Latino
Geographical mobility - Moved from different county within same state (%) - American Indian and Alaska Native
Geographical mobility - Moved from different county within same state (%) - Multirace
Geographical mobility - Moved from different county within same state (%) - Other Race
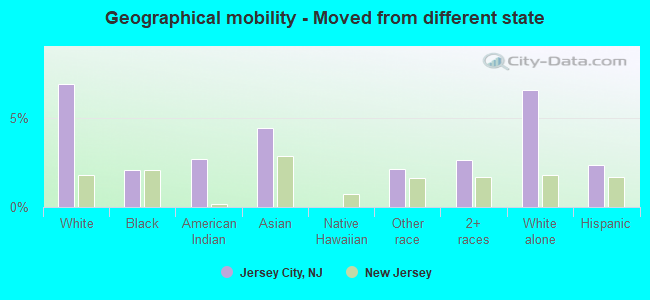
Geographical mobility - Moved from different state (%)
Geographical mobility - Moved from different state (%) - White
Geographical mobility - Moved from different state (%) - Black or African American
Geographical mobility - Moved from different state (%) - Asian
Geographical mobility - Moved from different state (%) - Hispanic or Latino
Geographical mobility - Moved from different state (%) - American Indian and Alaska Native
Geographical mobility - Moved from different state (%) - Multirace
Geographical mobility - Moved from different state (%) - Other Race
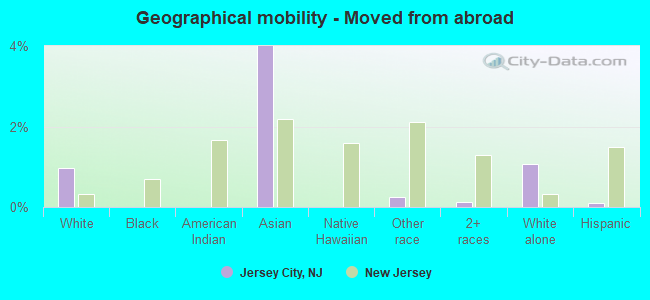
Geographical mobility - Moved from abroad (%)
Geographical mobility - Moved from abroad (%) - White
Geographical mobility - Moved from abroad (%) - Black or African American
Geographical mobility - Moved from abroad (%) - Asian
Geographical mobility - Moved from abroad (%) - Hispanic or Latino
Geographical mobility - Moved from abroad (%) - American Indian and Alaska Native
Geographical mobility - Moved from abroad (%) - Multirace
Geographical mobility - Moved from abroad (%) - Other Race
Place of birth for the foreign-born population - Ireland (%)
Place of birth for the foreign-born population - Denmark (%)
Place of birth for the foreign-born population - Norway (%)
Place of birth for the foreign-born population - Sweden (%)
Place of birth for the foreign-born population - United Kingdom (%)
Place of birth for the foreign-born population - England (%)
Place of birth for the foreign-born population - Scotland (%)
Place of birth for the foreign-born population - Other Northern Europe (%)
Place of birth for the foreign-born population - Austria (%)
Place of birth for the foreign-born population - Belgium (%)
Place of birth for the foreign-born population - France (%)
Place of birth for the foreign-born population - Germany (%)
Place of birth for the foreign-born population - Netherlands (%)
Place of birth for the foreign-born population - Switzerland (%)
Place of birth for the foreign-born population - Other Western Europe (%)
Place of birth for the foreign-born population - Greece (%)
Place of birth for the foreign-born population - Italy (%)
Place of birth for the foreign-born population - Portugal (%)
Place of birth for the foreign-born population - Spain (%)
Place of birth for the foreign-born population - Other Southern Europe (%)
Place of birth for the foreign-born population - Albania (%)
Place of birth for the foreign-born population - Belarus (%)
Place of birth for the foreign-born population - Bosnia and Herzegovina (%)
Place of birth for the foreign-born population - Bulgaria (%)
Place of birth for the foreign-born population - Croatia (%)
Place of birth for the foreign-born population - Czechoslovakia (%)
Place of birth for the foreign-born population - Hungary (%)
Place of birth for the foreign-born population - Latvia (%)
Place of birth for the foreign-born population - Lithuania (%)
Place of birth for the foreign-born population - North Macedonia (Macedonia) (%)
Place of birth for the foreign-born population - Moldova (%)
Place of birth for the foreign-born population - Poland (%)
Place of birth for the foreign-born population - Romania (%)
Place of birth for the foreign-born population - Russia (%)
Place of birth for the foreign-born population - Serbia (%)
Place of birth for the foreign-born population - Ukraine (%)
Place of birth for the foreign-born population - Other Eastern Europe (%)
Place of birth for the foreign-born population - China (%)
Place of birth for the foreign-born population - Hong Kong (%)
Place of birth for the foreign-born population - Taiwan (%)
Place of birth for the foreign-born population - Japan (%)
Place of birth for the foreign-born population - Korea (%)
Place of birth for the foreign-born population - Other Eastern Asia (%)
Place of birth for the foreign-born population - Afghanistan (%)
Place of birth for the foreign-born population - Bangladesh (%)
Place of birth for the foreign-born population - India (%)
Place of birth for the foreign-born population - Iran (%)
Place of birth for the foreign-born population - Kazakhstan (%)
Place of birth for the foreign-born population - Nepal (%)
Place of birth for the foreign-born population - Pakistan (%)
Place of birth for the foreign-born population - Sri Lanka (%)
Place of birth for the foreign-born population - Uzbekistan (%)
Place of birth for the foreign-born population - Other South Central Asia (%)
Place of birth for the foreign-born population - Burma (%)
Place of birth for the foreign-born population - Cambodia (%)
Place of birth for the foreign-born population - Indonesia (%)
Place of birth for the foreign-born population - Laos (%)
Place of birth for the foreign-born population - Malaysia (%)
Place of birth for the foreign-born population - Philippines (%)
Place of birth for the foreign-born population - Singapore (%)
Place of birth for the foreign-born population - Thailand (%)
Place of birth for the foreign-born population - Vietnam (%)
Place of birth for the foreign-born population - Other South Eastern Asia (%)
Place of birth for the foreign-born population - Armenia (%)
Place of birth for the foreign-born population - Iraq (%)
Place of birth for the foreign-born population - Israel (%)
Place of birth for the foreign-born population - Jordan (%)
Place of birth for the foreign-born population - Kuwait (%)
Place of birth for the foreign-born population - Lebanon (%)
Place of birth for the foreign-born population - Saudi Arabia (%)
Place of birth for the foreign-born population - Syria (%)
Place of birth for the foreign-born population - Turkey (%)
Place of birth for the foreign-born population - Yemen (%)
Place of birth for the foreign-born population - Other Western Asia (%)
Place of birth for the foreign-born population - Eritrea (%)
Place of birth for the foreign-born population - Ethiopia (%)
Place of birth for the foreign-born population - Kenya (%)
Place of birth for the foreign-born population - Somalia (%)
Place of birth for the foreign-born population - Uganda (%)
Place of birth for the foreign-born population - Zimbabwe (%)
Place of birth for the foreign-born population - Other Eastern Africa (%)
Place of birth for the foreign-born population - Cameroon (%)
Place of birth for the foreign-born population - Congo (%)
Place of birth for the foreign-born population - Democratic Republic of Congo (Zaire) (%)
Place of birth for the foreign-born population - Other Middle Africa (%)
Place of birth for the foreign-born population - Egypt (%)
Place of birth for the foreign-born population - Morocco (%)
Place of birth for the foreign-born population - Sudan (%)
Place of birth for the foreign-born population - Other Northern Africa (%)
Place of birth for the foreign-born population - South Africa (%)
Place of birth for the foreign-born population - Other Southern Africa (%)
Place of birth for the foreign-born population - Cabo Verde (%)
Place of birth for the foreign-born population - Ghana (%)
Place of birth for the foreign-born population - Liberia (%)
Place of birth for the foreign-born population - Nigeria (%)
Place of birth for the foreign-born population - Senegal (%)
Place of birth for the foreign-born population - Sierra Leone (%)
Place of birth for the foreign-born population - Other Western Africa (%)
Place of birth for the foreign-born population - Australia (%)
Place of birth for the foreign-born population - New Zealand (%)
Place of birth for the foreign-born population - Fiji (%)
Place of birth for the foreign-born population - Micronesia (%)
Place of birth for the foreign-born population - Bahamas (%)
Place of birth for the foreign-born population - Barbados (%)
Place of birth for the foreign-born population - Cuba (%)
Place of birth for the foreign-born population - Dominica (%)
Place of birth for the foreign-born population - Dominican Republic (%)
Place of birth for the foreign-born population - Grenada (%)
Place of birth for the foreign-born population - Haiti (%)
Place of birth for the foreign-born population - Jamaica (%)
Place of birth for the foreign-born population - St. Vincent and the Grenadines (%)
Place of birth for the foreign-born population - Trinidad and Tobago (%)
Place of birth for the foreign-born population - West Indies (%)
Place of birth for the foreign-born population - Other Caribbean (%)
Place of birth for the foreign-born population - Belize (%)
Place of birth for the foreign-born population - Costa Rica (%)
Place of birth for the foreign-born population - El Salvador (%)
Place of birth for the foreign-born population - Guatemala (%)
Place of birth for the foreign-born population - Honduras (%)
Place of birth for the foreign-born population - Mexico (%)
Place of birth for the foreign-born population - Nicaragua (%)
Place of birth for the foreign-born population - Panama (%)
Place of birth for the foreign-born population - Other Central America (%)
Place of birth for the foreign-born population - Argentina (%)
Place of birth for the foreign-born population - Bolivia (%)
Place of birth for the foreign-born population - Brazil (%)
Place of birth for the foreign-born population - Chile (%)
Place of birth for the foreign-born population - Colombia (%)
Place of birth for the foreign-born population - Ecuador (%)
Place of birth for the foreign-born population - Guyana (%)
Place of birth for the foreign-born population - Peru (%)
Place of birth for the foreign-born population - Uruguay (%)
Place of birth for the foreign-born population - Venezuela (%)
Place of birth for the foreign-born population - Other South America (%)
Place of birth for the foreign-born population - Canada (%)
Place of birth for the foreign-born population - Other Northern America (%)
Place of birth for the foreign-born population - Other (%)
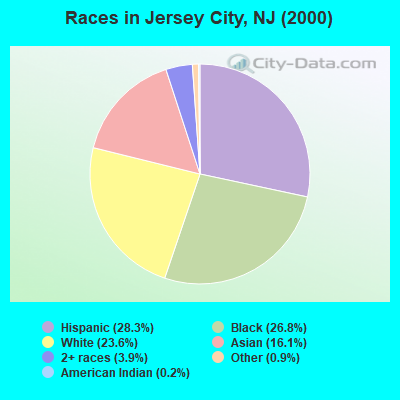
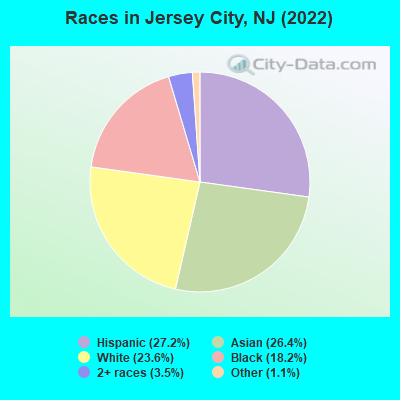
According to 2022 data, the most numerous races in Jersey City, NJ are White alone (67,546 residents), Hispanic (77,949 residents), and Black alone (52,174 residents). 50.4% of Jersey City residents speak English at home. 42.4% of Jersey City, NJ residents are foreign-born (20.1% born in Asia, 13.3% born in Latin America, 4.4% born in Africa), which is 45.7% greater than the foreign-born rate of 23.0% across the entire state of New Jersey.
Race distribution in Jersey City
2000 2022
67,952 28.3% Hispanic 64,389 26.8% Black alone 56,736 23.6% White alone 38,623 16.1% Asian alone 9,476 3.9% Two or more races 2,218 0.9% Other race alone 544 0.2% American Indian alone 117 0.05% Native Hawaiian and Other
77,949 27.2% Hispanic 75,732 26.4% Asian alone 67,546 23.6% White alone 52,174 18.2% Black alone 9,954 3.5% Two or more races 3,083 1.1% Other race alone 175 0.06% American Indian alone 48 0.02% Native Hawaiian and Other
2000 2022
5,557,209 66.0% White alone 1,117,191 13.3% Hispanic 1,096,171 13.0% Black alone 477,012 5.7% Asian alone 133,689 1.6% Two or more races 19,565 0.2% Other race alone 11,338 0.1% American Indian alone 2,175 0.03% Native Hawaiian and Other
4,766,476 51.5% White alone 2,028,470 21.9% Hispanic 1,111,632 12.0% Black alone 923,546 10.0% Asian alone 332,237 3.6% Two or more races 89,847 1.0% Other race alone 8,557 0.09% American Indian alone 934 0.01% Native Hawaiian and Other
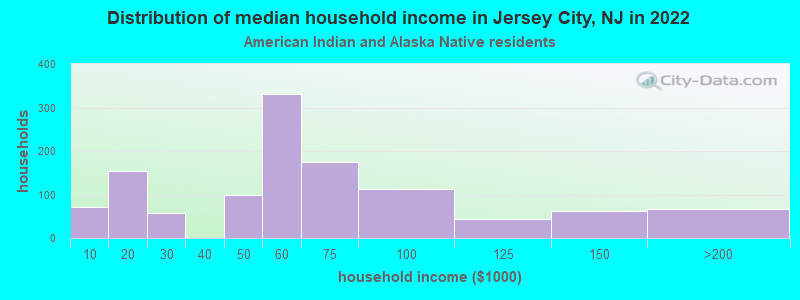
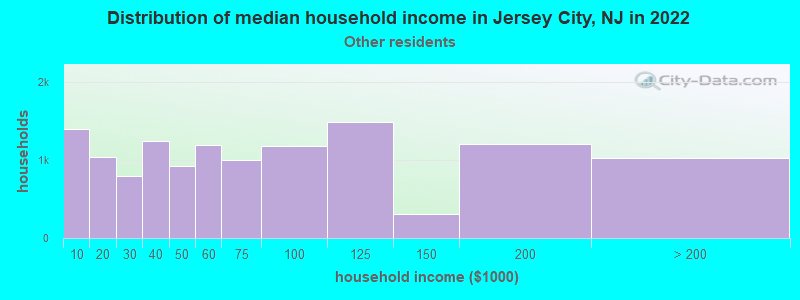
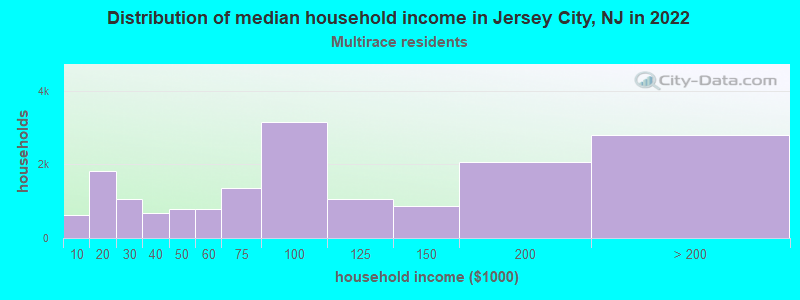
Income and house value in Jersey City Median household income in 2022 $114,601 White non-Hispanic householders$55,456 Black householders$47,966 American Indian and Alaska Native householders$141,579 Asian householders$56,997 Some other race householders$86,307 Two or more races householders$68,430 Hispanic or Latino race householdersMedian 2022 house value $508,559 White Non-Hispanic householders$457,825 Black or African American householders$317,799 American Indian or Alaska Native householders $543,059 Asian householders$530,882 Some other race householders$555,641 Two or more races householders$533,318 Hispanic or Latino householders
Median age by race in Jersey City
36.2 Median age for White residents36.0 36.7 33.3 Median age for Black or African American residents30.8 36.1 31.8 Median age for American Indian / Alaska Native residents28.7 39.2 34.3 Median age for Asian residents34.1 34.6 -666,666,666.0 Median age for Native Hawaiian / Pacific Islander residents-666,666,666.0 -666,666,666.0 37.7 Median age for Other race residents35.4 40.5 35.4 Median age for Two or more races residents32.8 39.5 36.3 Median age for White alone residents35.7 37.4 35.3 Median age for Hispanic or Latino residents33.6 39.3
Owner/renter occupied households by race in Jersey City
House owners and renters - White residents 13,071 32.5% Owner occupied27,162 67.5% Renter occupiedHouse owners and renters - Black or African American residents 6,786 27.9% Owner occupied17,535 72.1% Renter occupiedHouse owners and renters - American Indian / Alaska Native residents 135 13.6% Owner occupied857 86.4% Renter occupiedHouse owners and renters - Asian residents 10,331 29.7% Owner occupied24,434 70.3% Renter occupiedHouse owners and renters - Native Hawaiian / Pacific Islander residents 24 100.0% Renter occupiedHouse owners and renters - Other race residents 2,830 22.1% Owner occupied9,984 77.9% Renter occupiedHouse owners and renters - Two or more races residents 5,472 32.2% Owner occupied11,527 67.8% Renter occupiedHouse owners and renters - White alone residents 12,061 34.2% Owner occupied23,184 65.8% Renter occupiedHouse owners and renters - Hispanic or Latino residents 7,674 23.2% Owner occupied25,449 76.8% Renter occupied
Language usage in Jersey City
English speakers - Total 50.4% of residents of Jersey City speak English at home.
19.6% of residents speak Spanish at home 30,670 57.8% Speak English very well22,393 42.2% Speak English less than very well30.0% of residents speak other language at home 59,665 73.6% Speak English very well21,403 26.4% Speak English less than very well
English speakers - Born in the United States 80.0% of residents of Jersey City speak English at home.
12.7% of residents speak Spanish at home 6,722 88.9% Speak English very well841 11.1% Speak English less than very well7.3% of residents speak other language at home 4,264 98.6% Speak English very well61 1.4% Speak English less than very well
English speakers - Native, born elsewhere 17.3% of residents of Jersey City speak English at home.
65.9% of residents speak Spanish at home 3,916 55.1% Speak English very well3,186 44.9% Speak English less than very well16.8% of residents speak other language at home 1,648 91.3% Speak English very well157 8.7% Speak English less than very well
English speakers - Foreign-born 18.3% of residents of Jersey City speak English at home.
21.5% of residents speak Spanish at home 7,370 30.3% Speak English very well16,985 69.7% Speak English less than very well60.2% of residents speak other language at home 47,162 69.1% Speak English very well21,122 30.9% Speak English less than very well
White (Caucasian) - Speak only English Native:
84.7% (46,031)Foreign-born:
27.9% (4,937)
White (Caucasian) - Speak another language Native:
15.3% (8,290)Foreign-born:
72.1% (12,758)
Black or African American - Speak only English Native:
96.4% (44,043)Foreign-born:
61.7% (4,304)
Black or African American - Speak another language Native:
3.6% (1,644)Foreign-born:
38.3% (2,674)
American Indian / Alaska Native - Speak only English Native:
22.1% (455)Foreign-born:
10.1% (87)
American Indian / Alaska Native - Speak another language Native:
38.9% (799)Foreign-born:
89.6% (771)
Asian - Speak only English Native:
51.5% (6,707)Foreign-born:
12.0% (7,363)
Asian - Speak another language Native:
48.5% (6,310)Foreign-born:
88.0% (54,000)
Other race - Speak only English Native:
23.5% (4,007)Foreign-born:
11.8% (1,581)
Other race - Speak another language Native:
76.5% (13,074)Foreign-born:
88.2% (11,848)
Two or more races - Speak only English Native:
58.8% (14,547)Foreign-born:
19.4% (2,493)
Two or more races - Speak another language Native:
41.2% (10,213)Foreign-born:
80.6% (10,335)
White alone - Speak only English Native:
89.1% (42,430)Foreign-born:
29.3% (4,834)
White alone - Speak another language Native:
10.9% (5,178)Foreign-born:
70.7% (11,674)
Hispanic or Latino - Speak only English Native:
40.5% (19,299)Foreign-born:
7.0% (1,786)
Hispanic or Latino - Speak another language Native:
59.5% (28,348)Foreign-born:
93.0% (23,872)
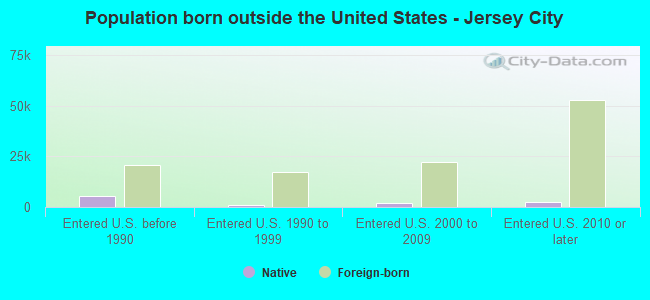
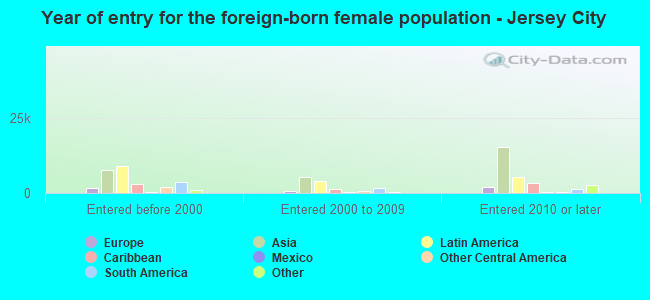
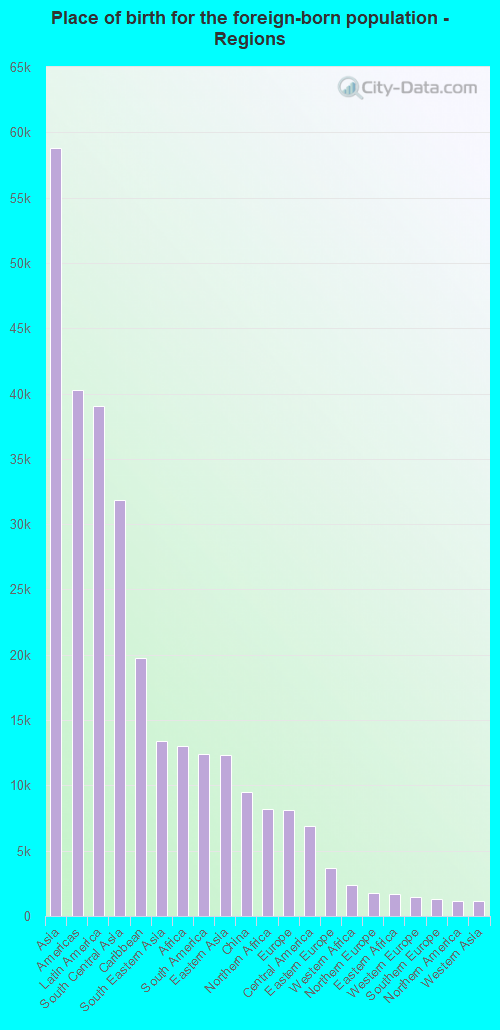
Foreign-born residents in Jersey City 120,506 residents are foreign born (20.1% Asia , 13.3% Latin America , 4.4% Africa ).
This city:
42.4%New Jersey:
23.2%
Marital status for residents in Jersey City Marital status - White (Caucasian) population 15 years and over
Males 43.3% Never married46.4% Now married0.6% Separated0.8% Widowed9.0% DivorcedFemales 44.5% Never married41.4% Now married1.0% Separated5.2% Widowed8.0% DivorcedWomen who gave birth in the past 12 months Now married:
43.6% (385)Unmarried:
56.4% (499)
Women who did not give birth in the past 12 months Now married:
41.8% (8,930)Unmarried:
58.2% (12,417)
Marital status - Black or African American population 15 years and over
Males 65.4% Never married19.2% Now married1.6% Separated4.7% Widowed9.0% DivorcedFemales 62.5% Never married15.3% Now married2.6% Separated10.9% Widowed8.7% DivorcedWomen who gave birth in the past 12 months Now married:
57.9% (128)Unmarried:
42.1% (93)
Women who did not give birth in the past 12 months Now married:
14.1% (1,994)Unmarried:
85.9% (12,104)
Marital status - American Indian / Alaska Native population 15 years and over
Males 43.1% Never married31.1% Now married0.1% Separated5.7% Widowed20.0% DivorcedFemales 46.9% Never married27.6% Now married0.0% Separated7.8% Widowed17.6% DivorcedWomen who gave birth in the past 12 months Now married:
55.1% (59)Unmarried:
44.9% (48)
Women who did not give birth in the past 12 months Now married:
21.9% (156)Unmarried:
78.1% (557)
Marital status - Asian population 15 years and over
Males 39.8% Never married52.7% Now married1.6% Separated2.1% Widowed3.9% DivorcedFemales 30.6% Never married57.2% Now married2.4% Separated5.1% Widowed4.7% DivorcedWomen who gave birth in the past 12 months Now married:
100.0% (2,041)Unmarried:
0.0% (0)
Women who did not give birth in the past 12 months Now married:
52.1% (11,279)Unmarried:
47.9% (10,382)
Marital status - Other race population 15 years and over
Males 44.4% Never married48.4% Now married3.7% Separated0.5% Widowed3.0% DivorcedFemales 40.2% Never married45.3% Now married2.9% Separated7.1% Widowed4.6% DivorcedWomen who gave birth in the past 12 months Now married:
100.0% (249)Unmarried:
0.0% (0)
Women who did not give birth in the past 12 months Now married:
44.8% (3,107)Unmarried:
55.2% (3,828)
Marital status - Two or more races population 15 years and over
Males 50.0% Never married40.2% Now married2.8% Separated0.8% Widowed6.2% DivorcedFemales 51.8% Never married28.5% Now married2.0% Separated4.2% Widowed13.5% DivorcedWomen who gave birth in the past 12 months Now married:
72.9% (396)Unmarried:
27.1% (147)
Women who did not give birth in the past 12 months Now married:
25.1% (2,497)Unmarried:
74.9% (7,450)
Marital status - White alone, not Hispanic / Latino population 15 years and over
Males 44.8% Never married45.4% Now married0.6% Separated0.9% Widowed8.2% DivorcedFemales 44.1% Never married42.2% Now married1.1% Separated4.6% Widowed8.1% DivorcedWomen who gave birth in the past 12 months Now married:
70.9% (385)Unmarried:
29.1% (158)
Women who did not give birth in the past 12 months Now married:
42.3% (8,092)Unmarried:
57.7% (11,027)
Marital status - Hispanic or Latino population 15 years and over
Males 49.4% Never married41.6% Now married2.4% Separated0.6% Widowed6.0% DivorcedFemales 46.7% Never married33.8% Now married3.8% Separated7.0% Widowed8.7% DivorcedWomen who gave birth in the past 12 months Now married:
59.6% (660)Unmarried:
40.4% (448)
Women who did not give birth in the past 12 months Now married:
32.3% (5,439)Unmarried:
67.7% (11,408)
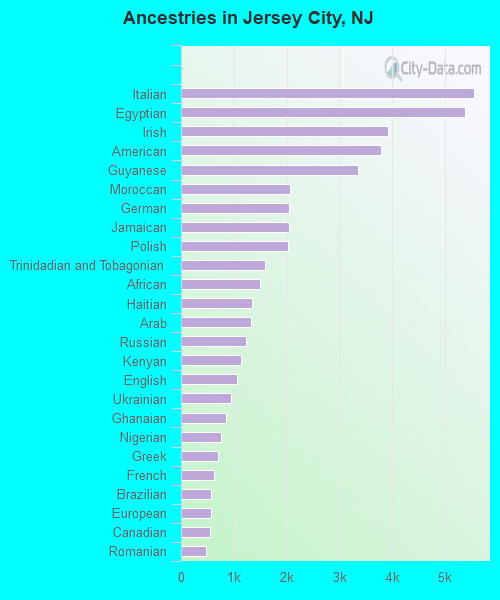
Ancestries in Jersey City
5,558 2.8% Italian5,378 2.7% Egyptian3,927 2.0% Irish3,791 1.9% American3,352 1.7% Guyanese2,067 1.1% Moroccan2,050 1.0% German2,045 1.0% Jamaican2,030 1.0% Polish1,594 0.8% Trinidadian and Tobagonian1,502 0.8% African1,337 0.7% Haitian1,325 0.7% Arab1,234 0.6% Russian1,145 0.6% Kenyan1,060 0.5% English943 0.5% Ukrainian859 0.4% Ghanaian761 0.4% Nigerian698 0.4% Greek623 0.3% French577 0.3% Brazilian573 0.3% European548 0.3% Canadian474 0.2% Romanian472 0.2% Lebanese410 0.2% British West Indian343 0.2% Hungarian311 0.2% British301 0.2% Turkish298 0.2% Portuguese271 0.1% West Indian271 0.1% Ethiopian258 0.1% Eastern European243 0.1% Iranian226 0.1% Australian185 0.09% Bulgarian179 0.09% Barbadian171 0.09% Albanian159 0.08% Dutch154 0.08% Scottish146 0.07% Palestinian143 0.07% Lithuanian114 0.06% Scotch-Irish111 0.06% Swedish104 0.05% Slavic102 0.05% Austrian98 0.05% Liberian91 0.05% Norwegian70 0.04% Danish58 0.03% Israeli57 0.03% Zimbabwean57 0.03% Croatian55 0.03% Sierra Leonean54 0.03% Senegalese52 0.03% Finnish51 0.03% Yugoslavian49 0.02% Sudanese44 0.02% Czech38 0.02% Belgian38 0.02% Serbian37 0.02% Bahamian35 0.02% South African35 0.02% Afghan33 0.02% French Canadian25 0.01% Cypriot24 0.01% Macedonian21 0.01% U.S. Virgin Islander20 0.01% Swiss19 0.01% Northern European19 0.01% Slovak15 0.01% Slovene11 0.01% Latvian
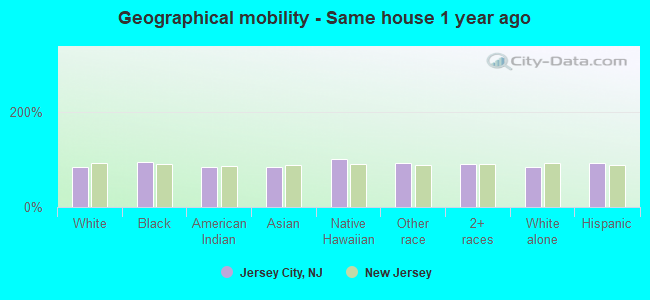
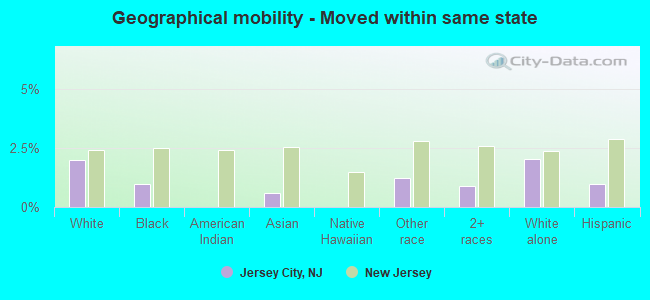
Geographical mobility in Jersey City Same house 1 year ago 63,462 84.2% White (Caucasian)52,293 94.4% Black or African American2,048 84.2% American Indian / Alaska Native64,144 83.1% Asian21 100.0% Native Hawaiian / Pacific Islander29,275 92.6% Other race36,846 91.2% Two or more races56,316 83.9% White alone, not Hispanic / Latino70,928 92.3% Hispanic or LatinoMoved within same county 4,473 5.9% White / Caucasian1,439 2.6% Black or African American319 13.1% American Indian / Alaska Native6,034 7.8% Asian1,215 3.8% Other race2,077 5.1% Two or more races4,308 6.4% White alone, not Hispanic / Latino3,303 4.3% Hispanic or LatinoMoved within same state 1,491 2.0% White / Caucasian534 1.0% Black or African American469 0.6% Asian389 1.2% Other race365 0.9% Two or more races1,374 2.0% White alone, not Hispanic / Latino752 1.0% Hispanic or LatinoMoved from different state 5,190 6.9% White / Caucasian1,132 2.0% Black or African American65 2.7% American Indian / Alaska Native3,414 4.4% Asian670 2.1% Other race1,069 2.6% Two or more races4,400 6.6% White alone, not Hispanic / Latino1,798 2.3% Hispanic or LatinoMoved from abroad 725 1.0% White3,089 4.0% Asian81 0.3% Other race47 0.1% Two or more races725 1.1% White alone, not Hispanic / Latino81 0.1% Hispanic or Latino
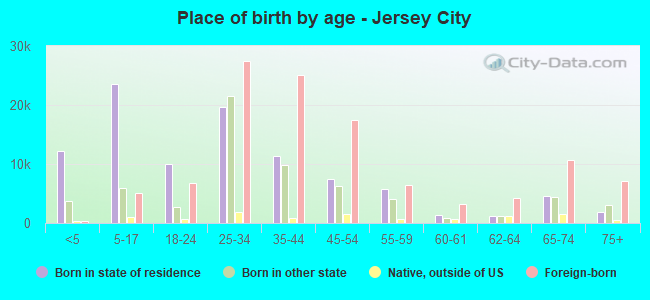
Children Nativity (place of birth) in Jersey City
Children under 6 years - Living with two parents Both parents native 2,936 100.0% NativeBoth parents foreign-born 6,715 95.4% Native323 4.6% Foreign-bornOne native, one foreign-born parent 2,338 100.0% NativeChildren under 6 years - Living with one parent Native parent 3,757 100.0% NativeForeign-born parent 1,221 100.0% NativeChildren 6 to 17 years - Living with two parents Both parents native 5,374 100.0% NativeBoth parents foreign-born 7,023 65.4% Native3,712 34.6% Foreign-bornOne native, one foreign-born parent 1,624 91.5% Native150 8.5% Foreign-bornChildren 6 to 17 years - Living with one parent Native parent 9,489 100.0% NativeForeign-born parent 3,448 58.2% Native2,475 41.8% Foreign-born
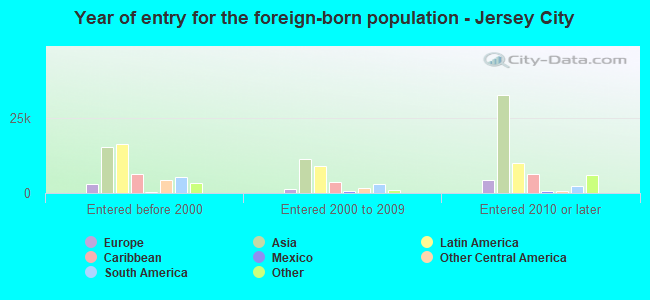
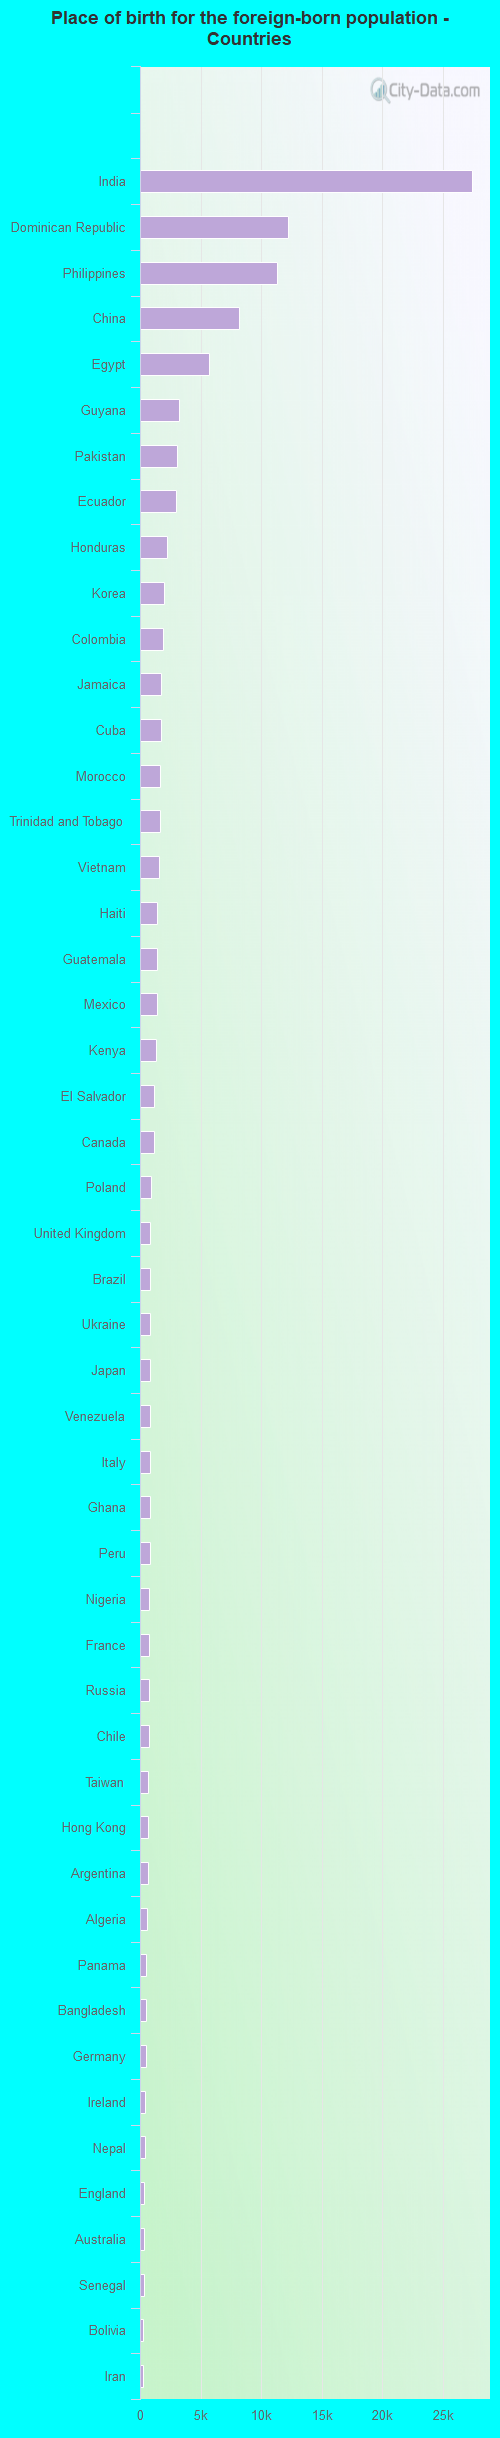
Place of birth for residents in Jersey City 58,829 Asia40,234 Americas39,074 Latin America31,870 South Central Asia19,721 Caribbean13,380 South Eastern Asia12,981 Africa12,425 South America12,350 Eastern Asia9,530 China8,211 Northern Africa8,140 Europe6,927 Central America3,650 Eastern Europe2,408 Western Africa1,752 Northern Europe1,699 Eastern Africa1,465 Western Europe1,271 Southern Europe1,160 Northern America1,139 Western Asia422 Middle Africa320 Oceania320 Australia and New Zealand Subregion147 Southern Africa27,415 India12,191 Dominican Republic11,276 Philippines8,158 China5,703 Egypt3,247 Guyana3,034 Pakistan2,970 Ecuador2,254 Honduras2,000 Korea1,858 Colombia1,764 Jamaica1,698 Cuba1,644 Morocco1,612 Trinidad and Tobago1,601 Vietnam1,396 Haiti1,372 Guatemala1,367 Mexico1,320 Kenya1,166 El Salvador1,160 Canada929 Poland846 United Kingdom843 Brazil834 Ukraine819 Japan810 Venezuela804 Italy803 Ghana792 Peru752 Nigeria740 France737 Russia703 Chile695 Taiwan677 Hong Kong621 Argentina592 Algeria492 Panama477 Bangladesh468 Germany453 Ireland431 Nepal292 England290 Australia289 Senegal269 Bolivia262 Iran225 Spain225 Lebanon219 Romania218 Bulgaria215 Dominica210 Turkey202 Cameroon179 St. Lucia173 Belarus163 Israel163 Georgia155 Greece153 Ethiopia149 Hungary149 Singapore147 South Africa140 Liberia136 Netherlands134 Saudi Arabia124 Thailand106 Nicaragua97 Barbados94 Costa Rica89 Switzerland86 Portugal74 Belize72 Ivory Coast71 Kazakhstan69 Uganda68 Malaysia66 Denmark65 Albania63 Syria55 Indonesia55 Laos54 Croatia49 Jordan46 Yemen44 St. Vincent and the Grenadines42 Uruguay41 Serbia40 Sierra Leone40 North Macedonia (Macedonia)35 Cambodia34 Zimbabwe34 United Arab Emirates30 Austria30 Czechoslovakia29 New Zealand28 Togo20 West Indies20 Tanzania19 Lithuania19 Bosnia and Herzegovina18 Sri Lanka18 Sweden16 Latvia15 Uzbekistan15 Moldova14 Burma (Myanmar)11 Sudan9 Congo8 Scotland7 Bahamas7 Democratic Republic of Congo (Zaire)
Grandparents responsible for own grandchildren in Jersey City
Grandparents (30 to 59 years) White / Caucasian 110 41.4% Responsible for grandchildren156 58.6% Not responsible for grandchildrenBlack or African American 180 26.1% Responsible for grandchildren508 73.9% Not responsible for grandchildrenAmerican Indian / Alaska Native 46 100.0% Not responsible for grandchildrenAsian 22 29.6% Responsible for grandchildren52 70.4% Not responsible for grandchildrenOther race 107 32.7% Responsible for grandchildren219 67.3% Not responsible for grandchildrenTwo or more races 71 53.2% Responsible for grandchildren63 46.8% Not responsible for grandchildrenWhite alone, not Hispanic / Latino 16 27.8% Responsible for grandchildren41 72.2% Not responsible for grandchildrenHispanic or Latino 295 42.8% Responsible for grandchildren395 57.2% Not responsible for grandchildrenGrandparents (60 years and over) White / Caucasian 31 11.7% Responsible for grandchildren231 88.3% Not responsible for grandchildrenBlack or African American 292 35.6% Responsible for grandchildren529 64.4% Not responsible for grandchildrenAsian 75 5.7% Responsible for grandchildren1,246 94.3% Not responsible for grandchildrenOther race 39 4.6% Responsible for grandchildren806 95.4% Not responsible for grandchildrenTwo or more races 15 2.4% Responsible for grandchildren633 97.6% Not responsible for grandchildrenWhite alone, not Hispanic / Latino 8 5.5% Responsible for grandchildren134 94.5% Not responsible for grandchildrenHispanic or Latino 58 4.5% Responsible for grandchildren1,224 95.5% Not responsible for grandchildren