Races in Jennings Lodge, Oregon (OR) Detailed Stats
Data:
Races - White alone (%)
Races - White alone (% change since 2000)
Races - Black alone (%)
Races - Black alone (% change since 2000)
Races - American Indian alone (%)
Races - American Indian alone (% change since 2000)
Races - Asian alone (%)
Races - Asian alone (% change since 2000)
Races - Hispanic (%)
Races - Hispanic (% change since 2000)
Races - Native Hawaiian and Other Pacific Islander alone (%)
Races - Native Hawaiian and Other Pacific Islander alone (% change since 2000)
Races - Two or more races(%)
Races - Two or more races(% change since 2000)
Races - Other race alone (%)
Races - Other race alone (% change since 2000)
Racial diversity
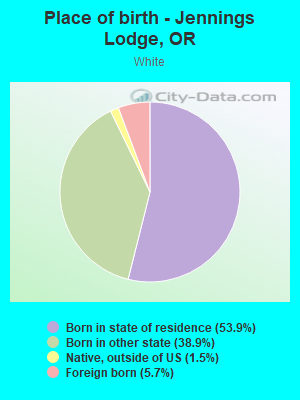
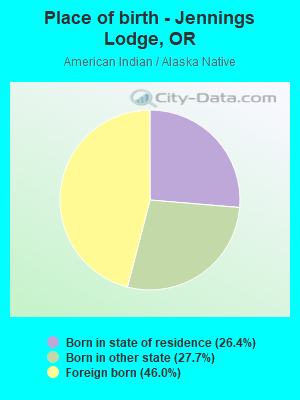
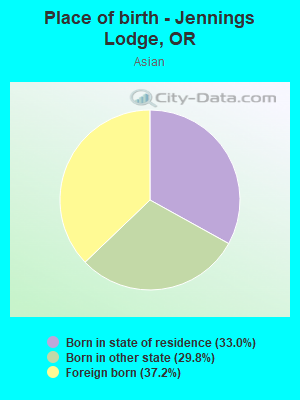
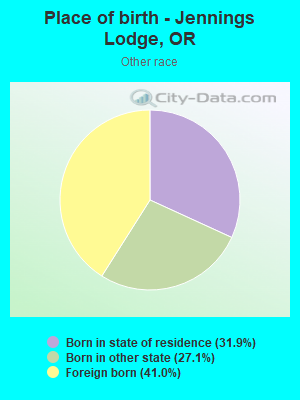
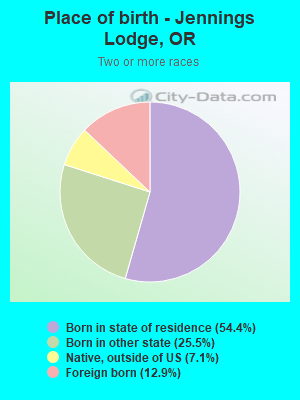
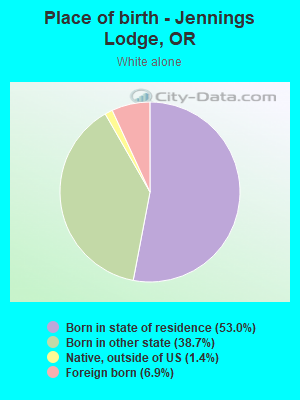
Place of birth - Born in state of residence (%)
Place of birth - Born in state of residence (%) - White
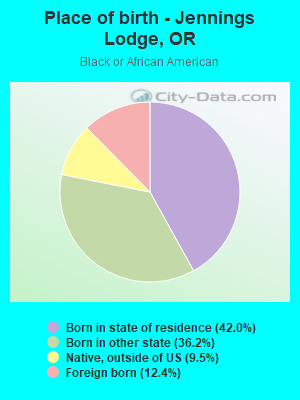
Place of birth - Born in state of residence (%) - Black or African American
Place of birth - Born in state of residence (%) - Asian
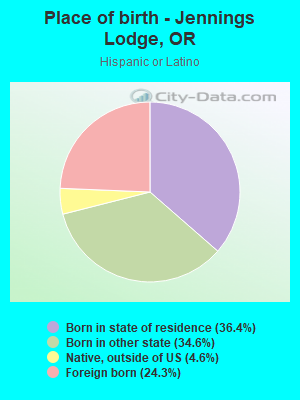
Place of birth - Born in state of residence (%) - Hispanic or Latino
Place of birth - Born in state of residence (%) - American Indian and Alaska Native
Place of birth - Born in state of residence (%) - Multirace
Place of birth - Born in state of residence (%) - Other Race
Place of birth - Born in other state (%)
Place of birth - Born in other state (%) - White
Place of birth - Born in other state (%) - Black or African American
Place of birth - Born in other state (%) - Asian
Place of birth - Born in other state (%) - Hispanic or Latino
Place of birth - Born in other state (%) - American Indian and Alaska Native
Place of birth - Born in other state (%) - Multirace
Place of birth - Born in other state (%) - Other Race
Place of birth - Native, outside of US (%)
Place of birth - Native, outside of US (%) - White
Place of birth - Native, outside of US (%) - Black or African American
Place of birth - Native, outside of US (%) - Asian
Place of birth - Native, outside of US (%) - Hispanic or Latino
Place of birth - Native, outside of US (%) - American Indian and Alaska Native
Place of birth - Native, outside of US (%) - Multirace
Place of birth - Native, outside of US (%) - Other Race
Place of birth - Foreign born (%)
Place of birth - Foreign born (%) - White
Place of birth - Foreign born (%) - Black or African American
Place of birth - Foreign born (%) - Asian
Place of birth - Foreign born (%) - Hispanic or Latino
Place of birth - Foreign born (%) - American Indian and Alaska Native
Place of birth - Foreign born (%) - Multirace
Place of birth - Foreign born (%) - Other Race
Residents speaking English at home (%)
Residents speaking English at home - Born in the United States (%)
Residents speaking English at home - Native, born elsewhere (%)
Residents speaking English at home - Foreign born (%)
Residents speaking Spanish at home (%)
Residents speaking Spanish at home - Born in the United States (%)
Residents speaking Spanish at home - Native, born elsewhere (%)
Residents speaking Spanish at home - Foreign born (%)
Residents speaking other language at home (%)
Residents speaking other language at home - Born in the United States (%)
Residents speaking other language at home - Native, born elsewhere (%)
Residents speaking other language at home - Foreign born (%)
Marital status - Never married (%)
Marital status - Now married (%)
Marital status - Separated (%)
Marital status - Widowed (%)
Marital status - Divorced (%)
Ancestries Reported - Arab (%)
Ancestries Reported - Czech (%)
Ancestries Reported - Danish (%)
Ancestries Reported - Dutch (%)
Ancestries Reported - English (%)
Ancestries Reported - French (%)
Ancestries Reported - French Canadian (%)
Ancestries Reported - German (%)
Ancestries Reported - Greek (%)
Ancestries Reported - Hungarian (%)
Ancestries Reported - Irish (%)
Ancestries Reported - Italian (%)
Ancestries Reported - Lithuanian (%)
Ancestries Reported - Norwegian (%)
Ancestries Reported - Polish (%)
Ancestries Reported - Portuguese (%)
Ancestries Reported - Russian (%)
Ancestries Reported - Scotch-Irish (%)
Ancestries Reported - Scottish (%)
Ancestries Reported - Slovak (%)
Ancestries Reported - Subsaharan African (%)
Ancestries Reported - Swedish (%)
Ancestries Reported - Swiss (%)
Ancestries Reported - Ukrainian (%)
Ancestries Reported - United States (%)
Ancestries Reported - Welsh (%)
Ancestries Reported - West Indian (%)
Ancestries Reported - Other (%)
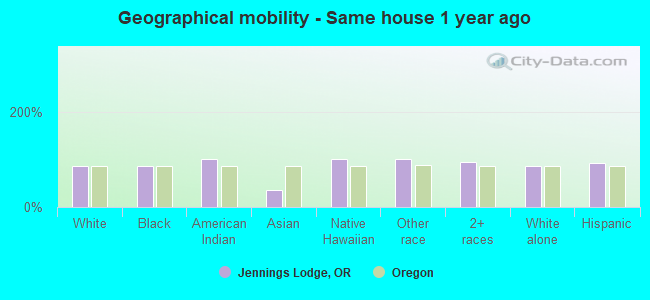
Geographical mobility - Same house 1 year ago (%)
Geographical mobility - Same house 1 year ago (%) - White
Geographical mobility - Same house 1 year ago (%) - Black or African American
Geographical mobility - Same house 1 year ago (%) - Asian
Geographical mobility - Same house 1 year ago (%) - Hispanic or Latino
Geographical mobility - Same house 1 year ago (%) - American Indian and Alaska Native
Geographical mobility - Same house 1 year ago (%) - Multirace
Geographical mobility - Same house 1 year ago (%) - Other Race
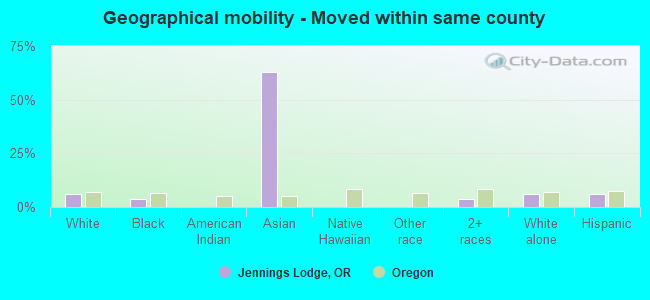
Geographical mobility - Moved within same county (%)
Geographical mobility - Moved within same county (%) - White
Geographical mobility - Moved within same county (%) - Black or African American
Geographical mobility - Moved within same county (%) - Asian
Geographical mobility - Moved within same county (%) - Hispanic or Latino
Geographical mobility - Moved within same county (%) - American Indian and Alaska Native
Geographical mobility - Moved within same county (%) - Multirace
Geographical mobility - Moved within same county (%) - Other Race
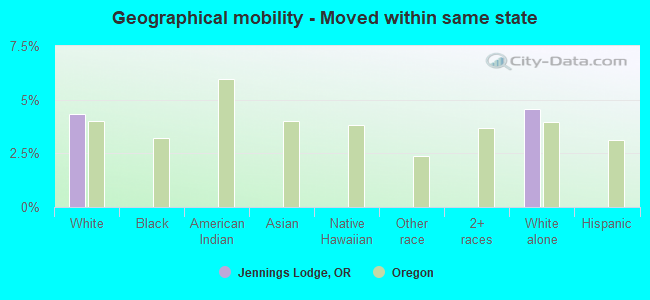
Geographical mobility - Moved from different county within same state (%)
Geographical mobility - Moved from different county within same state (%) - White
Geographical mobility - Moved from different county within same state (%) - Black or African American
Geographical mobility - Moved from different county within same state (%) - Asian
Geographical mobility - Moved from different county within same state (%) - Hispanic or Latino
Geographical mobility - Moved from different county within same state (%) - American Indian and Alaska Native
Geographical mobility - Moved from different county within same state (%) - Multirace
Geographical mobility - Moved from different county within same state (%) - Other Race
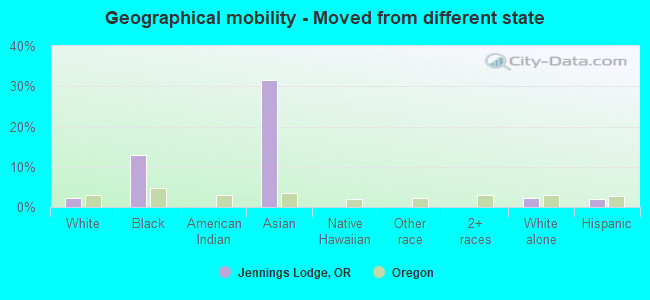
Geographical mobility - Moved from different state (%)
Geographical mobility - Moved from different state (%) - White
Geographical mobility - Moved from different state (%) - Black or African American
Geographical mobility - Moved from different state (%) - Asian
Geographical mobility - Moved from different state (%) - Hispanic or Latino
Geographical mobility - Moved from different state (%) - American Indian and Alaska Native
Geographical mobility - Moved from different state (%) - Multirace
Geographical mobility - Moved from different state (%) - Other Race
Geographical mobility - Moved from abroad (%)
Geographical mobility - Moved from abroad (%) - White
Geographical mobility - Moved from abroad (%) - Black or African American
Geographical mobility - Moved from abroad (%) - Asian
Geographical mobility - Moved from abroad (%) - Hispanic or Latino
Geographical mobility - Moved from abroad (%) - American Indian and Alaska Native
Geographical mobility - Moved from abroad (%) - Multirace
Geographical mobility - Moved from abroad (%) - Other Race
Place of birth for the foreign-born population - Ireland (%)
Place of birth for the foreign-born population - Denmark (%)
Place of birth for the foreign-born population - Norway (%)
Place of birth for the foreign-born population - Sweden (%)
Place of birth for the foreign-born population - United Kingdom (%)
Place of birth for the foreign-born population - England (%)
Place of birth for the foreign-born population - Scotland (%)
Place of birth for the foreign-born population - Other Northern Europe (%)
Place of birth for the foreign-born population - Austria (%)
Place of birth for the foreign-born population - Belgium (%)
Place of birth for the foreign-born population - France (%)
Place of birth for the foreign-born population - Germany (%)
Place of birth for the foreign-born population - Netherlands (%)
Place of birth for the foreign-born population - Switzerland (%)
Place of birth for the foreign-born population - Other Western Europe (%)
Place of birth for the foreign-born population - Greece (%)
Place of birth for the foreign-born population - Italy (%)
Place of birth for the foreign-born population - Portugal (%)
Place of birth for the foreign-born population - Spain (%)
Place of birth for the foreign-born population - Other Southern Europe (%)
Place of birth for the foreign-born population - Albania (%)
Place of birth for the foreign-born population - Belarus (%)
Place of birth for the foreign-born population - Bosnia and Herzegovina (%)
Place of birth for the foreign-born population - Bulgaria (%)
Place of birth for the foreign-born population - Croatia (%)
Place of birth for the foreign-born population - Czechoslovakia (%)
Place of birth for the foreign-born population - Hungary (%)
Place of birth for the foreign-born population - Latvia (%)
Place of birth for the foreign-born population - Lithuania (%)
Place of birth for the foreign-born population - North Macedonia (Macedonia) (%)
Place of birth for the foreign-born population - Moldova (%)
Place of birth for the foreign-born population - Poland (%)
Place of birth for the foreign-born population - Romania (%)
Place of birth for the foreign-born population - Russia (%)
Place of birth for the foreign-born population - Serbia (%)
Place of birth for the foreign-born population - Ukraine (%)
Place of birth for the foreign-born population - Other Eastern Europe (%)
Place of birth for the foreign-born population - China (%)
Place of birth for the foreign-born population - Hong Kong (%)
Place of birth for the foreign-born population - Taiwan (%)
Place of birth for the foreign-born population - Japan (%)
Place of birth for the foreign-born population - Korea (%)
Place of birth for the foreign-born population - Other Eastern Asia (%)
Place of birth for the foreign-born population - Afghanistan (%)
Place of birth for the foreign-born population - Bangladesh (%)
Place of birth for the foreign-born population - India (%)
Place of birth for the foreign-born population - Iran (%)
Place of birth for the foreign-born population - Kazakhstan (%)
Place of birth for the foreign-born population - Nepal (%)
Place of birth for the foreign-born population - Pakistan (%)
Place of birth for the foreign-born population - Sri Lanka (%)
Place of birth for the foreign-born population - Uzbekistan (%)
Place of birth for the foreign-born population - Other South Central Asia (%)
Place of birth for the foreign-born population - Burma (%)
Place of birth for the foreign-born population - Cambodia (%)
Place of birth for the foreign-born population - Indonesia (%)
Place of birth for the foreign-born population - Laos (%)
Place of birth for the foreign-born population - Malaysia (%)
Place of birth for the foreign-born population - Philippines (%)
Place of birth for the foreign-born population - Singapore (%)
Place of birth for the foreign-born population - Thailand (%)
Place of birth for the foreign-born population - Vietnam (%)
Place of birth for the foreign-born population - Other South Eastern Asia (%)
Place of birth for the foreign-born population - Armenia (%)
Place of birth for the foreign-born population - Iraq (%)
Place of birth for the foreign-born population - Israel (%)
Place of birth for the foreign-born population - Jordan (%)
Place of birth for the foreign-born population - Kuwait (%)
Place of birth for the foreign-born population - Lebanon (%)
Place of birth for the foreign-born population - Saudi Arabia (%)
Place of birth for the foreign-born population - Syria (%)
Place of birth for the foreign-born population - Turkey (%)
Place of birth for the foreign-born population - Yemen (%)
Place of birth for the foreign-born population - Other Western Asia (%)
Place of birth for the foreign-born population - Eritrea (%)
Place of birth for the foreign-born population - Ethiopia (%)
Place of birth for the foreign-born population - Kenya (%)
Place of birth for the foreign-born population - Somalia (%)
Place of birth for the foreign-born population - Uganda (%)
Place of birth for the foreign-born population - Zimbabwe (%)
Place of birth for the foreign-born population - Other Eastern Africa (%)
Place of birth for the foreign-born population - Cameroon (%)
Place of birth for the foreign-born population - Congo (%)
Place of birth for the foreign-born population - Democratic Republic of Congo (Zaire) (%)
Place of birth for the foreign-born population - Other Middle Africa (%)
Place of birth for the foreign-born population - Egypt (%)
Place of birth for the foreign-born population - Morocco (%)
Place of birth for the foreign-born population - Sudan (%)
Place of birth for the foreign-born population - Other Northern Africa (%)
Place of birth for the foreign-born population - South Africa (%)
Place of birth for the foreign-born population - Other Southern Africa (%)
Place of birth for the foreign-born population - Cabo Verde (%)
Place of birth for the foreign-born population - Ghana (%)
Place of birth for the foreign-born population - Liberia (%)
Place of birth for the foreign-born population - Nigeria (%)
Place of birth for the foreign-born population - Senegal (%)
Place of birth for the foreign-born population - Sierra Leone (%)
Place of birth for the foreign-born population - Other Western Africa (%)
Place of birth for the foreign-born population - Australia (%)
Place of birth for the foreign-born population - New Zealand (%)
Place of birth for the foreign-born population - Fiji (%)
Place of birth for the foreign-born population - Micronesia (%)
Place of birth for the foreign-born population - Bahamas (%)
Place of birth for the foreign-born population - Barbados (%)
Place of birth for the foreign-born population - Cuba (%)
Place of birth for the foreign-born population - Dominica (%)
Place of birth for the foreign-born population - Dominican Republic (%)
Place of birth for the foreign-born population - Grenada (%)
Place of birth for the foreign-born population - Haiti (%)
Place of birth for the foreign-born population - Jamaica (%)
Place of birth for the foreign-born population - St. Vincent and the Grenadines (%)
Place of birth for the foreign-born population - Trinidad and Tobago (%)
Place of birth for the foreign-born population - West Indies (%)
Place of birth for the foreign-born population - Other Caribbean (%)
Place of birth for the foreign-born population - Belize (%)
Place of birth for the foreign-born population - Costa Rica (%)
Place of birth for the foreign-born population - El Salvador (%)
Place of birth for the foreign-born population - Guatemala (%)
Place of birth for the foreign-born population - Honduras (%)
Place of birth for the foreign-born population - Mexico (%)
Place of birth for the foreign-born population - Nicaragua (%)
Place of birth for the foreign-born population - Panama (%)
Place of birth for the foreign-born population - Other Central America (%)
Place of birth for the foreign-born population - Argentina (%)
Place of birth for the foreign-born population - Bolivia (%)
Place of birth for the foreign-born population - Brazil (%)
Place of birth for the foreign-born population - Chile (%)
Place of birth for the foreign-born population - Colombia (%)
Place of birth for the foreign-born population - Ecuador (%)
Place of birth for the foreign-born population - Guyana (%)
Place of birth for the foreign-born population - Peru (%)
Place of birth for the foreign-born population - Uruguay (%)
Place of birth for the foreign-born population - Venezuela (%)
Place of birth for the foreign-born population - Other South America (%)
Place of birth for the foreign-born population - Canada (%)
Place of birth for the foreign-born population - Other Northern America (%)
Place of birth for the foreign-born population - Other (%)
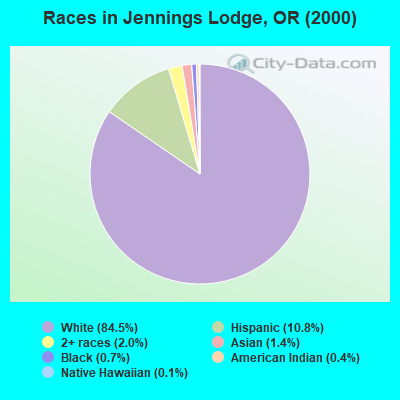
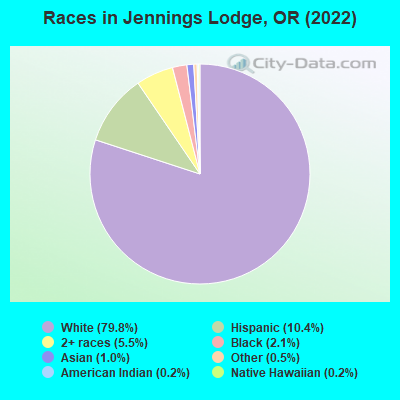
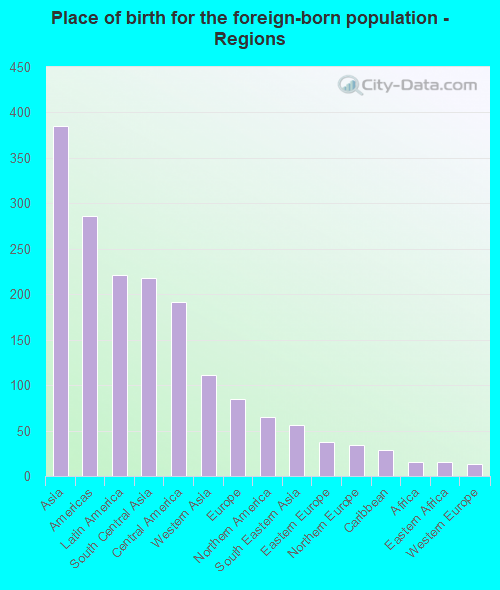
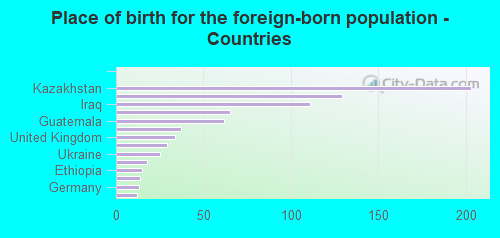
According to 2022 data, the most numerous races in Jennings Lodge, OR are White alone (6,144 residents), Hispanic (804 residents), and Two or more races (426 residents). 85.3% of Jennings Lodge residents speak English at home. 10.0% of Jennings Lodge, OR residents are foreign-born (4.9% born in Asia, 2.8% born in Latin America, 1.1% born in Europe), which is 10.2% greater than the foreign-born rate of 9.0% across the entire state of Oregon.
Race distribution in Jennings Lodge
2000 2022
2,857,616 83.5% White alone 275,314 8.0% Hispanic 100,333 2.9% Asian alone 82,733 2.4% Two or more races 53,325 1.6% Black alone 40,130 1.2% American Indian alone 7,398 0.2% Native Hawaiian and Other 4,550 0.1% Other race alone
3,037,571 71.6% White alone 609,538 14.4% Hispanic 252,744 6.0% Two or more races 191,283 4.5% Asian alone 78,228 1.8% Black alone 29,399 0.7% American Indian alone 25,731 0.6% Other race alone 15,643 0.4% Native Hawaiian and Other
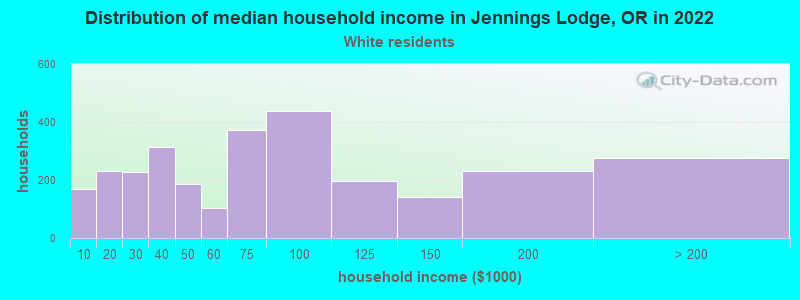
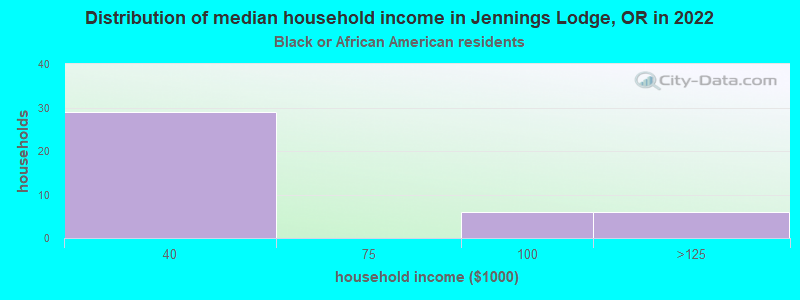
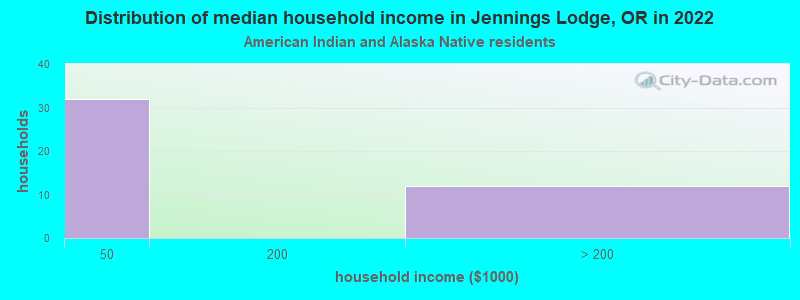
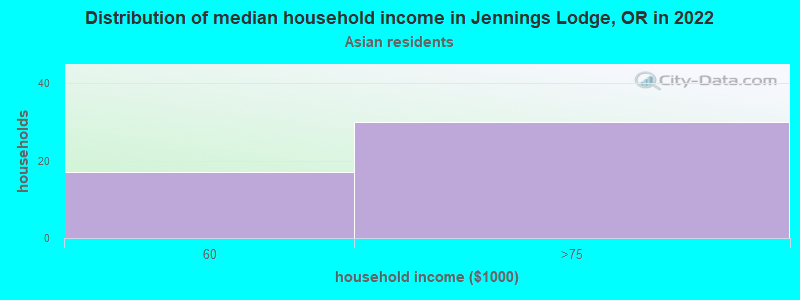
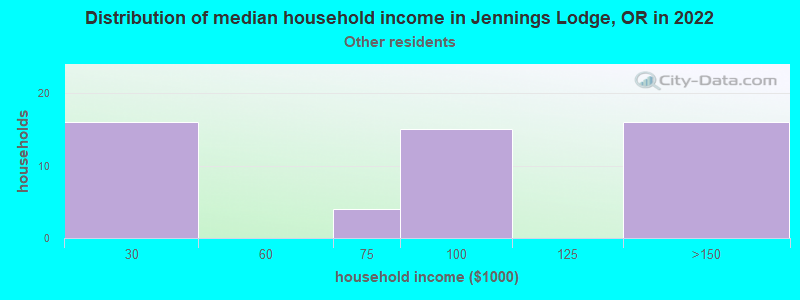
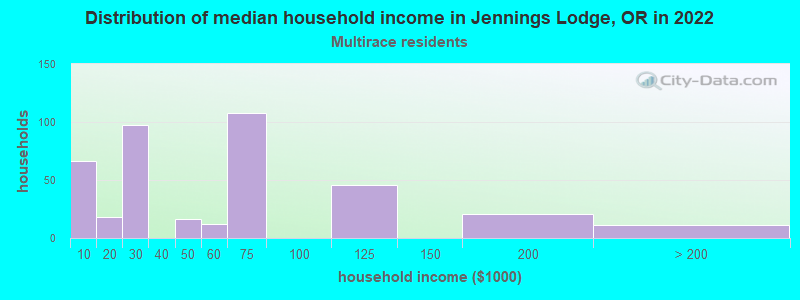
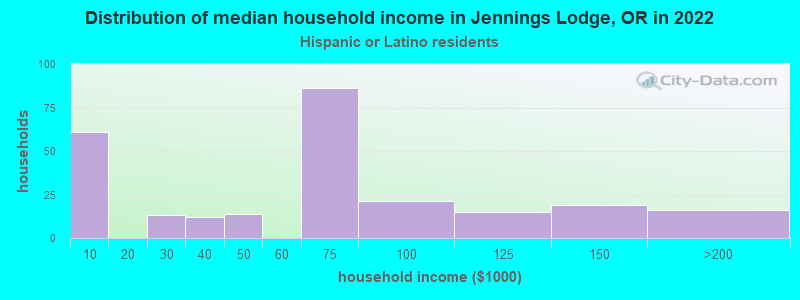
Income and house value in Jennings Lodge Median household income in 2022 $64,742 White non-Hispanic householders$116,541 Some other race householders$65,418 Two or more races householders$69,484 Hispanic or Latino race householdersMedian 2022 house value $494,387 White Non-Hispanic householders $50,447 Asian householders$355,151 Some other race householders$351,404 Two or more races householders$428,372 Hispanic or Latino householders
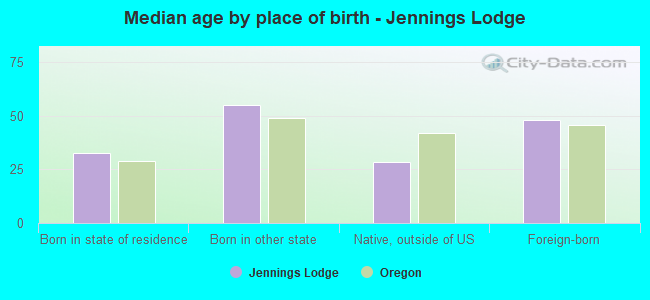
Median age by race in Jennings Lodge
46.8 Median age for White residents47.1 46.9 19.3 Median age for Black or African American residents34.0 8.7 34.4 Median age for American Indian / Alaska Native residents-600,368,323.5 -684,287,811.4 38.5 Median age for Asian residents21.7 38.5 -764,705,881.6 Median age for Native Hawaiian / Pacific Islander residents-764,119,600.6 -774,891,774.1 39.2 Median age for Other race residents37.7 55.2 26.4 Median age for Two or more races residents16.7 28.4 46.8 Median age for White alone residents46.6 47.0 31.2 Median age for Hispanic or Latino residents16.8 39.5
Owner/renter occupied households by race in Jennings Lodge
House owners and renters - White residents 1,729 59.5% Owner occupied1,176 40.5% Renter occupiedHouse owners and renters - Black or African American residents 22 64.9% Owner occupied12 35.1% Renter occupiedHouse owners and renters - American Indian / Alaska Native residents 17 40.2% Owner occupied26 59.8% Renter occupiedHouse owners and renters - Asian residents 66 100.0% Renter occupiedHouse owners and renters - Other race residents 18 36.5% Owner occupied32 63.5% Renter occupiedHouse owners and renters - Two or more races residents 89 25.1% Owner occupied265 74.9% Renter occupiedHouse owners and renters - White alone residents 1,729 59.4% Owner occupied1,182 40.6% Renter occupiedHouse owners and renters - Hispanic or Latino residents 66 27.3% Owner occupied175 72.7% Renter occupied
Language usage in Jennings Lodge
English speakers - Total 85.3% of residents of Jennings Lodge speak English at home.
5.8% of residents speak Spanish at home 252 58.9% Speak English very well176 41.1% Speak English less than very well8.6% of residents speak other language at home 451 70.4% Speak English very well190 29.6% Speak English less than very well
English speakers - Born in the United States 92.9% of residents of Jennings Lodge speak English at home.
5.3% of residents speak Spanish at home 113 75.8% Speak English very well36 24.2% Speak English less than very well2.0% of residents speak other language at home 56 100.0% Speak English very well
English speakers - Native, born elsewhere 66.5% of residents of Jennings Lodge speak English at home.
6.3% of residents speak Spanish at home 10 100.0% Speak English very well38.0% of residents speak other language at home 60 100.0% Speak English very well
English speakers - Foreign-born 17.9% of residents of Jennings Lodge speak English at home.
25.5% of residents speak Spanish at home 27 14.9% Speak English very well154 85.1% Speak English less than very well53.0% of residents speak other language at home 253 67.1% Speak English very well124 32.9% Speak English less than very well
White (Caucasian) - Speak only English Native:
95.3% (5,377)Foreign-born:
26.2% (92)
White (Caucasian) - Speak another language Native:
4.5% (251)Foreign-born:
67.4% (236)
Black or African American - Speak another language Native:
19.8% (19)Foreign-born:
99.4% (15)
Asian - Speak only English Native:
100.0% (55)Foreign-born:
26.1% (18)
Other race - Speak another language Native:
63.2% (100)Foreign-born:
89.1% (90)
Two or more races - Speak another language Native:
18.5% (121)Foreign-born:
87.1% (97)
White alone - Speak only English Native:
95.9% (5,357)Foreign-born:
22.8% (96)
White alone - Speak another language Native:
4.1% (227)Foreign-born:
75.1% (318)
Hispanic or Latino - Speak another language Native:
42.3% (205)Foreign-born:
83.8% (159)
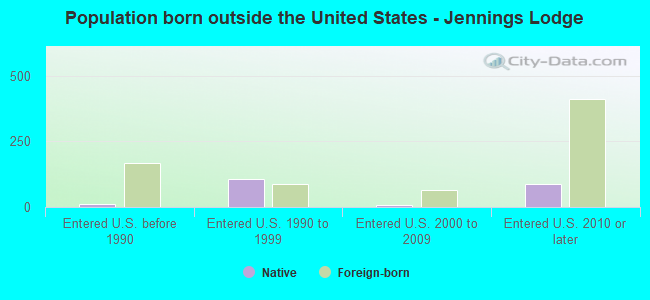
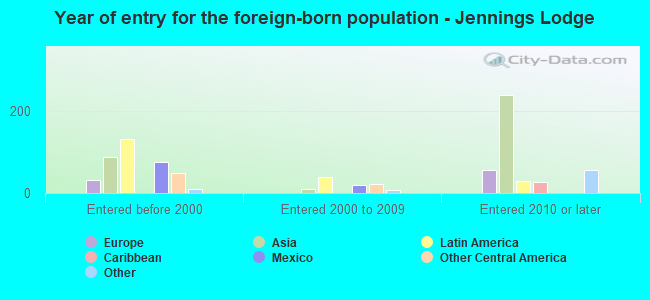
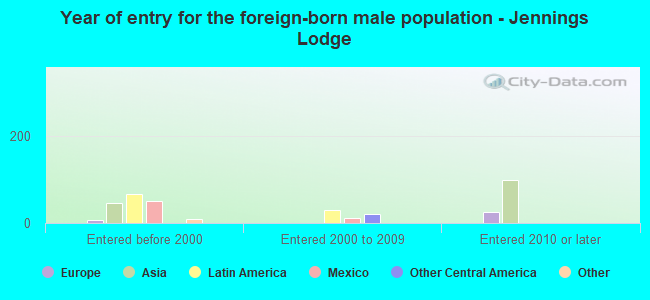
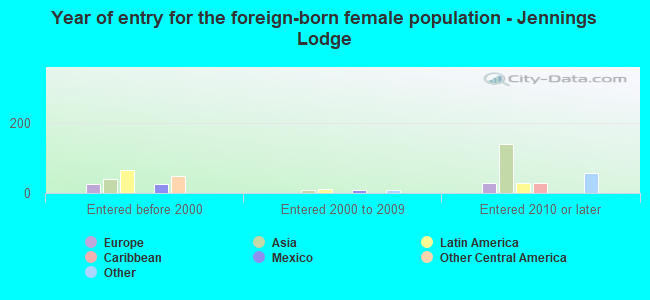
Foreign-born residents in Jennings Lodge 772 residents are foreign born (4.9% Asia , 2.8% Latin America , 1.1% Europe ).
This city:
10.0%Oregon:
9.8%
Marital status for residents in Jennings Lodge Marital status - White (Caucasian) population 15 years and over
Males 28.9% Never married56.3% Now married2.8% Separated3.4% Widowed8.7% DivorcedFemales 27.7% Never married44.5% Now married2.1% Separated9.8% Widowed15.9% DivorcedWomen who gave birth in the past 12 months Now married:
100.0% (21)Unmarried:
0.0% (0)
Women who did not give birth in the past 12 months Now married:
50.3% (805)Unmarried:
49.7% (797)
Marital status - Black or African American population 15 years and over
Males 41.5% Never married58.5% Now married0.0% Separated0.0% Widowed0.0% DivorcedFemales 0.0% Never married100.0% Now married0.0% Separated0.0% Widowed0.0% DivorcedWomen who gave birth in the past 12 months Now married:
100.0% (9)Unmarried:
0.0% (0)
Women who did not give birth in the past 12 months Now married:
100.0% (5)Unmarried:
0.0% (0)
Marital status - American Indian / Alaska Native population 15 years and over
Males 0.0% Never married100.0% Now married0.0% Separated0.0% Widowed0.0% DivorcedFemales 100.0% Never married0.0% Now married0.0% Separated0.0% Widowed0.0% DivorcedWomen who did not give birth in the past 12 months Now married:
0.0% (0)Unmarried:
100.0% (20)
Marital status - Asian population 15 years and over
Males 62.5% Never married37.5% Now married0.0% Separated0.0% Widowed0.0% DivorcedFemales 0.0% Never married100.0% Now married0.0% Separated0.0% Widowed0.0% DivorcedWomen who gave birth in the past 12 months Now married:
100.0% (43)Unmarried:
0.0% (0)
Women who did not give birth in the past 12 months Now married:
100.0% (21)Unmarried:
0.0% (0)
Marital status - Other race population 15 years and over
Males 34.3% Never married33.3% Now married0.0% Separated0.0% Widowed32.4% DivorcedFemales 11.4% Never married76.1% Now married0.0% Separated0.0% Widowed12.5% DivorcedWomen who did not give birth in the past 12 months Now married:
57.1% (38)Unmarried:
42.9% (29)
Marital status - Two or more races population 15 years and over
Males 26.5% Never married59.8% Now married5.3% Separated0.0% Widowed8.5% DivorcedFemales 46.4% Never married39.4% Now married0.0% Separated0.0% Widowed14.2% DivorcedWomen who did not give birth in the past 12 months Now married:
32.5% (77)Unmarried:
67.5% (159)
Marital status - White alone, not Hispanic / Latino population 15 years and over
Males 28.8% Never married56.8% Now married2.2% Separated3.4% Widowed8.8% DivorcedFemales 27.9% Never married44.7% Now married2.2% Separated9.9% Widowed15.4% DivorcedWomen who gave birth in the past 12 months Now married:
100.0% (14)Unmarried:
0.0% (0)
Women who did not give birth in the past 12 months Now married:
50.5% (818)Unmarried:
49.5% (801)
Marital status - Hispanic or Latino population 15 years and over
Males 42.8% Never married35.8% Now married6.1% Separated0.0% Widowed15.3% DivorcedFemales 12.5% Never married59.9% Now married0.0% Separated0.0% Widowed27.5% DivorcedWomen who gave birth in the past 12 months Now married:
100.0% (54)Unmarried:
0.0% (0)
Women who did not give birth in the past 12 months Now married:
60.5% (76)Unmarried:
39.5% (49)
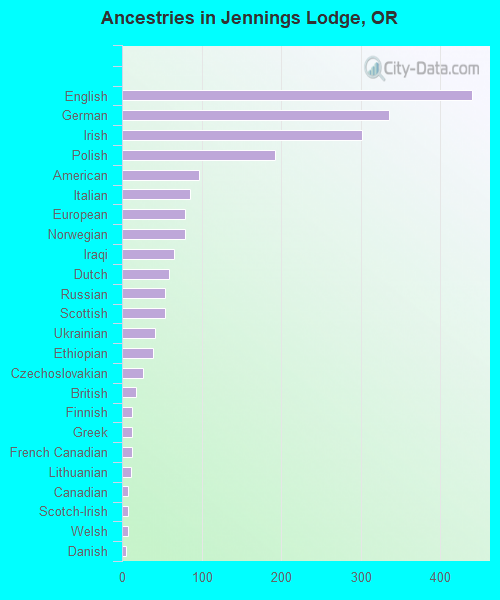
Ancestries in Jennings Lodge
439 15.6% English335 11.9% German301 10.7% Irish192 6.8% Polish97 3.4% American86 3.0% Italian79 2.8% European79 2.8% Norwegian65 2.3% Iraqi59 2.1% Dutch54 1.9% Russian54 1.9% Scottish41 1.5% Ukrainian39 1.4% Ethiopian26 0.9% Czechoslovakian18 0.6% British13 0.5% Finnish13 0.5% Greek12 0.4% French Canadian11 0.4% Lithuanian7 0.2% Canadian7 0.2% Scotch-Irish7 0.2% Welsh5 0.2% Danish
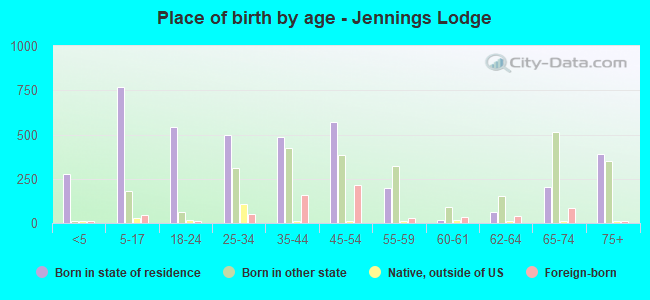
Children Nativity (place of birth) in Jennings Lodge
Children under 6 years - Living with two parents Both parents native 130 100.0% NativeBoth parents foreign-born 22 100.0% NativeOne native, one foreign-born parent 64 100.0% NativeChildren under 6 years - Living with one parent Native parent 122 100.0% NativeChildren 6 to 17 years - Living with two parents Both parents native 455 100.0% NativeBoth parents foreign-born 7 12.2% Native51 87.8% Foreign-bornOne native, one foreign-born parent 40 100.0% NativeChildren 6 to 17 years - Living with one parent Native parent 343 100.0% NativeForeign-born parent 22 47.4% Native24 52.6% Foreign-born
Grandparents responsible for own grandchildren in Jennings Lodge
Grandparents (30 to 59 years) Black or African American 6 100.0% Not responsible for grandchildren
Grandparents (60 years and over)