Races in Jackson Hole, Wyoming (WY) Detailed Stats
Ancestries, Foreign-born residents, place of birth
Race distribution in Jackson Hole

- 16,09791.1%White alone
- 1,1846.7%Hispanic
- 1681.0%Two or more races
- 840.5%American Indian alone
- 920.5%Asian alone
- 250.1%Black alone
- 120.07%Other race alone
- 60.03%Native Hawaiian and Other
Pacific Islander alone
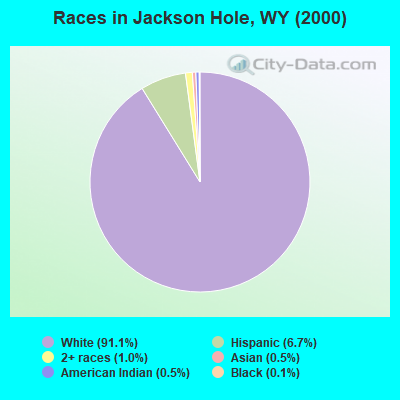
2000
2022
-
- 438,79988.9%White alone
- 31,6696.4%Hispanic
- 10,2382.1%American Indian alone
- 6,1641.2%Two or more races
- 3,5040.7%Black alone
- 2,6700.5%Asian alone
- 4740.10%Other race alone
- 2640.05%Native Hawaiian and Other
Pacific Islander alone

-
- 473,22081.4%White alone
- 62,80310.8%Hispanic
- 22,9113.9%Two or more races
- 9,5891.6%American Indian alone
- 4,9970.9%Other race alone
- 3,9900.7%Black alone
- 3,5770.6%Asian alone
- 2940.05%Native Hawaiian and Other
Pacific Islander alone

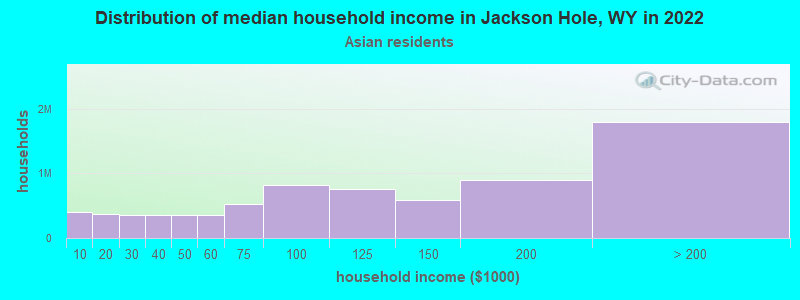
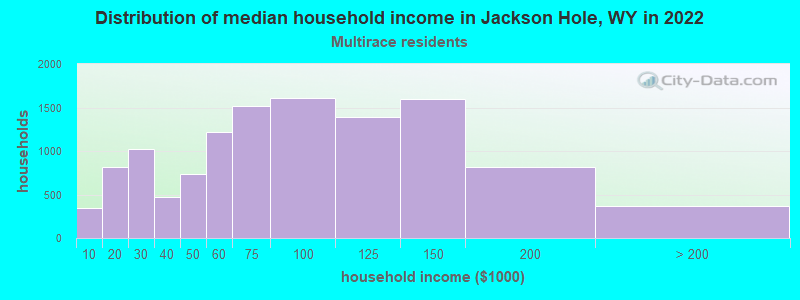
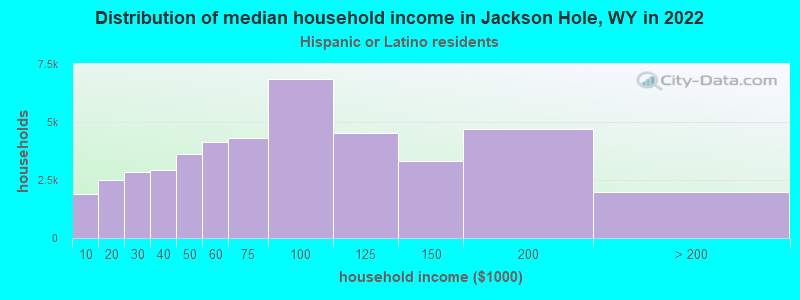
Income and house value in Jackson Hole
- Median household income in 2022
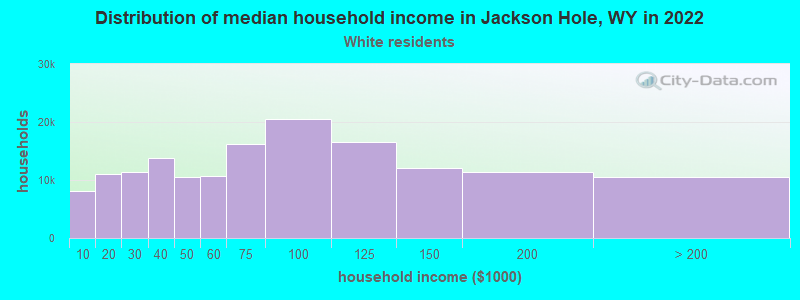
- $101,473White non-Hispanic householders
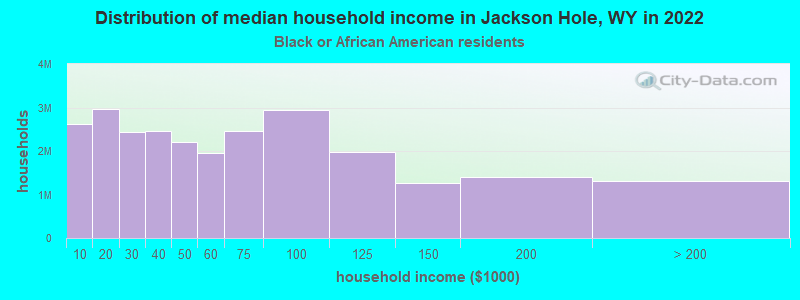
- $85,119Black householders
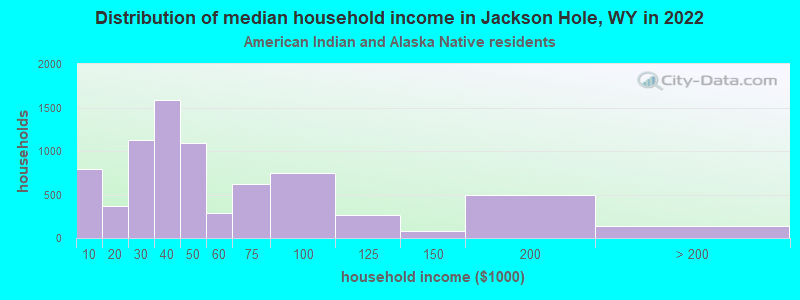
- $91,723American Indian and Alaska Native householders
- $106,140Some other race householders
- $91,839Two or more races householders
- $136,644Hispanic or Latino race householders
- Median 2022 house value
- over $1,000,000White Non-Hispanic householders
- over $1,000,000American Indian or Alaska Native householders
- $742,003Asian householders
- $339,712Two or more races householders
- $849,281Hispanic or Latino householders
Household income for White non-Hispanic householders
Household income for Black householders
Household income for American Indian and Alaska Native householders
Household income for Asian householders
Household income for Two or more races householders
Household income for Hispanic or Latino race householders
Zip code: 83001