Races in Jacinto City, Texas (TX) Detailed Stats
Data:
Races - White alone (%)
Races - White alone (% change since 2000)
Races - Black alone (%)
Races - Black alone (% change since 2000)
Races - American Indian alone (%)
Races - American Indian alone (% change since 2000)
Races - Asian alone (%)
Races - Asian alone (% change since 2000)
Races - Hispanic (%)
Races - Hispanic (% change since 2000)
Races - Native Hawaiian and Other Pacific Islander alone (%)
Races - Native Hawaiian and Other Pacific Islander alone (% change since 2000)
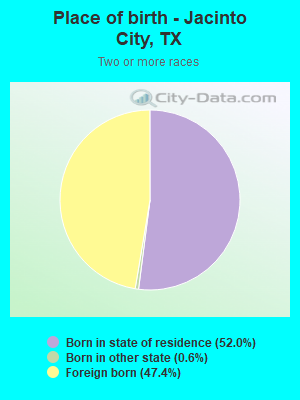
Races - Two or more races(%)
Races - Two or more races(% change since 2000)
Races - Other race alone (%)
Races - Other race alone (% change since 2000)
Racial diversity
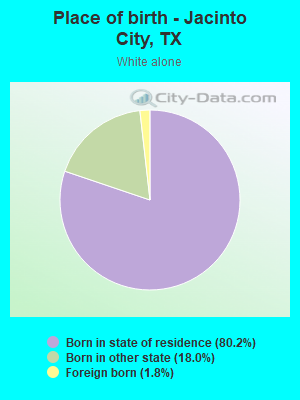
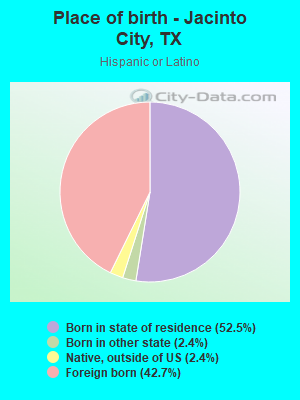
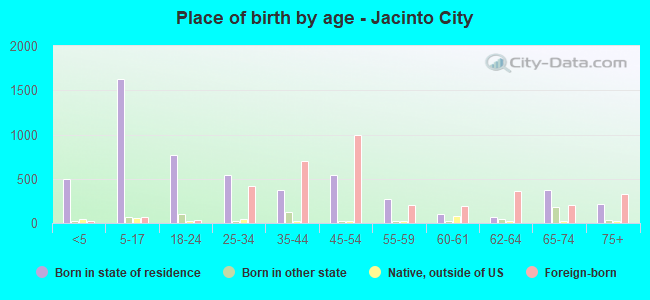
Place of birth - Born in state of residence (%)
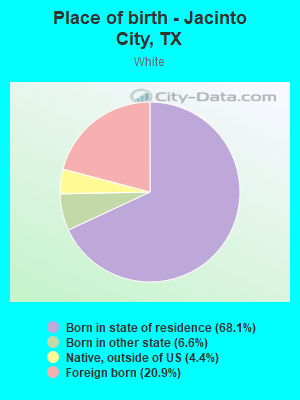
Place of birth - Born in state of residence (%) - White
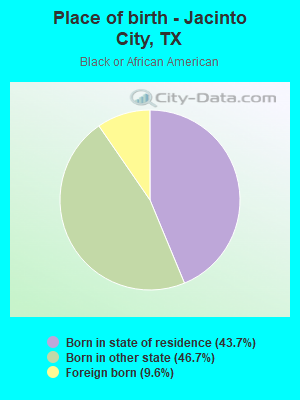
Place of birth - Born in state of residence (%) - Black or African American
Place of birth - Born in state of residence (%) - Asian
Place of birth - Born in state of residence (%) - Hispanic or Latino
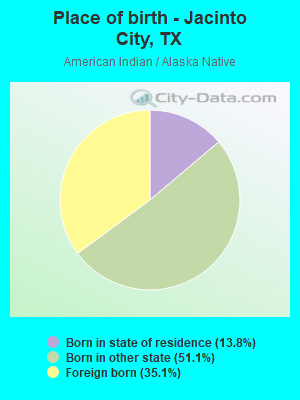
Place of birth - Born in state of residence (%) - American Indian and Alaska Native
Place of birth - Born in state of residence (%) - Multirace
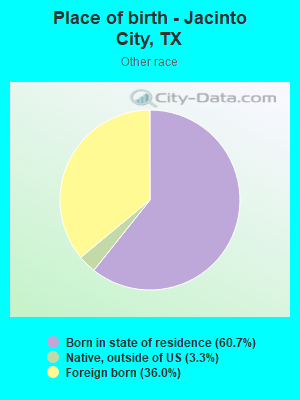
Place of birth - Born in state of residence (%) - Other Race
Place of birth - Born in other state (%)
Place of birth - Born in other state (%) - White
Place of birth - Born in other state (%) - Black or African American
Place of birth - Born in other state (%) - Asian
Place of birth - Born in other state (%) - Hispanic or Latino
Place of birth - Born in other state (%) - American Indian and Alaska Native
Place of birth - Born in other state (%) - Multirace
Place of birth - Born in other state (%) - Other Race
Place of birth - Native, outside of US (%)
Place of birth - Native, outside of US (%) - White
Place of birth - Native, outside of US (%) - Black or African American
Place of birth - Native, outside of US (%) - Asian
Place of birth - Native, outside of US (%) - Hispanic or Latino
Place of birth - Native, outside of US (%) - American Indian and Alaska Native
Place of birth - Native, outside of US (%) - Multirace
Place of birth - Native, outside of US (%) - Other Race
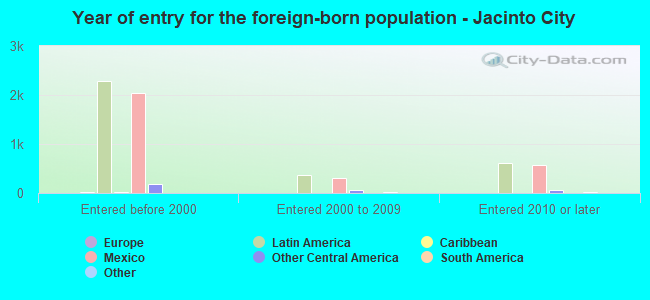
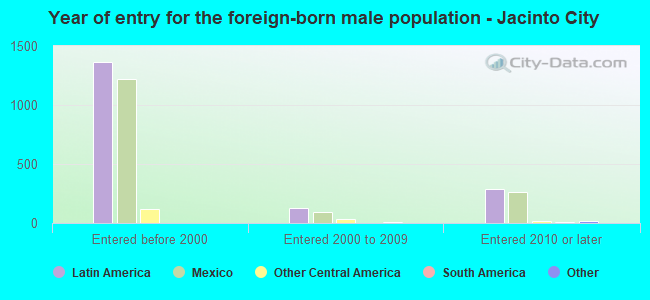
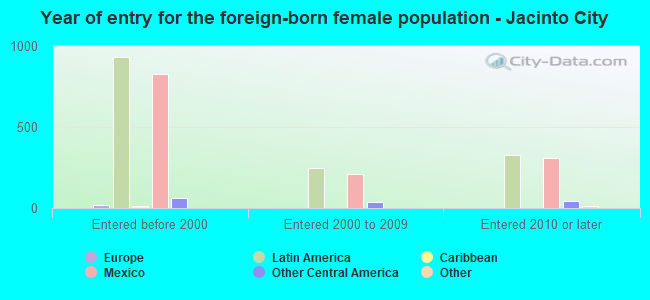
Place of birth - Foreign born (%)
Place of birth - Foreign born (%) - White
Place of birth - Foreign born (%) - Black or African American
Place of birth - Foreign born (%) - Asian
Place of birth - Foreign born (%) - Hispanic or Latino
Place of birth - Foreign born (%) - American Indian and Alaska Native
Place of birth - Foreign born (%) - Multirace
Place of birth - Foreign born (%) - Other Race
Residents speaking English at home (%)
Residents speaking English at home - Born in the United States (%)
Residents speaking English at home - Native, born elsewhere (%)
Residents speaking English at home - Foreign born (%)
Residents speaking Spanish at home (%)
Residents speaking Spanish at home - Born in the United States (%)
Residents speaking Spanish at home - Native, born elsewhere (%)
Residents speaking Spanish at home - Foreign born (%)
Residents speaking other language at home (%)
Residents speaking other language at home - Born in the United States (%)
Residents speaking other language at home - Native, born elsewhere (%)
Residents speaking other language at home - Foreign born (%)
Marital status - Never married (%)
Marital status - Now married (%)
Marital status - Separated (%)
Marital status - Widowed (%)
Marital status - Divorced (%)
Ancestries Reported - Arab (%)
Ancestries Reported - Czech (%)
Ancestries Reported - Danish (%)
Ancestries Reported - Dutch (%)
Ancestries Reported - English (%)
Ancestries Reported - French (%)
Ancestries Reported - French Canadian (%)
Ancestries Reported - German (%)
Ancestries Reported - Greek (%)
Ancestries Reported - Hungarian (%)
Ancestries Reported - Irish (%)
Ancestries Reported - Italian (%)
Ancestries Reported - Lithuanian (%)
Ancestries Reported - Norwegian (%)
Ancestries Reported - Polish (%)
Ancestries Reported - Portuguese (%)
Ancestries Reported - Russian (%)
Ancestries Reported - Scotch-Irish (%)
Ancestries Reported - Scottish (%)
Ancestries Reported - Slovak (%)
Ancestries Reported - Subsaharan African (%)
Ancestries Reported - Swedish (%)
Ancestries Reported - Swiss (%)
Ancestries Reported - Ukrainian (%)
Ancestries Reported - United States (%)
Ancestries Reported - Welsh (%)
Ancestries Reported - West Indian (%)
Ancestries Reported - Other (%)
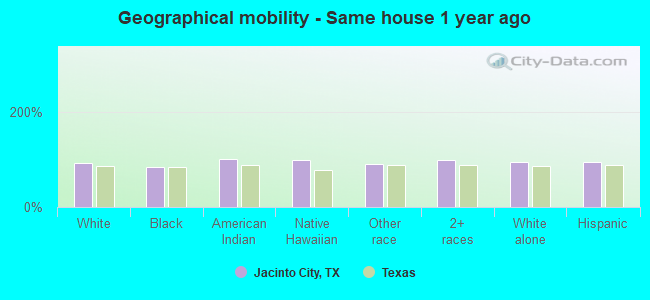
Geographical mobility - Same house 1 year ago (%)
Geographical mobility - Same house 1 year ago (%) - White
Geographical mobility - Same house 1 year ago (%) - Black or African American
Geographical mobility - Same house 1 year ago (%) - Asian
Geographical mobility - Same house 1 year ago (%) - Hispanic or Latino
Geographical mobility - Same house 1 year ago (%) - American Indian and Alaska Native
Geographical mobility - Same house 1 year ago (%) - Multirace
Geographical mobility - Same house 1 year ago (%) - Other Race
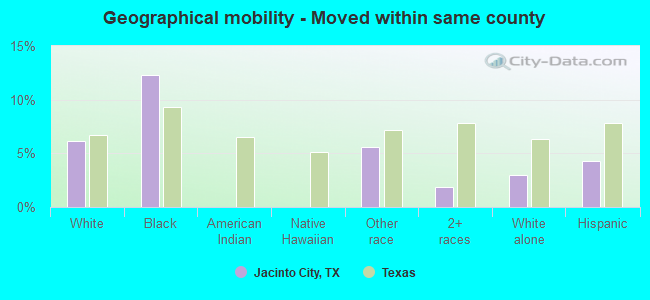
Geographical mobility - Moved within same county (%)
Geographical mobility - Moved within same county (%) - White
Geographical mobility - Moved within same county (%) - Black or African American
Geographical mobility - Moved within same county (%) - Asian
Geographical mobility - Moved within same county (%) - Hispanic or Latino
Geographical mobility - Moved within same county (%) - American Indian and Alaska Native
Geographical mobility - Moved within same county (%) - Multirace
Geographical mobility - Moved within same county (%) - Other Race
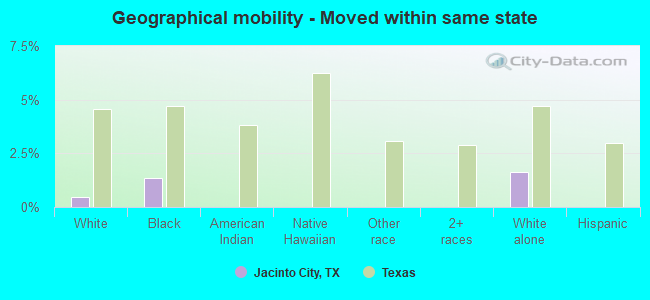
Geographical mobility - Moved from different county within same state (%)
Geographical mobility - Moved from different county within same state (%) - White
Geographical mobility - Moved from different county within same state (%) - Black or African American
Geographical mobility - Moved from different county within same state (%) - Asian
Geographical mobility - Moved from different county within same state (%) - Hispanic or Latino
Geographical mobility - Moved from different county within same state (%) - American Indian and Alaska Native
Geographical mobility - Moved from different county within same state (%) - Multirace
Geographical mobility - Moved from different county within same state (%) - Other Race
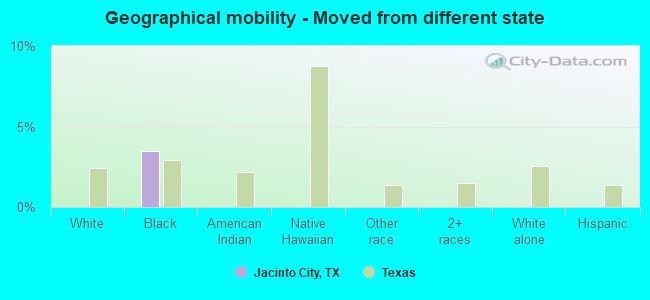
Geographical mobility - Moved from different state (%)
Geographical mobility - Moved from different state (%) - White
Geographical mobility - Moved from different state (%) - Black or African American
Geographical mobility - Moved from different state (%) - Asian
Geographical mobility - Moved from different state (%) - Hispanic or Latino
Geographical mobility - Moved from different state (%) - American Indian and Alaska Native
Geographical mobility - Moved from different state (%) - Multirace
Geographical mobility - Moved from different state (%) - Other Race
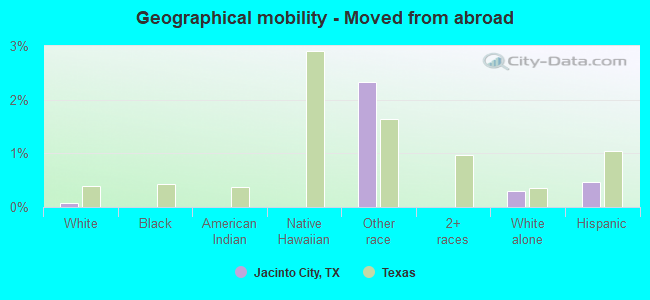
Geographical mobility - Moved from abroad (%)
Geographical mobility - Moved from abroad (%) - White
Geographical mobility - Moved from abroad (%) - Black or African American
Geographical mobility - Moved from abroad (%) - Asian
Geographical mobility - Moved from abroad (%) - Hispanic or Latino
Geographical mobility - Moved from abroad (%) - American Indian and Alaska Native
Geographical mobility - Moved from abroad (%) - Multirace
Geographical mobility - Moved from abroad (%) - Other Race
Place of birth for the foreign-born population - Ireland (%)
Place of birth for the foreign-born population - Denmark (%)
Place of birth for the foreign-born population - Norway (%)
Place of birth for the foreign-born population - Sweden (%)
Place of birth for the foreign-born population - United Kingdom (%)
Place of birth for the foreign-born population - England (%)
Place of birth for the foreign-born population - Scotland (%)
Place of birth for the foreign-born population - Other Northern Europe (%)
Place of birth for the foreign-born population - Austria (%)
Place of birth for the foreign-born population - Belgium (%)
Place of birth for the foreign-born population - France (%)
Place of birth for the foreign-born population - Germany (%)
Place of birth for the foreign-born population - Netherlands (%)
Place of birth for the foreign-born population - Switzerland (%)
Place of birth for the foreign-born population - Other Western Europe (%)
Place of birth for the foreign-born population - Greece (%)
Place of birth for the foreign-born population - Italy (%)
Place of birth for the foreign-born population - Portugal (%)
Place of birth for the foreign-born population - Spain (%)
Place of birth for the foreign-born population - Other Southern Europe (%)
Place of birth for the foreign-born population - Albania (%)
Place of birth for the foreign-born population - Belarus (%)
Place of birth for the foreign-born population - Bosnia and Herzegovina (%)
Place of birth for the foreign-born population - Bulgaria (%)
Place of birth for the foreign-born population - Croatia (%)
Place of birth for the foreign-born population - Czechoslovakia (%)
Place of birth for the foreign-born population - Hungary (%)
Place of birth for the foreign-born population - Latvia (%)
Place of birth for the foreign-born population - Lithuania (%)
Place of birth for the foreign-born population - North Macedonia (Macedonia) (%)
Place of birth for the foreign-born population - Moldova (%)
Place of birth for the foreign-born population - Poland (%)
Place of birth for the foreign-born population - Romania (%)
Place of birth for the foreign-born population - Russia (%)
Place of birth for the foreign-born population - Serbia (%)
Place of birth for the foreign-born population - Ukraine (%)
Place of birth for the foreign-born population - Other Eastern Europe (%)
Place of birth for the foreign-born population - China (%)
Place of birth for the foreign-born population - Hong Kong (%)
Place of birth for the foreign-born population - Taiwan (%)
Place of birth for the foreign-born population - Japan (%)
Place of birth for the foreign-born population - Korea (%)
Place of birth for the foreign-born population - Other Eastern Asia (%)
Place of birth for the foreign-born population - Afghanistan (%)
Place of birth for the foreign-born population - Bangladesh (%)
Place of birth for the foreign-born population - India (%)
Place of birth for the foreign-born population - Iran (%)
Place of birth for the foreign-born population - Kazakhstan (%)
Place of birth for the foreign-born population - Nepal (%)
Place of birth for the foreign-born population - Pakistan (%)
Place of birth for the foreign-born population - Sri Lanka (%)
Place of birth for the foreign-born population - Uzbekistan (%)
Place of birth for the foreign-born population - Other South Central Asia (%)
Place of birth for the foreign-born population - Burma (%)
Place of birth for the foreign-born population - Cambodia (%)
Place of birth for the foreign-born population - Indonesia (%)
Place of birth for the foreign-born population - Laos (%)
Place of birth for the foreign-born population - Malaysia (%)
Place of birth for the foreign-born population - Philippines (%)
Place of birth for the foreign-born population - Singapore (%)
Place of birth for the foreign-born population - Thailand (%)
Place of birth for the foreign-born population - Vietnam (%)
Place of birth for the foreign-born population - Other South Eastern Asia (%)
Place of birth for the foreign-born population - Armenia (%)
Place of birth for the foreign-born population - Iraq (%)
Place of birth for the foreign-born population - Israel (%)
Place of birth for the foreign-born population - Jordan (%)
Place of birth for the foreign-born population - Kuwait (%)
Place of birth for the foreign-born population - Lebanon (%)
Place of birth for the foreign-born population - Saudi Arabia (%)
Place of birth for the foreign-born population - Syria (%)
Place of birth for the foreign-born population - Turkey (%)
Place of birth for the foreign-born population - Yemen (%)
Place of birth for the foreign-born population - Other Western Asia (%)
Place of birth for the foreign-born population - Eritrea (%)
Place of birth for the foreign-born population - Ethiopia (%)
Place of birth for the foreign-born population - Kenya (%)
Place of birth for the foreign-born population - Somalia (%)
Place of birth for the foreign-born population - Uganda (%)
Place of birth for the foreign-born population - Zimbabwe (%)
Place of birth for the foreign-born population - Other Eastern Africa (%)
Place of birth for the foreign-born population - Cameroon (%)
Place of birth for the foreign-born population - Congo (%)
Place of birth for the foreign-born population - Democratic Republic of Congo (Zaire) (%)
Place of birth for the foreign-born population - Other Middle Africa (%)
Place of birth for the foreign-born population - Egypt (%)
Place of birth for the foreign-born population - Morocco (%)
Place of birth for the foreign-born population - Sudan (%)
Place of birth for the foreign-born population - Other Northern Africa (%)
Place of birth for the foreign-born population - South Africa (%)
Place of birth for the foreign-born population - Other Southern Africa (%)
Place of birth for the foreign-born population - Cabo Verde (%)
Place of birth for the foreign-born population - Ghana (%)
Place of birth for the foreign-born population - Liberia (%)
Place of birth for the foreign-born population - Nigeria (%)
Place of birth for the foreign-born population - Senegal (%)
Place of birth for the foreign-born population - Sierra Leone (%)
Place of birth for the foreign-born population - Other Western Africa (%)
Place of birth for the foreign-born population - Australia (%)
Place of birth for the foreign-born population - New Zealand (%)
Place of birth for the foreign-born population - Fiji (%)
Place of birth for the foreign-born population - Micronesia (%)
Place of birth for the foreign-born population - Bahamas (%)
Place of birth for the foreign-born population - Barbados (%)
Place of birth for the foreign-born population - Cuba (%)
Place of birth for the foreign-born population - Dominica (%)
Place of birth for the foreign-born population - Dominican Republic (%)
Place of birth for the foreign-born population - Grenada (%)
Place of birth for the foreign-born population - Haiti (%)
Place of birth for the foreign-born population - Jamaica (%)
Place of birth for the foreign-born population - St. Vincent and the Grenadines (%)
Place of birth for the foreign-born population - Trinidad and Tobago (%)
Place of birth for the foreign-born population - West Indies (%)
Place of birth for the foreign-born population - Other Caribbean (%)
Place of birth for the foreign-born population - Belize (%)
Place of birth for the foreign-born population - Costa Rica (%)
Place of birth for the foreign-born population - El Salvador (%)
Place of birth for the foreign-born population - Guatemala (%)
Place of birth for the foreign-born population - Honduras (%)
Place of birth for the foreign-born population - Mexico (%)
Place of birth for the foreign-born population - Nicaragua (%)
Place of birth for the foreign-born population - Panama (%)
Place of birth for the foreign-born population - Other Central America (%)
Place of birth for the foreign-born population - Argentina (%)
Place of birth for the foreign-born population - Bolivia (%)
Place of birth for the foreign-born population - Brazil (%)
Place of birth for the foreign-born population - Chile (%)
Place of birth for the foreign-born population - Colombia (%)
Place of birth for the foreign-born population - Ecuador (%)
Place of birth for the foreign-born population - Guyana (%)
Place of birth for the foreign-born population - Peru (%)
Place of birth for the foreign-born population - Uruguay (%)
Place of birth for the foreign-born population - Venezuela (%)
Place of birth for the foreign-born population - Other South America (%)
Place of birth for the foreign-born population - Canada (%)
Place of birth for the foreign-born population - Other Northern America (%)
Place of birth for the foreign-born population - Other (%)
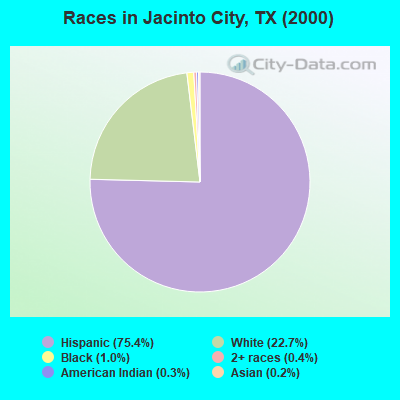
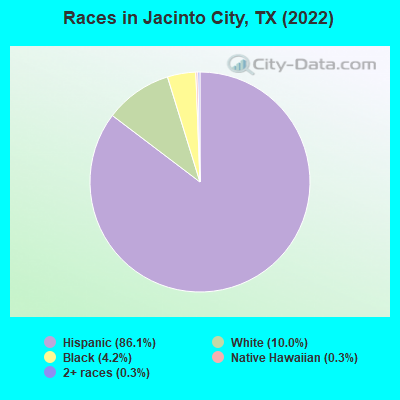
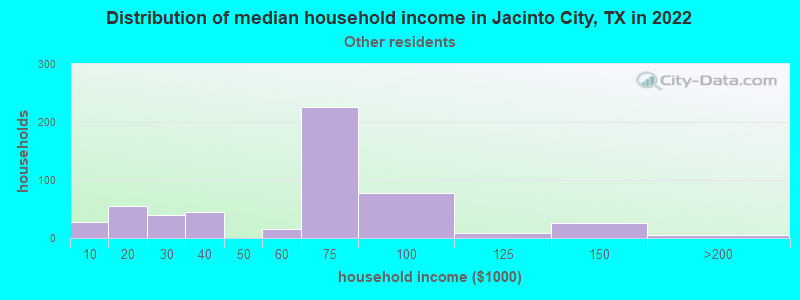
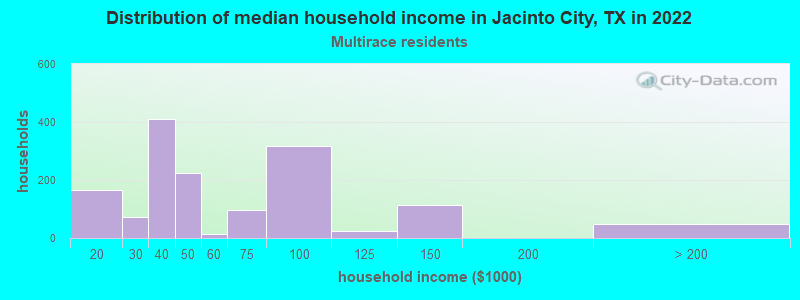
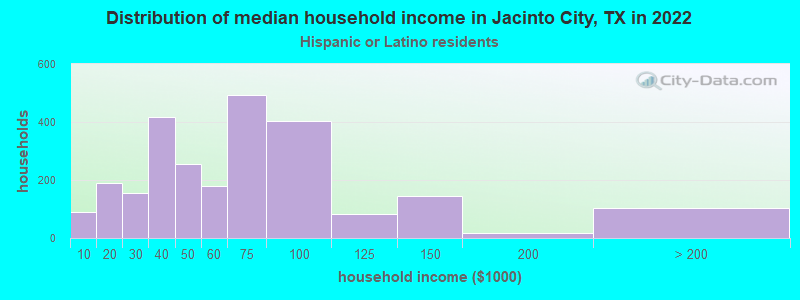
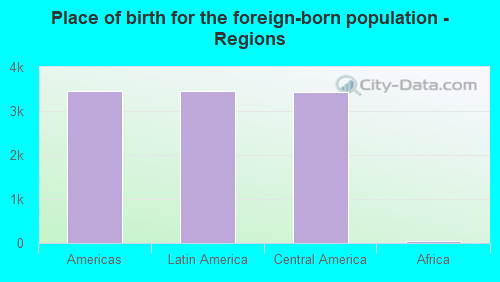
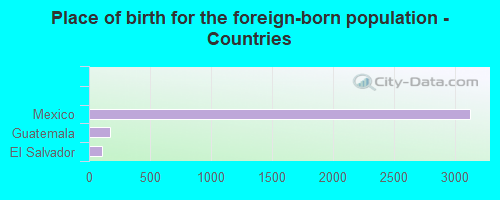
According to 2022 data, the most numerous races in Jacinto City, TX are Hispanic (8,349 residents), White alone (973 residents), and Black alone (405 residents). 23.6% of Jacinto City residents speak English at home. 36.3% of Jacinto City, TX residents are foreign-born (35.2% born in Latin America), which is 53.1% greater than the foreign-born rate of 17.0% across the entire state of Texas.
Race distribution in Jacinto City
2000 2022
10,933,313 52.4% White alone 6,669,666 32.0% Hispanic 2,364,255 11.3% Black alone 554,445 2.7% Asian alone 230,567 1.1% Two or more races 68,859 0.3% American Indian alone 19,958 0.10% Other race alone 10,757 0.05% Native Hawaiian and Other
12,070,642 40.2% Hispanic 11,683,430 38.9% White alone 3,508,706 11.7% Black alone 1,608,173 5.4% Asian alone 956,560 3.2% Two or more races 125,763 0.4% Other race alone 47,023 0.2% American Indian alone 29,275 0.10% Native Hawaiian and Other
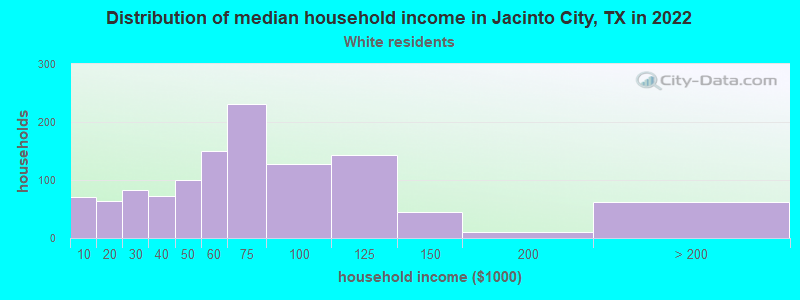
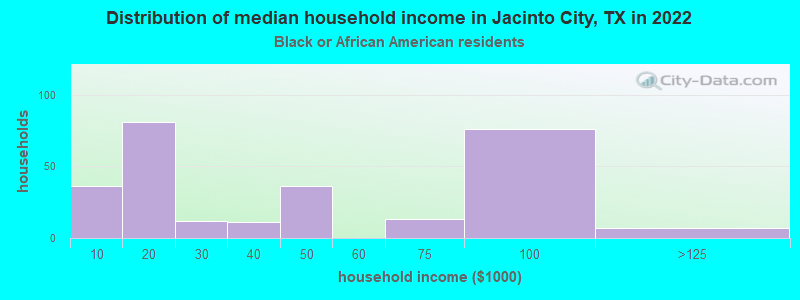
Income and house value in Jacinto City Median household income in 2022 $66,061 White non-Hispanic householders$66,446 Some other race householders$40,485 Two or more races householders$58,891 Hispanic or Latino race householdersMedian 2022 house value $136,937 White Non-Hispanic householders$100,358 American Indian or Alaska Native householders$147,567 Some other race householders$143,502 Two or more races householders$135,374 Hispanic or Latino householders
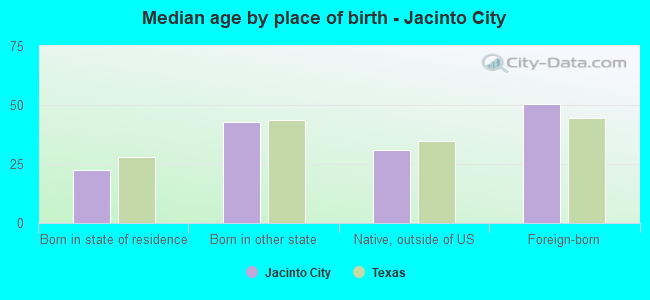
Median age by race in Jacinto City
45.1 Median age for White residents44.8 45.2 48.9 Median age for Black or African American residents44.1 59.6 21.5 Median age for American Indian / Alaska Native residents16.1 22.8 -685,964,911.6 Median age for Asian residents-682,752,456.9 -680,412,370.5 -782,795,698.1 Median age for Native Hawaiian / Pacific Islander residents-633,771,929.2 -816,367,264.7 33.8 Median age for Other race residents30.3 35.4 37.3 Median age for Two or more races residents31.8 46.6 61.8 Median age for White alone residents68.0 59.8 35.2 Median age for Hispanic or Latino residents31.4 37.0
Owner/renter occupied households by race in Jacinto City
House owners and renters - White residents 867 73.4% Owner occupied313 26.6% Renter occupiedHouse owners and renters - Black or African American residents 281 100.0% Renter occupiedHouse owners and renters - American Indian / Alaska Native residents 99 100.0% Owner occupiedHouse owners and renters - Native Hawaiian / Pacific Islander residents 35 100.0% Renter occupiedHouse owners and renters - Other race residents 429 79.1% Owner occupied113 20.9% Renter occupiedHouse owners and renters - Two or more races residents 1,092 75.7% Owner occupied351 24.3% Renter occupiedHouse owners and renters - White alone residents 322 74.1% Owner occupied113 25.9% Renter occupiedHouse owners and renters - Hispanic or Latino residents 1,873 75.0% Owner occupied623 25.0% Renter occupied
Language usage in Jacinto City
English speakers - Total 23.6% of residents of Jacinto City speak English at home.
76.5% of residents speak Spanish at home 4,284 61.2% Speak English very well2,717 38.8% Speak English less than very well0.4% of residents speak other language at home 17 41.5% Speak English very well24 58.5% Speak English less than very well
English speakers - Born in the United States 48.8% of residents of Jacinto City speak English at home.
46.0% of residents speak Spanish at home 238 90.2% Speak English very well26 9.8% Speak English less than very well3.5% of residents speak other language at home 20 100.0% Speak English very well
English speakers - Native, born elsewhere 25.7% of residents of Jacinto City speak English at home.
68.1% of residents speak Spanish at home 111 85.4% Speak English very well19 14.6% Speak English less than very well
English speakers - Foreign-born 4.8% of residents of Jacinto City speak English at home.
96.6% of residents speak Spanish at home 940 27.7% Speak English very well2,449 72.3% Speak English less than very well0.7% of residents speak other language at home 23 100.0% Speak English less than very well
White (Caucasian) - Speak only English Native:
48.5% (1,098)Foreign-born:
9.2% (55)
White (Caucasian) - Speak another language Native:
34.4% (778)Foreign-born:
83.4% (498)
Black or African American - Speak only English Native:
72.3% (265)Foreign-born:
34.2% (13)
Black or African American - Speak another language Native:
30.5% (112)Foreign-born:
65.9% (26)
American Indian / Alaska Native - Speak another language Native:
100.0% (307)Foreign-born:
98.9% (163)
Other race - Speak only English Native:
27.7% (275)Foreign-born:
14.5% (92)
Other race - Speak another language Native:
72.4% (719)Foreign-born:
84.6% (541)
Two or more races - Speak only English Native:
16.8% (386)Foreign-born:
1.0% (24)
Two or more races - Speak another language Native:
87.3% (2,013)Foreign-born:
99.0% (2,341)
White alone - Speak only English Native:
98.2% (935)Foreign-born:
100.0% (17)
Hispanic or Latino - Speak only English Native:
16.6% (705)Foreign-born:
4.2% (151)
Hispanic or Latino - Speak another language Native:
83.9% (3,570)Foreign-born:
95.7% (3,400)
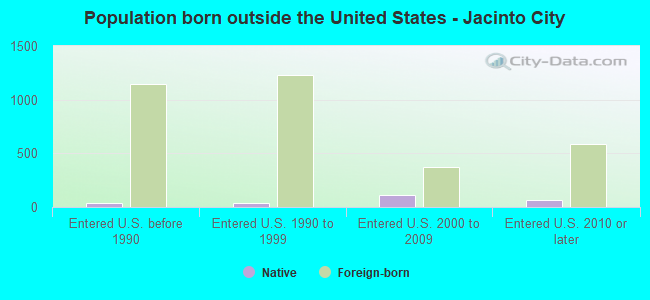
Foreign-born residents in Jacinto City 3,519 residents are foreign born (35.2% Latin America ).
This city:
36.3%Texas:
17.1%
Marital status for residents in Jacinto City Marital status - White (Caucasian) population 15 years and over
Males 37.0% Never married45.9% Now married2.9% Separated1.7% Widowed12.4% DivorcedFemales 31.1% Never married40.8% Now married6.9% Separated4.8% Widowed16.3% DivorcedWomen who gave birth in the past 12 months Now married:
0.0% (0)Unmarried:
100.0% (29)
Women who did not give birth in the past 12 months Now married:
39.2% (268)Unmarried:
60.8% (416)
Marital status - Black or African American population 15 years and over
Males 31.1% Never married53.4% Now married0.0% Separated7.8% Widowed7.8% DivorcedFemales 24.7% Never married8.0% Now married0.0% Separated9.3% Widowed58.0% DivorcedWomen who did not give birth in the past 12 months Now married:
24.5% (12)Unmarried:
75.5% (37)
Marital status - American Indian / Alaska Native population 15 years and over
Males 46.2% Never married46.2% Now married0.0% Separated0.0% Widowed7.7% DivorcedFemales 71.3% Never married28.7% Now married0.0% Separated0.0% Widowed0.0% DivorcedWomen who did not give birth in the past 12 months Now married:
28.7% (79)Unmarried:
71.3% (197)
Marital status - Other race population 15 years and over
Males 21.9% Never married65.7% Now married5.0% Separated0.0% Widowed7.4% DivorcedFemales 16.1% Never married81.8% Now married0.0% Separated0.0% Widowed2.2% DivorcedWomen who did not give birth in the past 12 months Now married:
66.4% (220)Unmarried:
33.6% (112)
Marital status - Two or more races population 15 years and over
Males 42.0% Never married48.2% Now married0.0% Separated0.0% Widowed9.8% DivorcedFemales 14.1% Never married56.0% Now married1.6% Separated9.4% Widowed19.0% DivorcedWomen who gave birth in the past 12 months Now married:
81.1% (108)Unmarried:
18.9% (25)
Women who did not give birth in the past 12 months Now married:
48.7% (418)Unmarried:
51.3% (440)
Marital status - White alone, not Hispanic / Latino population 15 years and over
Males 23.3% Never married57.6% Now married0.0% Separated1.7% Widowed17.4% DivorcedFemales 16.5% Never married49.7% Now married0.9% Separated9.1% Widowed23.8% DivorcedWomen who did not give birth in the past 12 months Now married:
20.4% (19)Unmarried:
79.6% (75)
Marital status - Hispanic or Latino population 15 years and over
Males 38.9% Never married48.5% Now married2.2% Separated0.7% Widowed9.7% DivorcedFemales 27.2% Never married50.9% Now married4.7% Separated4.7% Widowed12.5% DivorcedWomen who gave birth in the past 12 months Now married:
55.7% (75)Unmarried:
44.3% (60)
Women who did not give birth in the past 12 months Now married:
45.9% (859)Unmarried:
54.1% (1,013)
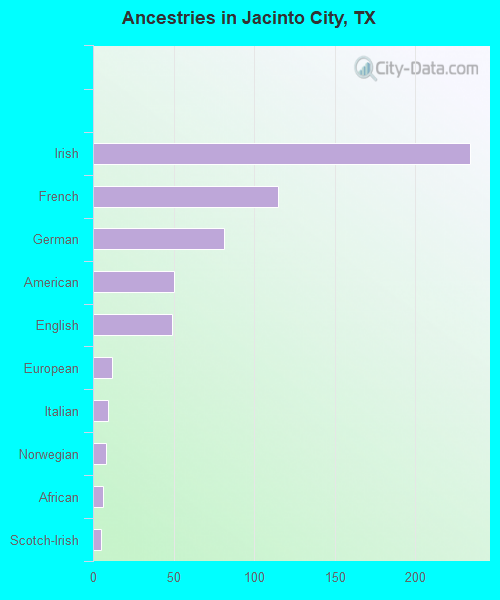
Ancestries in Jacinto City
234 3.0% Irish115 1.5% French81 1.0% German50 0.6% American49 0.6% English12 0.2% European9 0.1% Italian8 0.1% Norwegian6 0.08% African5 0.06% Scotch-Irish2 0.03% Polish
Children Nativity (place of birth) in Jacinto City
Children under 6 years - Living with two parents Both parents native 95 100.0% NativeBoth parents foreign-born 24 100.0% Foreign-bornOne native, one foreign-born parent 174 100.0% NativeChildren under 6 years - Living with one parent Native parent 29 100.0% NativeForeign-born parent 312 100.0% NativeChildren 6 to 17 years - Living with two parents Both parents native 94 100.0% NativeBoth parents foreign-born 451 100.0% NativeOne native, one foreign-born parent 231 100.0% NativeChildren 6 to 17 years - Living with one parent Native parent 247 100.0% NativeForeign-born parent 624 53.1% Native551 46.9% Foreign-born
Grandparents responsible for own grandchildren in Jacinto City
Grandparents (30 to 59 years) White / Caucasian 15 74.1% Responsible for grandchildren5 25.9% Not responsible for grandchildrenOther race 43 47.2% Responsible for grandchildren48 52.8% Not responsible for grandchildrenTwo or more races 305 100.0% Not responsible for grandchildrenWhite alone, not Hispanic / Latino 25 100.0% Responsible for grandchildrenHispanic or Latino 31 10.2% Responsible for grandchildren277 89.8% Not responsible for grandchildrenGrandparents (60 years and over) White / Caucasian 30 40.8% Responsible for grandchildren43 59.2% Not responsible for grandchildrenOther race 31 100.0% Not responsible for grandchildrenTwo or more races 273 100.0% Not responsible for grandchildrenWhite alone, not Hispanic / Latino 5 100.0% Not responsible for grandchildrenHispanic or Latino 53 18.4% Responsible for grandchildren236 81.6% Not responsible for grandchildren