Races in Islandia, New York (NY) Detailed Stats
Data:
Races - White alone (%)
Races - White alone (% change since 2000)
Races - Black alone (%)
Races - Black alone (% change since 2000)
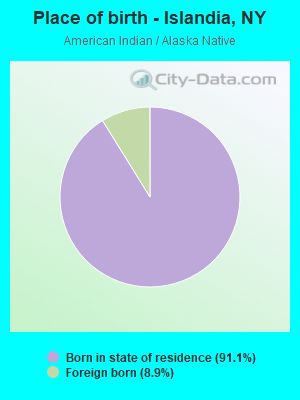
Races - American Indian alone (%)
Races - American Indian alone (% change since 2000)
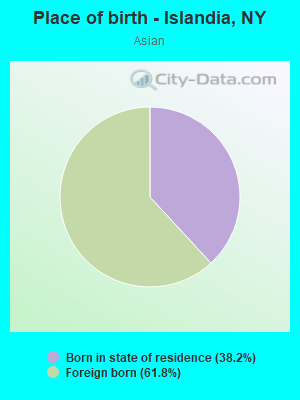
Races - Asian alone (%)
Races - Asian alone (% change since 2000)
Races - Hispanic (%)
Races - Hispanic (% change since 2000)
Races - Native Hawaiian and Other Pacific Islander alone (%)
Races - Native Hawaiian and Other Pacific Islander alone (% change since 2000)
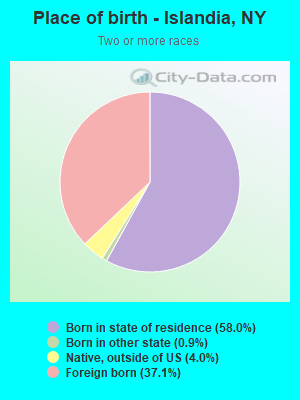
Races - Two or more races(%)
Races - Two or more races(% change since 2000)
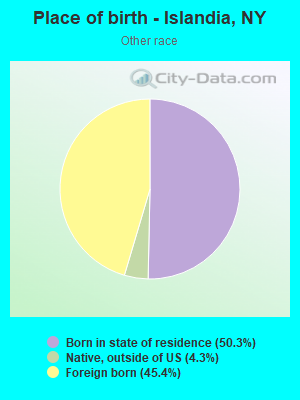
Races - Other race alone (%)
Races - Other race alone (% change since 2000)
Racial diversity
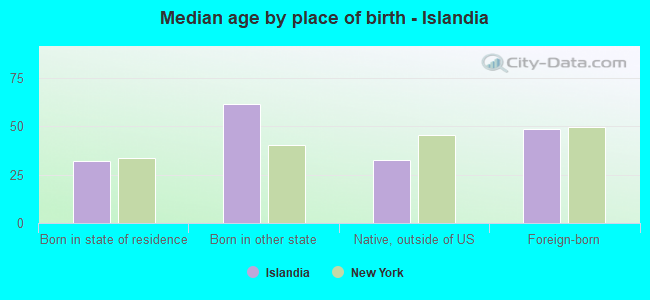
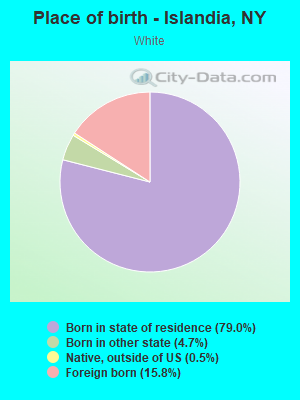
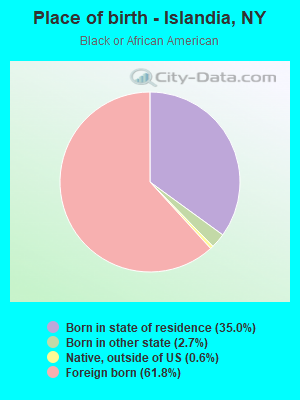
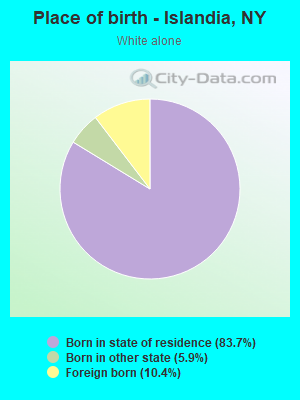
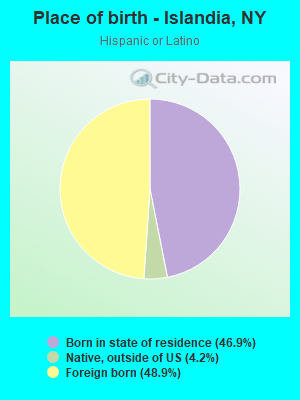
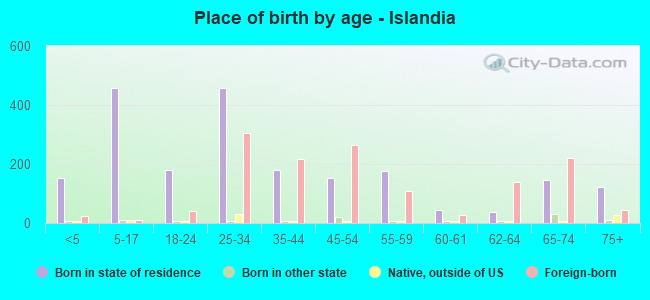
Place of birth - Born in state of residence (%)
Place of birth - Born in state of residence (%) - White
Place of birth - Born in state of residence (%) - Black or African American
Place of birth - Born in state of residence (%) - Asian
Place of birth - Born in state of residence (%) - Hispanic or Latino
Place of birth - Born in state of residence (%) - American Indian and Alaska Native
Place of birth - Born in state of residence (%) - Multirace
Place of birth - Born in state of residence (%) - Other Race
Place of birth - Born in other state (%)
Place of birth - Born in other state (%) - White
Place of birth - Born in other state (%) - Black or African American
Place of birth - Born in other state (%) - Asian
Place of birth - Born in other state (%) - Hispanic or Latino
Place of birth - Born in other state (%) - American Indian and Alaska Native
Place of birth - Born in other state (%) - Multirace
Place of birth - Born in other state (%) - Other Race
Place of birth - Native, outside of US (%)
Place of birth - Native, outside of US (%) - White
Place of birth - Native, outside of US (%) - Black or African American
Place of birth - Native, outside of US (%) - Asian
Place of birth - Native, outside of US (%) - Hispanic or Latino
Place of birth - Native, outside of US (%) - American Indian and Alaska Native
Place of birth - Native, outside of US (%) - Multirace
Place of birth - Native, outside of US (%) - Other Race
Place of birth - Foreign born (%)
Place of birth - Foreign born (%) - White
Place of birth - Foreign born (%) - Black or African American
Place of birth - Foreign born (%) - Asian
Place of birth - Foreign born (%) - Hispanic or Latino
Place of birth - Foreign born (%) - American Indian and Alaska Native
Place of birth - Foreign born (%) - Multirace
Place of birth - Foreign born (%) - Other Race
Residents speaking English at home (%)
Residents speaking English at home - Born in the United States (%)
Residents speaking English at home - Native, born elsewhere (%)
Residents speaking English at home - Foreign born (%)
Residents speaking Spanish at home (%)
Residents speaking Spanish at home - Born in the United States (%)
Residents speaking Spanish at home - Native, born elsewhere (%)
Residents speaking Spanish at home - Foreign born (%)
Residents speaking other language at home (%)
Residents speaking other language at home - Born in the United States (%)
Residents speaking other language at home - Native, born elsewhere (%)
Residents speaking other language at home - Foreign born (%)
Marital status - Never married (%)
Marital status - Now married (%)
Marital status - Separated (%)
Marital status - Widowed (%)
Marital status - Divorced (%)
Ancestries Reported - Arab (%)
Ancestries Reported - Czech (%)
Ancestries Reported - Danish (%)
Ancestries Reported - Dutch (%)
Ancestries Reported - English (%)
Ancestries Reported - French (%)
Ancestries Reported - French Canadian (%)
Ancestries Reported - German (%)
Ancestries Reported - Greek (%)
Ancestries Reported - Hungarian (%)
Ancestries Reported - Irish (%)
Ancestries Reported - Italian (%)
Ancestries Reported - Lithuanian (%)
Ancestries Reported - Norwegian (%)
Ancestries Reported - Polish (%)
Ancestries Reported - Portuguese (%)
Ancestries Reported - Russian (%)
Ancestries Reported - Scotch-Irish (%)
Ancestries Reported - Scottish (%)
Ancestries Reported - Slovak (%)
Ancestries Reported - Subsaharan African (%)
Ancestries Reported - Swedish (%)
Ancestries Reported - Swiss (%)
Ancestries Reported - Ukrainian (%)
Ancestries Reported - United States (%)
Ancestries Reported - Welsh (%)
Ancestries Reported - West Indian (%)
Ancestries Reported - Other (%)
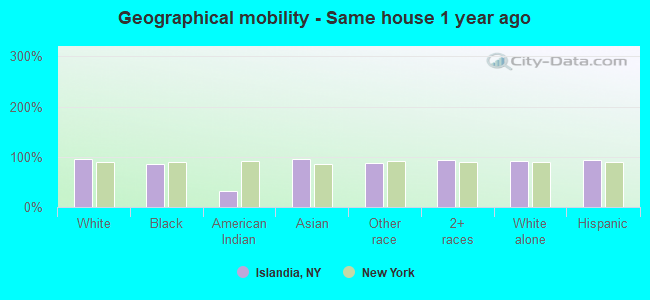
Geographical mobility - Same house 1 year ago (%)
Geographical mobility - Same house 1 year ago (%) - White
Geographical mobility - Same house 1 year ago (%) - Black or African American
Geographical mobility - Same house 1 year ago (%) - Asian
Geographical mobility - Same house 1 year ago (%) - Hispanic or Latino
Geographical mobility - Same house 1 year ago (%) - American Indian and Alaska Native
Geographical mobility - Same house 1 year ago (%) - Multirace
Geographical mobility - Same house 1 year ago (%) - Other Race
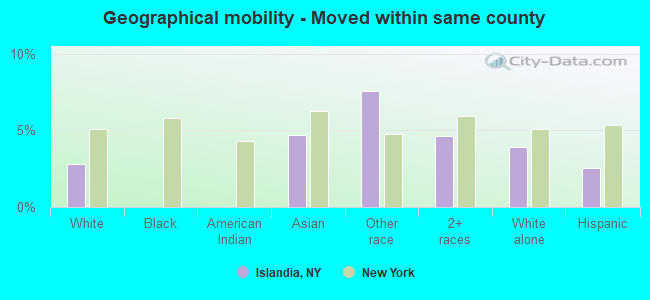
Geographical mobility - Moved within same county (%)
Geographical mobility - Moved within same county (%) - White
Geographical mobility - Moved within same county (%) - Black or African American
Geographical mobility - Moved within same county (%) - Asian
Geographical mobility - Moved within same county (%) - Hispanic or Latino
Geographical mobility - Moved within same county (%) - American Indian and Alaska Native
Geographical mobility - Moved within same county (%) - Multirace
Geographical mobility - Moved within same county (%) - Other Race
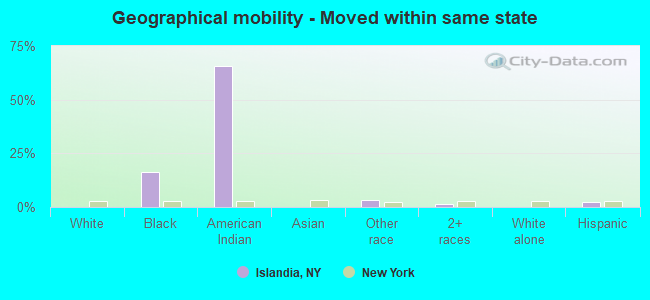
Geographical mobility - Moved from different county within same state (%)
Geographical mobility - Moved from different county within same state (%) - White
Geographical mobility - Moved from different county within same state (%) - Black or African American
Geographical mobility - Moved from different county within same state (%) - Asian
Geographical mobility - Moved from different county within same state (%) - Hispanic or Latino
Geographical mobility - Moved from different county within same state (%) - American Indian and Alaska Native
Geographical mobility - Moved from different county within same state (%) - Multirace
Geographical mobility - Moved from different county within same state (%) - Other Race
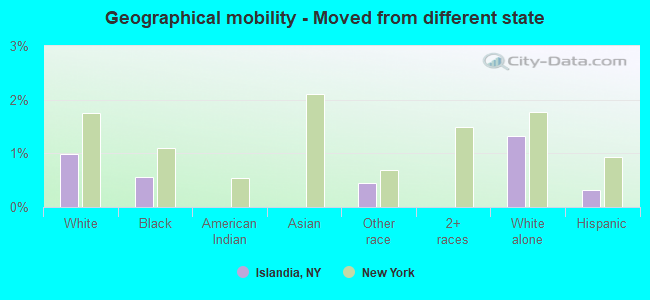
Geographical mobility - Moved from different state (%)
Geographical mobility - Moved from different state (%) - White
Geographical mobility - Moved from different state (%) - Black or African American
Geographical mobility - Moved from different state (%) - Asian
Geographical mobility - Moved from different state (%) - Hispanic or Latino
Geographical mobility - Moved from different state (%) - American Indian and Alaska Native
Geographical mobility - Moved from different state (%) - Multirace
Geographical mobility - Moved from different state (%) - Other Race
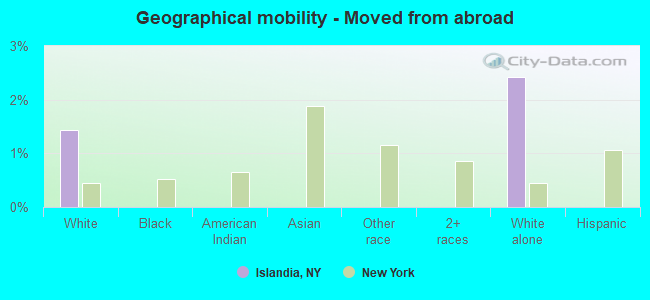
Geographical mobility - Moved from abroad (%)
Geographical mobility - Moved from abroad (%) - White
Geographical mobility - Moved from abroad (%) - Black or African American
Geographical mobility - Moved from abroad (%) - Asian
Geographical mobility - Moved from abroad (%) - Hispanic or Latino
Geographical mobility - Moved from abroad (%) - American Indian and Alaska Native
Geographical mobility - Moved from abroad (%) - Multirace
Geographical mobility - Moved from abroad (%) - Other Race
Place of birth for the foreign-born population - Ireland (%)
Place of birth for the foreign-born population - Denmark (%)
Place of birth for the foreign-born population - Norway (%)
Place of birth for the foreign-born population - Sweden (%)
Place of birth for the foreign-born population - United Kingdom (%)
Place of birth for the foreign-born population - England (%)
Place of birth for the foreign-born population - Scotland (%)
Place of birth for the foreign-born population - Other Northern Europe (%)
Place of birth for the foreign-born population - Austria (%)
Place of birth for the foreign-born population - Belgium (%)
Place of birth for the foreign-born population - France (%)
Place of birth for the foreign-born population - Germany (%)
Place of birth for the foreign-born population - Netherlands (%)
Place of birth for the foreign-born population - Switzerland (%)
Place of birth for the foreign-born population - Other Western Europe (%)
Place of birth for the foreign-born population - Greece (%)
Place of birth for the foreign-born population - Italy (%)
Place of birth for the foreign-born population - Portugal (%)
Place of birth for the foreign-born population - Spain (%)
Place of birth for the foreign-born population - Other Southern Europe (%)
Place of birth for the foreign-born population - Albania (%)
Place of birth for the foreign-born population - Belarus (%)
Place of birth for the foreign-born population - Bosnia and Herzegovina (%)
Place of birth for the foreign-born population - Bulgaria (%)
Place of birth for the foreign-born population - Croatia (%)
Place of birth for the foreign-born population - Czechoslovakia (%)
Place of birth for the foreign-born population - Hungary (%)
Place of birth for the foreign-born population - Latvia (%)
Place of birth for the foreign-born population - Lithuania (%)
Place of birth for the foreign-born population - North Macedonia (Macedonia) (%)
Place of birth for the foreign-born population - Moldova (%)
Place of birth for the foreign-born population - Poland (%)
Place of birth for the foreign-born population - Romania (%)
Place of birth for the foreign-born population - Russia (%)
Place of birth for the foreign-born population - Serbia (%)
Place of birth for the foreign-born population - Ukraine (%)
Place of birth for the foreign-born population - Other Eastern Europe (%)
Place of birth for the foreign-born population - China (%)
Place of birth for the foreign-born population - Hong Kong (%)
Place of birth for the foreign-born population - Taiwan (%)
Place of birth for the foreign-born population - Japan (%)
Place of birth for the foreign-born population - Korea (%)
Place of birth for the foreign-born population - Other Eastern Asia (%)
Place of birth for the foreign-born population - Afghanistan (%)
Place of birth for the foreign-born population - Bangladesh (%)
Place of birth for the foreign-born population - India (%)
Place of birth for the foreign-born population - Iran (%)
Place of birth for the foreign-born population - Kazakhstan (%)
Place of birth for the foreign-born population - Nepal (%)
Place of birth for the foreign-born population - Pakistan (%)
Place of birth for the foreign-born population - Sri Lanka (%)
Place of birth for the foreign-born population - Uzbekistan (%)
Place of birth for the foreign-born population - Other South Central Asia (%)
Place of birth for the foreign-born population - Burma (%)
Place of birth for the foreign-born population - Cambodia (%)
Place of birth for the foreign-born population - Indonesia (%)
Place of birth for the foreign-born population - Laos (%)
Place of birth for the foreign-born population - Malaysia (%)
Place of birth for the foreign-born population - Philippines (%)
Place of birth for the foreign-born population - Singapore (%)
Place of birth for the foreign-born population - Thailand (%)
Place of birth for the foreign-born population - Vietnam (%)
Place of birth for the foreign-born population - Other South Eastern Asia (%)
Place of birth for the foreign-born population - Armenia (%)
Place of birth for the foreign-born population - Iraq (%)
Place of birth for the foreign-born population - Israel (%)
Place of birth for the foreign-born population - Jordan (%)
Place of birth for the foreign-born population - Kuwait (%)
Place of birth for the foreign-born population - Lebanon (%)
Place of birth for the foreign-born population - Saudi Arabia (%)
Place of birth for the foreign-born population - Syria (%)
Place of birth for the foreign-born population - Turkey (%)
Place of birth for the foreign-born population - Yemen (%)
Place of birth for the foreign-born population - Other Western Asia (%)
Place of birth for the foreign-born population - Eritrea (%)
Place of birth for the foreign-born population - Ethiopia (%)
Place of birth for the foreign-born population - Kenya (%)
Place of birth for the foreign-born population - Somalia (%)
Place of birth for the foreign-born population - Uganda (%)
Place of birth for the foreign-born population - Zimbabwe (%)
Place of birth for the foreign-born population - Other Eastern Africa (%)
Place of birth for the foreign-born population - Cameroon (%)
Place of birth for the foreign-born population - Congo (%)
Place of birth for the foreign-born population - Democratic Republic of Congo (Zaire) (%)
Place of birth for the foreign-born population - Other Middle Africa (%)
Place of birth for the foreign-born population - Egypt (%)
Place of birth for the foreign-born population - Morocco (%)
Place of birth for the foreign-born population - Sudan (%)
Place of birth for the foreign-born population - Other Northern Africa (%)
Place of birth for the foreign-born population - South Africa (%)
Place of birth for the foreign-born population - Other Southern Africa (%)
Place of birth for the foreign-born population - Cabo Verde (%)
Place of birth for the foreign-born population - Ghana (%)
Place of birth for the foreign-born population - Liberia (%)
Place of birth for the foreign-born population - Nigeria (%)
Place of birth for the foreign-born population - Senegal (%)
Place of birth for the foreign-born population - Sierra Leone (%)
Place of birth for the foreign-born population - Other Western Africa (%)
Place of birth for the foreign-born population - Australia (%)
Place of birth for the foreign-born population - New Zealand (%)
Place of birth for the foreign-born population - Fiji (%)
Place of birth for the foreign-born population - Micronesia (%)
Place of birth for the foreign-born population - Bahamas (%)
Place of birth for the foreign-born population - Barbados (%)
Place of birth for the foreign-born population - Cuba (%)
Place of birth for the foreign-born population - Dominica (%)
Place of birth for the foreign-born population - Dominican Republic (%)
Place of birth for the foreign-born population - Grenada (%)
Place of birth for the foreign-born population - Haiti (%)
Place of birth for the foreign-born population - Jamaica (%)
Place of birth for the foreign-born population - St. Vincent and the Grenadines (%)
Place of birth for the foreign-born population - Trinidad and Tobago (%)
Place of birth for the foreign-born population - West Indies (%)
Place of birth for the foreign-born population - Other Caribbean (%)
Place of birth for the foreign-born population - Belize (%)
Place of birth for the foreign-born population - Costa Rica (%)
Place of birth for the foreign-born population - El Salvador (%)
Place of birth for the foreign-born population - Guatemala (%)
Place of birth for the foreign-born population - Honduras (%)
Place of birth for the foreign-born population - Mexico (%)
Place of birth for the foreign-born population - Nicaragua (%)
Place of birth for the foreign-born population - Panama (%)
Place of birth for the foreign-born population - Other Central America (%)
Place of birth for the foreign-born population - Argentina (%)
Place of birth for the foreign-born population - Bolivia (%)
Place of birth for the foreign-born population - Brazil (%)
Place of birth for the foreign-born population - Chile (%)
Place of birth for the foreign-born population - Colombia (%)
Place of birth for the foreign-born population - Ecuador (%)
Place of birth for the foreign-born population - Guyana (%)
Place of birth for the foreign-born population - Peru (%)
Place of birth for the foreign-born population - Uruguay (%)
Place of birth for the foreign-born population - Venezuela (%)
Place of birth for the foreign-born population - Other South America (%)
Place of birth for the foreign-born population - Canada (%)
Place of birth for the foreign-born population - Other Northern America (%)
Place of birth for the foreign-born population - Other (%)
Latest news about races in Islandia, NY collected exclusively by city-data.com from local newspapers, TV, and radio stations
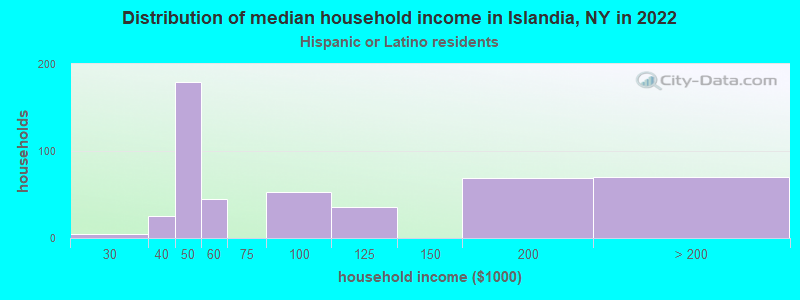
According to 2022 data, the most numerous races in Islandia, NY are White alone (1,101 residents), Hispanic (1,421 residents), and Black alone (425 residents). 51.4% of Islandia residents speak English at home. 35.9% of Islandia, NY residents are foreign-born (26.5% born in Latin America, 7.0% born in Asia), which is 38.7% greater than the foreign-born rate of 22.0% across the entire state of New York.
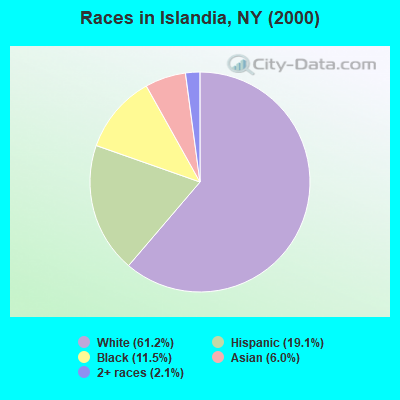
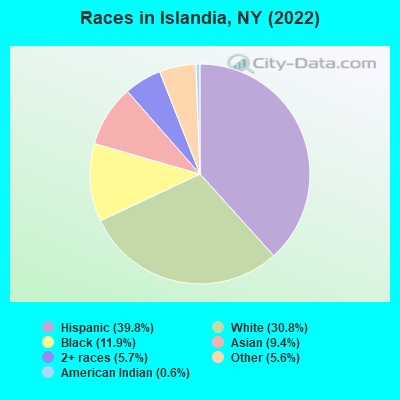
Race distribution in Islandia
2000 2022
11,760,981 62.0% White alone 2,867,583 15.1% Hispanic 2,812,623 14.8% Black alone 1,035,926 5.5% Asian alone 366,116 1.9% Two or more races 75,499 0.4% Other race alone 52,499 0.3% American Indian alone 5,230 0.03% Native Hawaiian and Other
10,408,933 52.9% White alone 3,867,299 19.7% Hispanic 2,633,840 13.4% Black alone 1,776,286 9.0% Asian alone 732,670 3.7% Two or more races 216,110 1.1% Other race alone 35,082 0.2% American Indian alone 6,931 0.04% Native Hawaiian and Other
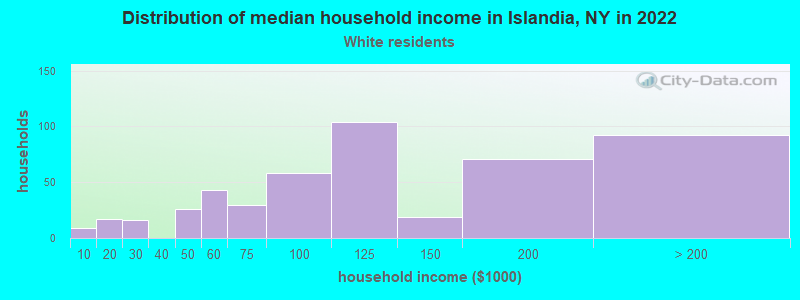
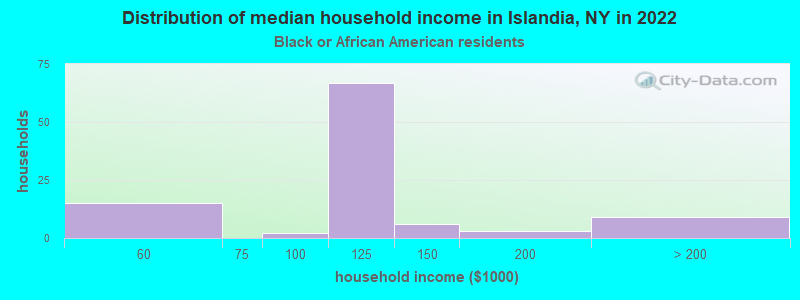
Income and house value in Islandia Median household income in 2022 $104,008 White non-Hispanic householders$120,053 Black householdersover $200,000 Asian householders$109,216 Some other race householders$45,945 Two or more races householders$73,809 Hispanic or Latino race householdersMedian 2022 house value $466,230 White Non-Hispanic householders$493,880 Black or African American householders $488,585 Asian householders$433,579 Some other race householders$543,297 Two or more races householders$465,641 Hispanic or Latino householders
Median age by race in Islandia
48.5 Median age for White residents43.9 49.2 37.6 Median age for Black or African American residents37.1 41.7 55.5 Median age for American Indian / Alaska Native residents-807,017,543.1 -513,692,161.9 58.4 Median age for Asian residents64.7 57.0 -742,816,091.2 Median age for Native Hawaiian / Pacific Islander residents-831,187,409.8 -771,300,447.7 31.0 Median age for Other race residents30.7 24.2 32.8 Median age for Two or more races residents31.8 36.9 52.5 Median age for White alone residents53.3 51.7 32.4 Median age for Hispanic or Latino residents32.2 34.1
Owner/renter occupied households by race in Islandia
House owners and renters - White residents 488 98.0% Owner occupied10 2.0% Renter occupiedHouse owners and renters - Black or African American residents 80 77.0% Owner occupied24 23.0% Renter occupiedHouse owners and renters - American Indian / Alaska Native residents 23 83.3% Owner occupied5 16.7% Renter occupiedHouse owners and renters - Asian residents 125 100.0% Owner occupiedHouse owners and renters - Other race residents 217 100.0% Owner occupiedHouse owners and renters - Two or more races residents 272 100.0% Owner occupiedHouse owners and renters - White alone residents 389 97.3% Owner occupied11 2.7% Renter occupiedHouse owners and renters - Hispanic or Latino residents 420 100.0% Owner occupied
Language usage in Islandia
English speakers - Total 51.4% of residents of Islandia speak English at home.
31.7% of residents speak Spanish at home 731 68.0% Speak English very well344 32.0% Speak English less than very well18.1% of residents speak other language at home 438 71.2% Speak English very well177 28.8% Speak English less than very well
English speakers - Born in the United States 89.2% of residents of Islandia speak English at home.
10.8% of residents speak other language at home 9 100.0% Speak English very well
English speakers - Native, born elsewhere 42.0% of residents of Islandia speak English at home.
53.6% of residents speak Spanish at home 32 86.5% Speak English very well5 13.5% Speak English less than very well
English speakers - Foreign-born 24.2% of residents of Islandia speak English at home.
47.0% of residents speak Spanish at home 327 51.1% Speak English very well313 48.9% Speak English less than very well26.4% of residents speak other language at home 210 58.3% Speak English very well150 41.7% Speak English less than very well
White (Caucasian) - Speak only English Native:
82.8% (903)Foreign-born:
22.0% (47)
White (Caucasian) - Speak another language Native:
14.0% (152)Foreign-born:
75.7% (161)
Black or African American - Speak only English Native:
72.3% (118)Foreign-born:
90.6% (231)
Black or African American - Speak another language Native:
33.2% (54)Foreign-born:
16.5% (42)
Asian - Speak only English Native:
36.8% (46)Foreign-born:
4.2% (9)
Asian - Speak another language Native:
64.8% (81)Foreign-born:
100.0% (210)
Other race - Speak only English Native:
36.3% (181)Foreign-born:
14.6% (73)
Other race - Speak another language Native:
63.3% (316)Foreign-born:
83.8% (422)
Two or more races - Speak only English Native:
65.5% (275)Foreign-born:
6.3% (16)
Two or more races - Speak another language Native:
34.5% (145)Foreign-born:
94.5% (238)
White alone - Speak only English Native:
88.9% (841)Foreign-born:
44.6% (51)
White alone - Speak another language Native:
11.5% (109)Foreign-born:
55.5% (63)
Hispanic or Latino - Speak only English Native:
36.5% (241)Foreign-born:
4.6% (33)
Hispanic or Latino - Speak another language Native:
62.7% (415)Foreign-born:
95.6% (671)
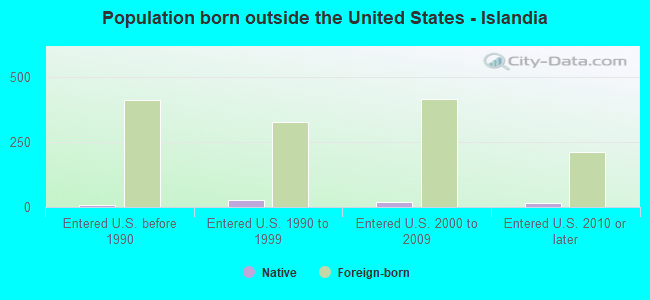
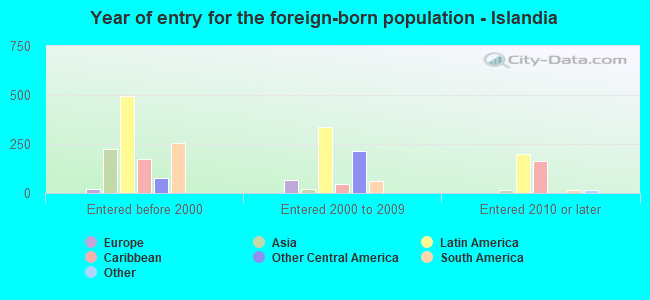
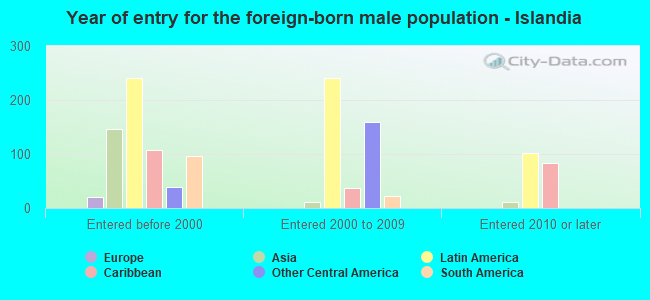
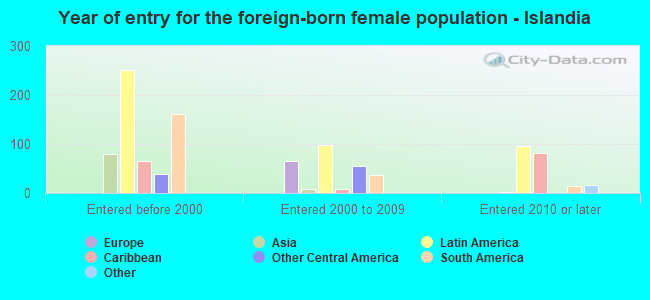
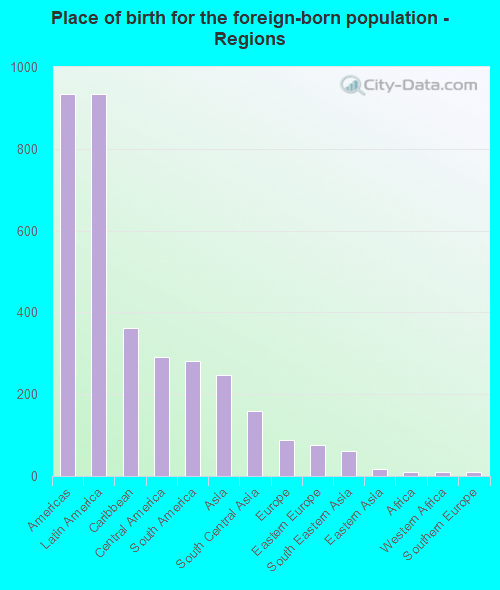
Foreign-born residents in Islandia 1,282 residents are foreign born (26.5% Latin America , 7.0% Asia ).
This city:
35.9%New York:
22.6%
Marital status for residents in Islandia Marital status - White (Caucasian) population 15 years and over
Males 33.5% Never married46.8% Now married1.3% Separated4.1% Widowed14.3% DivorcedFemales 31.2% Never married34.3% Now married4.9% Separated13.0% Widowed16.5% DivorcedWomen who gave birth in the past 12 months Now married:
100.0% (8)Unmarried:
0.0% (0)
Women who did not give birth in the past 12 months Now married:
44.5% (166)Unmarried:
55.5% (207)
Marital status - Black or African American population 15 years and over
Males 12.9% Never married79.1% Now married0.0% Separated0.0% Widowed8.0% DivorcedFemales 37.0% Never married39.0% Now married22.7% Separated0.6% Widowed0.6% DivorcedWomen who gave birth in the past 12 months Now married:
0.0% (0)Unmarried:
100.0% (2)
Women who did not give birth in the past 12 months Now married:
32.9% (27)Unmarried:
67.1% (55)
Marital status - American Indian / Alaska Native population 15 years and over
Males 0.0% Never married100.0% Now married0.0% Separated0.0% Widowed0.0% DivorcedFemales 0.0% Never married0.0% Now married0.0% Separated0.0% Widowed100.0% DivorcedWomen who did not give birth in the past 12 months Now married:
0.0% (0)Unmarried:
100.0% (30)
Marital status - Asian population 15 years and over
Males 31.5% Never married61.6% Now married3.0% Separated0.0% Widowed3.9% DivorcedFemales 37.3% Never married59.1% Now married0.0% Separated0.0% Widowed3.6% DivorcedWomen who gave birth in the past 12 months Now married:
0.0% (0)Unmarried:
100.0% (21)
Women who did not give birth in the past 12 months Now married:
19.2% (5)Unmarried:
80.8% (22)
Marital status - Other race population 15 years and over
Males 38.6% Never married53.7% Now married0.0% Separated0.0% Widowed7.7% DivorcedFemales 42.0% Never married26.8% Now married13.8% Separated8.9% Widowed8.6% DivorcedWomen who did not give birth in the past 12 months Now married:
35.8% (92)Unmarried:
64.2% (165)
Marital status - Two or more races population 15 years and over
Males 13.3% Never married81.9% Now married4.8% Separated0.0% Widowed0.0% DivorcedFemales 20.6% Never married50.0% Now married3.9% Separated9.3% Widowed16.2% DivorcedWomen who did not give birth in the past 12 months Now married:
65.4% (149)Unmarried:
34.6% (79)
Marital status - White alone, not Hispanic / Latino population 15 years and over
Males 30.6% Never married44.5% Now married1.6% Separated5.2% Widowed18.1% DivorcedFemales 33.1% Never married34.7% Now married4.7% Separated14.0% Widowed13.5% DivorcedWomen who gave birth in the past 12 months Now married:
100.0% (5)Unmarried:
0.0% (0)
Women who did not give birth in the past 12 months Now married:
39.6% (105)Unmarried:
60.4% (161)
Marital status - Hispanic or Latino population 15 years and over
Males 24.6% Never married69.2% Now married1.9% Separated0.0% Widowed4.3% DivorcedFemales 28.3% Never married35.4% Now married10.3% Separated9.9% Widowed16.1% DivorcedWomen who gave birth in the past 12 months Now married:
100.0% (4)Unmarried:
0.0% (0)
Women who did not give birth in the past 12 months Now married:
55.4% (229)Unmarried:
44.6% (185)
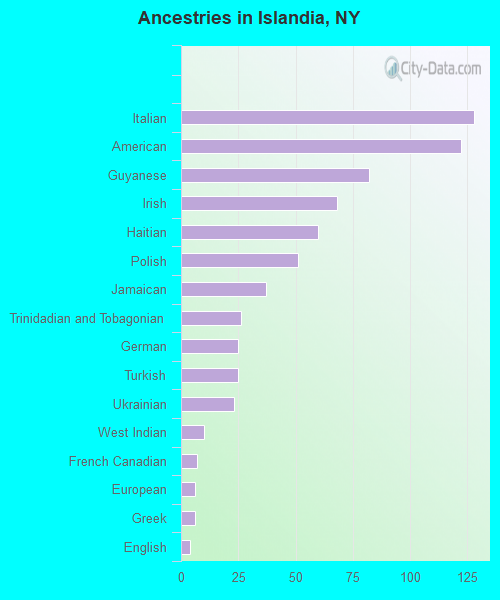
Ancestries in Islandia
128 6.9% Italian122 6.6% American82 4.5% Guyanese68 3.7% Irish60 3.3% Haitian51 2.8% Polish37 2.0% Jamaican26 1.4% Trinidadian and Tobagonian25 1.4% German25 1.4% Turkish23 1.2% Ukrainian10 0.5% West Indian7 0.4% French Canadian6 0.3% European6 0.3% Greek4 0.2% English
Children Nativity (place of birth) in Islandia
Children under 6 years - Living with two parents Both parents native 62 100.0% NativeBoth parents foreign-born 24 100.0% NativeOne native, one foreign-born parent 17 100.0% NativeChildren under 6 years - Living with one parent Native parent 5 75.9% Native2 24.1% Foreign-bornForeign-born parent 97 87.5% Native14 12.5% Foreign-bornChildren 6 to 17 years - Living with two parents Both parents native 61 100.0% NativeBoth parents foreign-born 80 100.0% NativeOne native, one foreign-born parent 29 100.0% NativeChildren 6 to 17 years - Living with one parent Native parent 30 100.0% NativeForeign-born parent 238 51.9% Native221 48.1% Foreign-born
Grandparents responsible for own grandchildren in Islandia
Grandparents (30 to 59 years) Black or African American 8 100.0% Not responsible for grandchildrenOther race 8 100.0% Not responsible for grandchildrenHispanic or Latino 16 100.0% Not responsible for grandchildren
Grandparents (60 years and over) Black or African American 66 100.0% Not responsible for grandchildrenOther race 77 100.0% Not responsible for grandchildrenHispanic or Latino 74 100.0% Not responsible for grandchildren