Races in International Falls, Minnesota (MN) Detailed Stats
Data:
Races - White alone (%)
Races - White alone (% change since 2000)
Races - Black alone (%)
Races - Black alone (% change since 2000)
Races - American Indian alone (%)
Races - American Indian alone (% change since 2000)
Races - Asian alone (%)
Races - Asian alone (% change since 2000)
Races - Hispanic (%)
Races - Hispanic (% change since 2000)
Races - Native Hawaiian and Other Pacific Islander alone (%)
Races - Native Hawaiian and Other Pacific Islander alone (% change since 2000)
Races - Two or more races(%)
Races - Two or more races(% change since 2000)
Races - Other race alone (%)
Races - Other race alone (% change since 2000)
Racial diversity
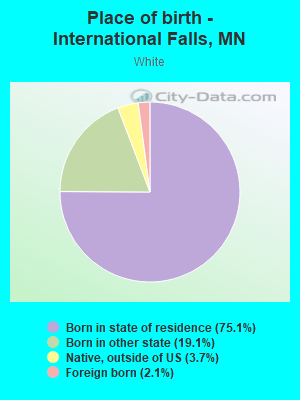
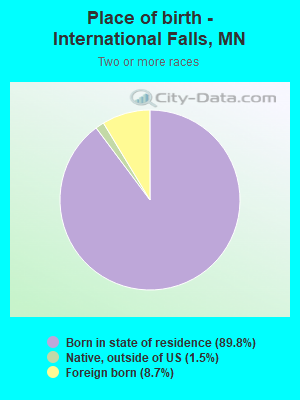
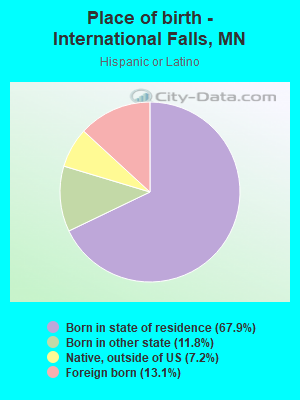
Place of birth - Born in state of residence (%)
Place of birth - Born in state of residence (%) - White
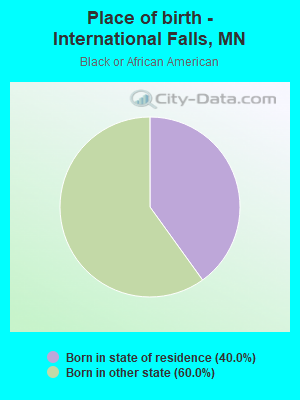
Place of birth - Born in state of residence (%) - Black or African American
Place of birth - Born in state of residence (%) - Asian
Place of birth - Born in state of residence (%) - Hispanic or Latino
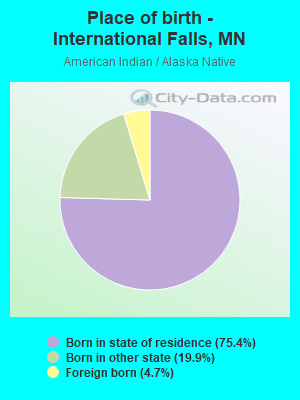
Place of birth - Born in state of residence (%) - American Indian and Alaska Native
Place of birth - Born in state of residence (%) - Multirace
Place of birth - Born in state of residence (%) - Other Race
Place of birth - Born in other state (%)
Place of birth - Born in other state (%) - White
Place of birth - Born in other state (%) - Black or African American
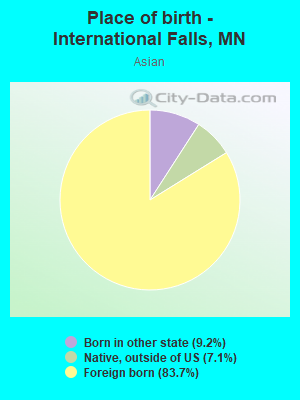
Place of birth - Born in other state (%) - Asian
Place of birth - Born in other state (%) - Hispanic or Latino
Place of birth - Born in other state (%) - American Indian and Alaska Native
Place of birth - Born in other state (%) - Multirace
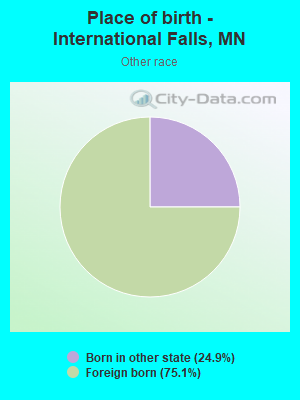
Place of birth - Born in other state (%) - Other Race
Place of birth - Native, outside of US (%)
Place of birth - Native, outside of US (%) - White
Place of birth - Native, outside of US (%) - Black or African American
Place of birth - Native, outside of US (%) - Asian
Place of birth - Native, outside of US (%) - Hispanic or Latino
Place of birth - Native, outside of US (%) - American Indian and Alaska Native
Place of birth - Native, outside of US (%) - Multirace
Place of birth - Native, outside of US (%) - Other Race
Place of birth - Foreign born (%)
Place of birth - Foreign born (%) - White
Place of birth - Foreign born (%) - Black or African American
Place of birth - Foreign born (%) - Asian
Place of birth - Foreign born (%) - Hispanic or Latino
Place of birth - Foreign born (%) - American Indian and Alaska Native
Place of birth - Foreign born (%) - Multirace
Place of birth - Foreign born (%) - Other Race
Residents speaking English at home (%)
Residents speaking English at home - Born in the United States (%)
Residents speaking English at home - Native, born elsewhere (%)
Residents speaking English at home - Foreign born (%)
Residents speaking Spanish at home (%)
Residents speaking Spanish at home - Born in the United States (%)
Residents speaking Spanish at home - Native, born elsewhere (%)
Residents speaking Spanish at home - Foreign born (%)
Residents speaking other language at home (%)
Residents speaking other language at home - Born in the United States (%)
Residents speaking other language at home - Native, born elsewhere (%)
Residents speaking other language at home - Foreign born (%)
Marital status - Never married (%)
Marital status - Now married (%)
Marital status - Separated (%)
Marital status - Widowed (%)
Marital status - Divorced (%)
Ancestries Reported - Arab (%)
Ancestries Reported - Czech (%)
Ancestries Reported - Danish (%)
Ancestries Reported - Dutch (%)
Ancestries Reported - English (%)
Ancestries Reported - French (%)
Ancestries Reported - French Canadian (%)
Ancestries Reported - German (%)
Ancestries Reported - Greek (%)
Ancestries Reported - Hungarian (%)
Ancestries Reported - Irish (%)
Ancestries Reported - Italian (%)
Ancestries Reported - Lithuanian (%)
Ancestries Reported - Norwegian (%)
Ancestries Reported - Polish (%)
Ancestries Reported - Portuguese (%)
Ancestries Reported - Russian (%)
Ancestries Reported - Scotch-Irish (%)
Ancestries Reported - Scottish (%)
Ancestries Reported - Slovak (%)
Ancestries Reported - Subsaharan African (%)
Ancestries Reported - Swedish (%)
Ancestries Reported - Swiss (%)
Ancestries Reported - Ukrainian (%)
Ancestries Reported - United States (%)
Ancestries Reported - Welsh (%)
Ancestries Reported - West Indian (%)
Ancestries Reported - Other (%)
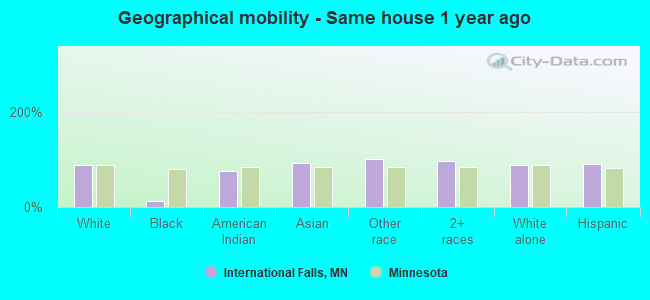
Geographical mobility - Same house 1 year ago (%)
Geographical mobility - Same house 1 year ago (%) - White
Geographical mobility - Same house 1 year ago (%) - Black or African American
Geographical mobility - Same house 1 year ago (%) - Asian
Geographical mobility - Same house 1 year ago (%) - Hispanic or Latino
Geographical mobility - Same house 1 year ago (%) - American Indian and Alaska Native
Geographical mobility - Same house 1 year ago (%) - Multirace
Geographical mobility - Same house 1 year ago (%) - Other Race
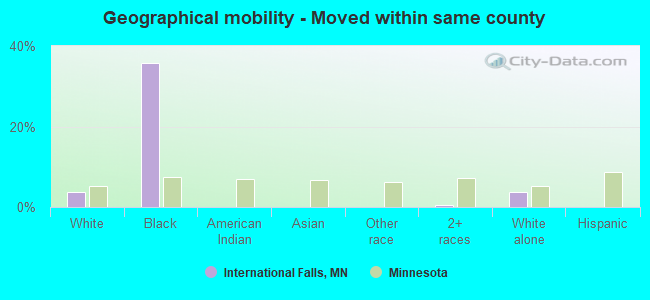
Geographical mobility - Moved within same county (%)
Geographical mobility - Moved within same county (%) - White
Geographical mobility - Moved within same county (%) - Black or African American
Geographical mobility - Moved within same county (%) - Asian
Geographical mobility - Moved within same county (%) - Hispanic or Latino
Geographical mobility - Moved within same county (%) - American Indian and Alaska Native
Geographical mobility - Moved within same county (%) - Multirace
Geographical mobility - Moved within same county (%) - Other Race
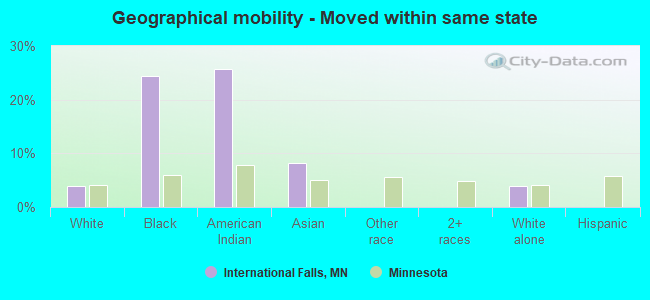
Geographical mobility - Moved from different county within same state (%)
Geographical mobility - Moved from different county within same state (%) - White
Geographical mobility - Moved from different county within same state (%) - Black or African American
Geographical mobility - Moved from different county within same state (%) - Asian
Geographical mobility - Moved from different county within same state (%) - Hispanic or Latino
Geographical mobility - Moved from different county within same state (%) - American Indian and Alaska Native
Geographical mobility - Moved from different county within same state (%) - Multirace
Geographical mobility - Moved from different county within same state (%) - Other Race
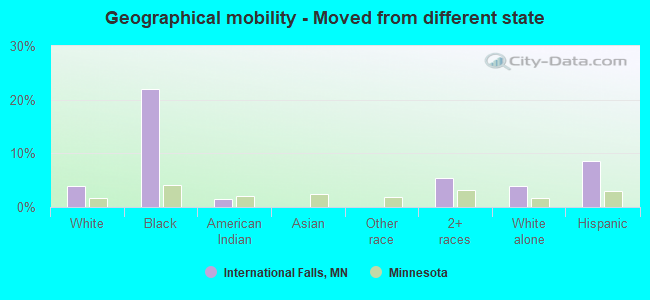
Geographical mobility - Moved from different state (%)
Geographical mobility - Moved from different state (%) - White
Geographical mobility - Moved from different state (%) - Black or African American
Geographical mobility - Moved from different state (%) - Asian
Geographical mobility - Moved from different state (%) - Hispanic or Latino
Geographical mobility - Moved from different state (%) - American Indian and Alaska Native
Geographical mobility - Moved from different state (%) - Multirace
Geographical mobility - Moved from different state (%) - Other Race
Geographical mobility - Moved from abroad (%)
Geographical mobility - Moved from abroad (%) - White
Geographical mobility - Moved from abroad (%) - Black or African American
Geographical mobility - Moved from abroad (%) - Asian
Geographical mobility - Moved from abroad (%) - Hispanic or Latino
Geographical mobility - Moved from abroad (%) - American Indian and Alaska Native
Geographical mobility - Moved from abroad (%) - Multirace
Geographical mobility - Moved from abroad (%) - Other Race
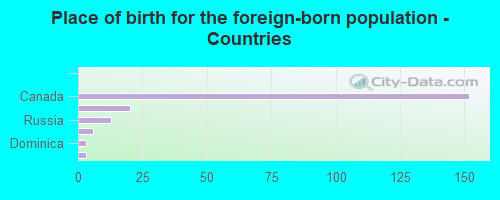
Place of birth for the foreign-born population - Ireland (%)
Place of birth for the foreign-born population - Denmark (%)
Place of birth for the foreign-born population - Norway (%)
Place of birth for the foreign-born population - Sweden (%)
Place of birth for the foreign-born population - United Kingdom (%)
Place of birth for the foreign-born population - England (%)
Place of birth for the foreign-born population - Scotland (%)
Place of birth for the foreign-born population - Other Northern Europe (%)
Place of birth for the foreign-born population - Austria (%)
Place of birth for the foreign-born population - Belgium (%)
Place of birth for the foreign-born population - France (%)
Place of birth for the foreign-born population - Germany (%)
Place of birth for the foreign-born population - Netherlands (%)
Place of birth for the foreign-born population - Switzerland (%)
Place of birth for the foreign-born population - Other Western Europe (%)
Place of birth for the foreign-born population - Greece (%)
Place of birth for the foreign-born population - Italy (%)
Place of birth for the foreign-born population - Portugal (%)
Place of birth for the foreign-born population - Spain (%)
Place of birth for the foreign-born population - Other Southern Europe (%)
Place of birth for the foreign-born population - Albania (%)
Place of birth for the foreign-born population - Belarus (%)
Place of birth for the foreign-born population - Bosnia and Herzegovina (%)
Place of birth for the foreign-born population - Bulgaria (%)
Place of birth for the foreign-born population - Croatia (%)
Place of birth for the foreign-born population - Czechoslovakia (%)
Place of birth for the foreign-born population - Hungary (%)
Place of birth for the foreign-born population - Latvia (%)
Place of birth for the foreign-born population - Lithuania (%)
Place of birth for the foreign-born population - North Macedonia (Macedonia) (%)
Place of birth for the foreign-born population - Moldova (%)
Place of birth for the foreign-born population - Poland (%)
Place of birth for the foreign-born population - Romania (%)
Place of birth for the foreign-born population - Russia (%)
Place of birth for the foreign-born population - Serbia (%)
Place of birth for the foreign-born population - Ukraine (%)
Place of birth for the foreign-born population - Other Eastern Europe (%)
Place of birth for the foreign-born population - China (%)
Place of birth for the foreign-born population - Hong Kong (%)
Place of birth for the foreign-born population - Taiwan (%)
Place of birth for the foreign-born population - Japan (%)
Place of birth for the foreign-born population - Korea (%)
Place of birth for the foreign-born population - Other Eastern Asia (%)
Place of birth for the foreign-born population - Afghanistan (%)
Place of birth for the foreign-born population - Bangladesh (%)
Place of birth for the foreign-born population - India (%)
Place of birth for the foreign-born population - Iran (%)
Place of birth for the foreign-born population - Kazakhstan (%)
Place of birth for the foreign-born population - Nepal (%)
Place of birth for the foreign-born population - Pakistan (%)
Place of birth for the foreign-born population - Sri Lanka (%)
Place of birth for the foreign-born population - Uzbekistan (%)
Place of birth for the foreign-born population - Other South Central Asia (%)
Place of birth for the foreign-born population - Burma (%)
Place of birth for the foreign-born population - Cambodia (%)
Place of birth for the foreign-born population - Indonesia (%)
Place of birth for the foreign-born population - Laos (%)
Place of birth for the foreign-born population - Malaysia (%)
Place of birth for the foreign-born population - Philippines (%)
Place of birth for the foreign-born population - Singapore (%)
Place of birth for the foreign-born population - Thailand (%)
Place of birth for the foreign-born population - Vietnam (%)
Place of birth for the foreign-born population - Other South Eastern Asia (%)
Place of birth for the foreign-born population - Armenia (%)
Place of birth for the foreign-born population - Iraq (%)
Place of birth for the foreign-born population - Israel (%)
Place of birth for the foreign-born population - Jordan (%)
Place of birth for the foreign-born population - Kuwait (%)
Place of birth for the foreign-born population - Lebanon (%)
Place of birth for the foreign-born population - Saudi Arabia (%)
Place of birth for the foreign-born population - Syria (%)
Place of birth for the foreign-born population - Turkey (%)
Place of birth for the foreign-born population - Yemen (%)
Place of birth for the foreign-born population - Other Western Asia (%)
Place of birth for the foreign-born population - Eritrea (%)
Place of birth for the foreign-born population - Ethiopia (%)
Place of birth for the foreign-born population - Kenya (%)
Place of birth for the foreign-born population - Somalia (%)
Place of birth for the foreign-born population - Uganda (%)
Place of birth for the foreign-born population - Zimbabwe (%)
Place of birth for the foreign-born population - Other Eastern Africa (%)
Place of birth for the foreign-born population - Cameroon (%)
Place of birth for the foreign-born population - Congo (%)
Place of birth for the foreign-born population - Democratic Republic of Congo (Zaire) (%)
Place of birth for the foreign-born population - Other Middle Africa (%)
Place of birth for the foreign-born population - Egypt (%)
Place of birth for the foreign-born population - Morocco (%)
Place of birth for the foreign-born population - Sudan (%)
Place of birth for the foreign-born population - Other Northern Africa (%)
Place of birth for the foreign-born population - South Africa (%)
Place of birth for the foreign-born population - Other Southern Africa (%)
Place of birth for the foreign-born population - Cabo Verde (%)
Place of birth for the foreign-born population - Ghana (%)
Place of birth for the foreign-born population - Liberia (%)
Place of birth for the foreign-born population - Nigeria (%)
Place of birth for the foreign-born population - Senegal (%)
Place of birth for the foreign-born population - Sierra Leone (%)
Place of birth for the foreign-born population - Other Western Africa (%)
Place of birth for the foreign-born population - Australia (%)
Place of birth for the foreign-born population - New Zealand (%)
Place of birth for the foreign-born population - Fiji (%)
Place of birth for the foreign-born population - Micronesia (%)
Place of birth for the foreign-born population - Bahamas (%)
Place of birth for the foreign-born population - Barbados (%)
Place of birth for the foreign-born population - Cuba (%)
Place of birth for the foreign-born population - Dominica (%)
Place of birth for the foreign-born population - Dominican Republic (%)
Place of birth for the foreign-born population - Grenada (%)
Place of birth for the foreign-born population - Haiti (%)
Place of birth for the foreign-born population - Jamaica (%)
Place of birth for the foreign-born population - St. Vincent and the Grenadines (%)
Place of birth for the foreign-born population - Trinidad and Tobago (%)
Place of birth for the foreign-born population - West Indies (%)
Place of birth for the foreign-born population - Other Caribbean (%)
Place of birth for the foreign-born population - Belize (%)
Place of birth for the foreign-born population - Costa Rica (%)
Place of birth for the foreign-born population - El Salvador (%)
Place of birth for the foreign-born population - Guatemala (%)
Place of birth for the foreign-born population - Honduras (%)
Place of birth for the foreign-born population - Mexico (%)
Place of birth for the foreign-born population - Nicaragua (%)
Place of birth for the foreign-born population - Panama (%)
Place of birth for the foreign-born population - Other Central America (%)
Place of birth for the foreign-born population - Argentina (%)
Place of birth for the foreign-born population - Bolivia (%)
Place of birth for the foreign-born population - Brazil (%)
Place of birth for the foreign-born population - Chile (%)
Place of birth for the foreign-born population - Colombia (%)
Place of birth for the foreign-born population - Ecuador (%)
Place of birth for the foreign-born population - Guyana (%)
Place of birth for the foreign-born population - Peru (%)
Place of birth for the foreign-born population - Uruguay (%)
Place of birth for the foreign-born population - Venezuela (%)
Place of birth for the foreign-born population - Other South America (%)
Place of birth for the foreign-born population - Canada (%)
Place of birth for the foreign-born population - Other Northern America (%)
Place of birth for the foreign-born population - Other (%)
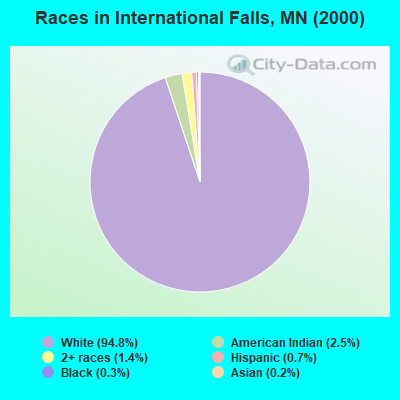
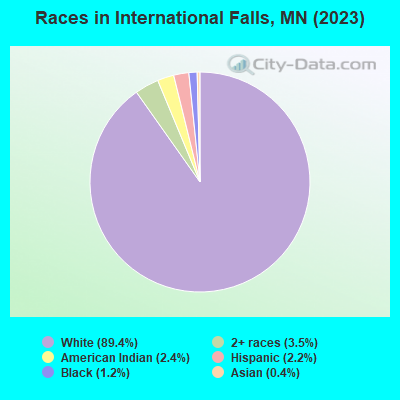
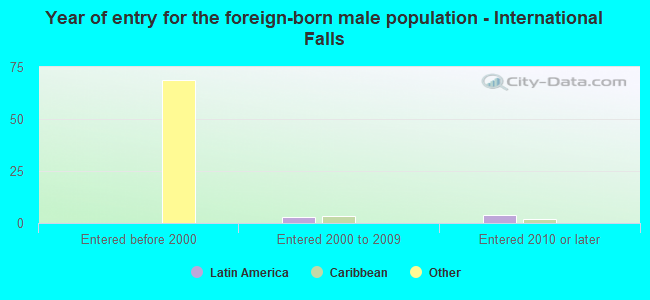
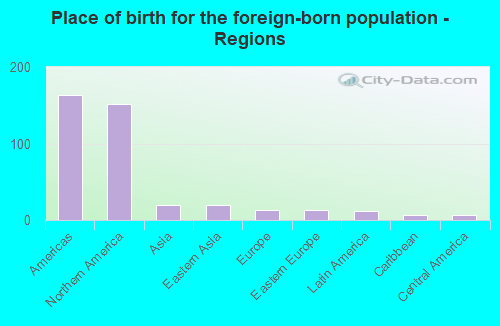
According to 2022 data, the most numerous races in International Falls, MN are White alone (5,209 residents), Black alone (92 residents), and Hispanic (92 residents). 97.8% of International Falls residents speak English at home. 3.4% of International Falls, MN residents are foreign-born (2.5% born in North America, 0.3% born in Asia), which is 135.0% less than the foreign-born rate of 8.0% across the entire state of Minnesota.
Race distribution in International Falls
2000 2022
4,337,143 88.2% White alone 168,813 3.4% Black alone 143,382 2.9% Hispanic 141,083 2.9% Asian alone 70,304 1.4% Two or more races 52,009 1.1% American Indian alone 5,031 0.1% Other race alone 1,714 0.03% Native Hawaiian and Other
4,356,347 76.2% White alone 395,179 6.9% Black alone 333,830 5.8% Hispanic 294,800 5.2% Asian alone 259,649 4.5% Two or more races 42,125 0.7% American Indian alone 32,976 0.6% Other race alone 2,278 0.04% Native Hawaiian and Other
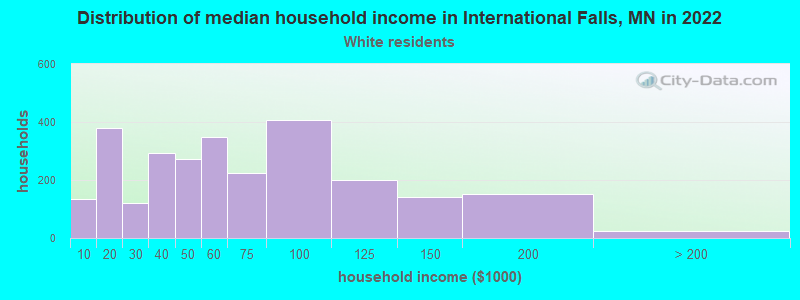
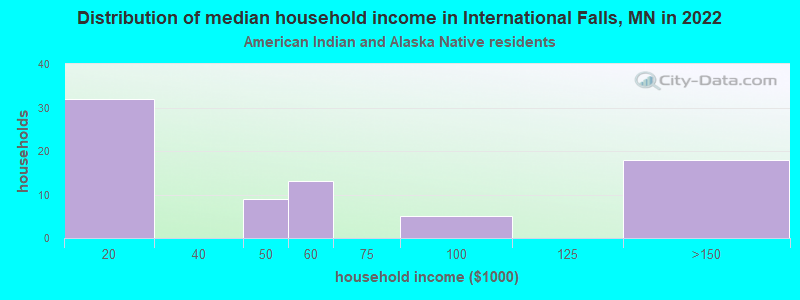
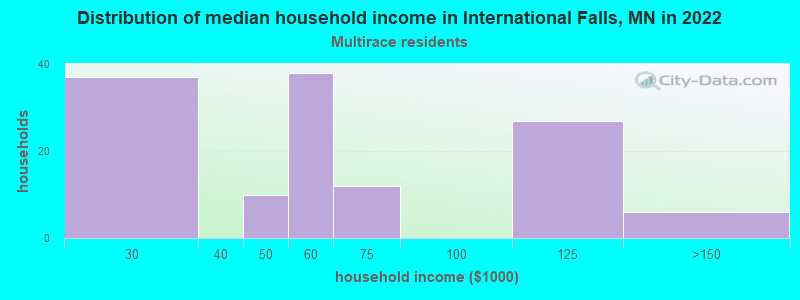
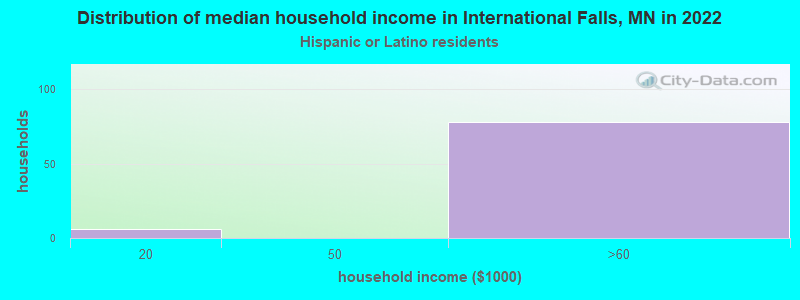
Income and house value in International Falls Median household income in 2022 $53,263 White non-Hispanic householders$58,045 American Indian and Alaska Native householders$52,045 Two or more races householders$48,558 Hispanic or Latino race householdersMedian 2022 house value $130,487 White Non-Hispanic householders$41,230 American Indian or Alaska Native householders
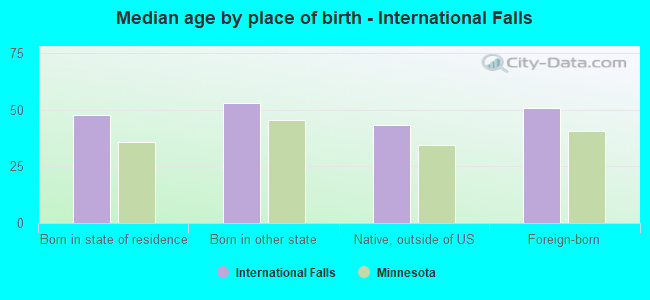
Median age by race in International Falls
49.3 Median age for White residents47.5 53.8 20.6 Median age for Black or African American residents40.9 9.9 51.0 Median age for American Indian / Alaska Native residents44.8 68.5 44.0 Median age for Asian residents31.0 -687,499,999.3 -744,336,568.8 Median age for Native Hawaiian / Pacific Islander residents-856,799,036.4 -534,959,349.1 39.8 Median age for Other race residents-664,319,248.2 -669,099,756.0 27.3 Median age for Two or more races residents26.0 34.5 49.0 Median age for White alone residents47.1 53.4 25.4 Median age for Hispanic or Latino residents24.8 -696,117,803.9
Owner/renter occupied households by race in International Falls
House owners and renters - White residents 1,890 70.7% Owner occupied784 29.3% Renter occupiedHouse owners and renters - American Indian / Alaska Native residents 43 63.3% Owner occupied25 36.7% Renter occupiedHouse owners and renters - Two or more races residents 119 85.2% Owner occupied21 14.8% Renter occupiedHouse owners and renters - White alone residents 1,870 70.4% Owner occupied787 29.6% Renter occupiedHouse owners and renters - Hispanic or Latino residents 63 91.6% Owner occupied6 8.4% Renter occupied
Language usage in International Falls
English speakers - Total 97.8% of residents of International Falls speak English at home.
0.3% of residents speak Spanish at home 10 52.6% Speak English very well9 47.4% Speak English less than very well1.7% of residents speak other language at home 95 100.0% Speak English very well
English speakers - Born in the United States 95.0% of residents of International Falls speak English at home.
0.6% of residents speak Spanish at home 4 57.1% Speak English very well3 42.9% Speak English less than very well4.2% of residents speak other language at home 46 100.0% Speak English very well
English speakers - Native, born elsewhere 95.9% of residents of International Falls speak English at home.
English speakers - Foreign-born 86.9% of residents of International Falls speak English at home.
5.6% of residents speak Spanish at home 5 45.5% Speak English very well6 54.5% Speak English less than very well6.6% of residents speak other language at home 13 100.0% Speak English very well
White (Caucasian) - Speak only English Native:
99.3% (4,852)Foreign-born:
100.0% (108)
White (Caucasian) - Speak another language Native:
1.0% (48)Foreign-born:
9.7% (11)
American Indian / Alaska Native - Speak only English Native:
80.6% (95)Foreign-born:
62.1% (4)
Asian - Speak only English Native:
54.2% (2)Foreign-born:
96.4% (20)
Other race - Speak another language Native:
93.2% (4)Foreign-born:
97.5% (11)
Two or more races - Speak only English Native:
100.0% (253)Foreign-born:
86.9% (21)
White alone - Speak only English Native:
98.9% (4,828)Foreign-born:
96.2% (129)
White alone - Speak another language Native:
1.1% (56)Foreign-born:
8.9% (12)
Hispanic or Latino - Speak another language Native:
6.0% (5)Foreign-born:
96.9% (12)
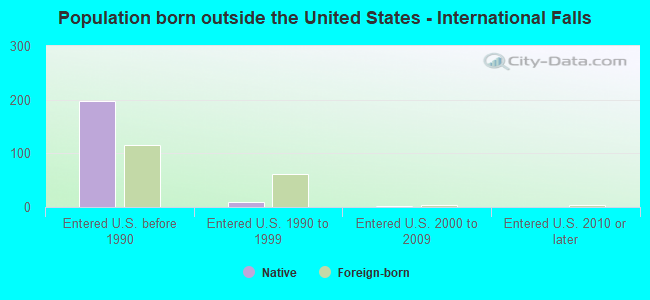
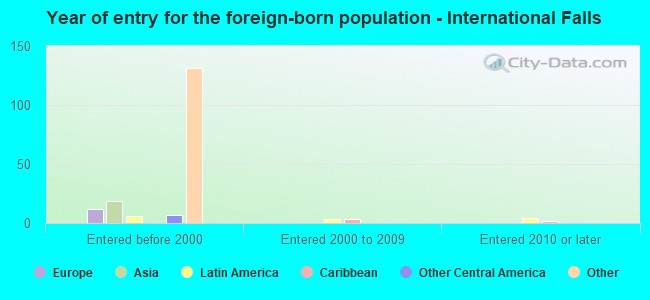
Foreign-born residents in International Falls 198 residents are foreign born (2.5% North America , 0.3% Asia ).
This city:
3.4%Minnesota:
8.5%
Marital status for residents in International Falls Marital status - White (Caucasian) population 15 years and over
Males 37.7% Never married38.8% Now married2.6% Separated6.6% Widowed14.3% DivorcedFemales 19.8% Never married40.4% Now married0.6% Separated16.6% Widowed22.6% DivorcedWomen who gave birth in the past 12 months Now married:
38.1% (8)Unmarried:
61.9% (13)
Women who did not give birth in the past 12 months Now married:
37.7% (339)Unmarried:
62.3% (561)
Marital status - Black or African American population 15 years and over
Males 43.5% Never married0.0% Now married28.3% Separated0.0% Widowed28.3% DivorcedFemales 100.0% Never married0.0% Now married0.0% Separated0.0% Widowed0.0% DivorcedWomen who did not give birth in the past 12 months Now married:
0.0% (0)Unmarried:
100.0% (17)
Marital status - American Indian / Alaska Native population 15 years and over
Males 88.2% Never married11.8% Now married0.0% Separated0.0% Widowed0.0% DivorcedFemales 36.6% Never married36.6% Now married0.0% Separated0.0% Widowed26.8% DivorcedWomen who did not give birth in the past 12 months Now married:
43.8% (15)Unmarried:
56.2% (19)
Marital status - Asian population 15 years and over
Males 100.0% Never married0.0% Now married0.0% Separated0.0% Widowed0.0% DivorcedFemales 100.0% Never married0.0% Now married0.0% Separated0.0% Widowed0.0% DivorcedWomen who did not give birth in the past 12 months Now married:
0.0% (0)Unmarried:
100.0% (21)
Marital status - Other race population 15 years and over
Males 100.0% Never married0.0% Now married0.0% Separated0.0% Widowed0.0% DivorcedFemales 33.3% Never married66.7% Now married0.0% Separated0.0% Widowed0.0% DivorcedWomen who did not give birth in the past 12 months Now married:
0.0% (0)Unmarried:
100.0% (4)
Marital status - Two or more races population 15 years and over
Males 71.4% Never married28.6% Now married0.0% Separated0.0% Widowed0.0% DivorcedFemales 70.8% Never married29.2% Now married0.0% Separated0.0% Widowed0.0% DivorcedWomen who gave birth in the past 12 months Now married:
0.0% (0)Unmarried:
100.0% (12)
Women who did not give birth in the past 12 months Now married:
42.1% (10)Unmarried:
57.9% (14)
Marital status - White alone, not Hispanic / Latino population 15 years and over
Males 37.8% Never married39.6% Now married2.7% Separated6.7% Widowed13.2% DivorcedFemales 19.8% Never married40.4% Now married0.6% Separated16.6% Widowed22.6% DivorcedWomen who gave birth in the past 12 months Now married:
38.1% (8)Unmarried:
61.9% (13)
Women who did not give birth in the past 12 months Now married:
37.7% (344)Unmarried:
62.3% (569)
Marital status - Hispanic or Latino population 15 years and over
Males 62.2% Never married0.0% Now married0.0% Separated0.0% Widowed37.8% DivorcedFemales 33.3% Never married66.7% Now married0.0% Separated0.0% Widowed0.0% DivorcedWomen who did not give birth in the past 12 months Now married:
0.0% (0)Unmarried:
100.0% (3)
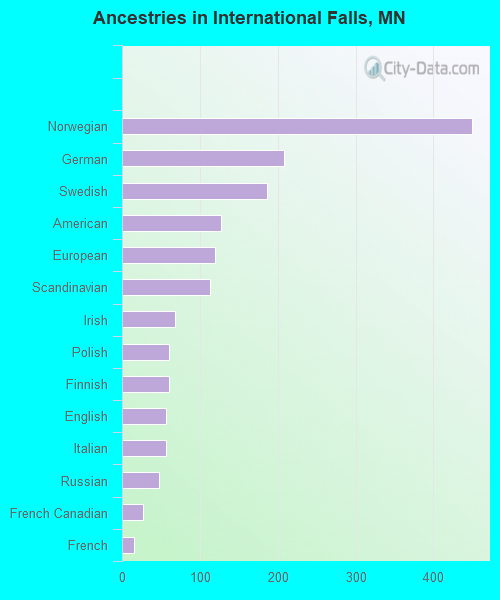
Ancestries in International Falls
449 21.3% Norwegian208 9.9% German186 8.8% Swedish127 6.0% American119 5.6% European113 5.4% Scandinavian68 3.2% Irish61 2.9% Polish60 2.8% Finnish57 2.7% English56 2.7% Italian47 2.2% Russian27 1.3% French Canadian16 0.8% French3 0.1% Canadian3 0.1% Northern European3 0.1% Ukrainian
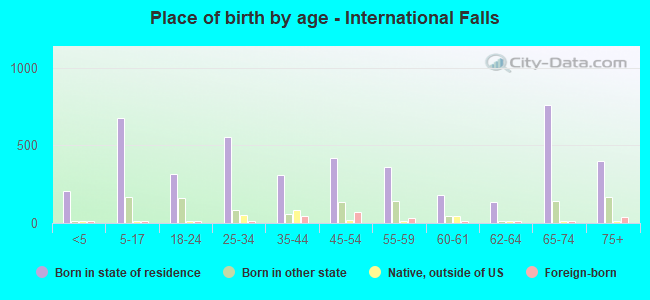
Children Nativity (place of birth) in International Falls
Children under 6 years - Living with two parents Both parents native 136 100.0% NativeChildren under 6 years - Living with one parent Native parent 135 100.0% NativeChildren 6 to 17 years - Living with two parents Both parents native 296 100.0% NativeOne native, one foreign-born parent 22 100.0% NativeChildren 6 to 17 years - Living with one parent Native parent 326 100.0% NativeForeign-born parent 40 50.4% Native40 49.6% Foreign-born
Grandparents responsible for own grandchildren in International Falls
Grandparents (30 to 59 years) White / Caucasian 23 70.5% Responsible for grandchildren9 29.5% Not responsible for grandchildrenWhite alone, not Hispanic / Latino 23 70.6% Responsible for grandchildren10 29.4% Not responsible for grandchildrenGrandparents (60 years and over) White / Caucasian 54 91.1% Responsible for grandchildren5 8.9% Not responsible for grandchildrenWhite alone, not Hispanic / Latino 56 91.2% Responsible for grandchildren5 8.8% Not responsible for grandchildren