Races in Hybla Valley, Virginia (VA) Detailed Stats
Data:
Races - White alone (%)
Races - White alone (% change since 2000)
Races - Black alone (%)
Races - Black alone (% change since 2000)
Races - American Indian alone (%)
Races - American Indian alone (% change since 2000)
Races - Asian alone (%)
Races - Asian alone (% change since 2000)
Races - Hispanic (%)
Races - Hispanic (% change since 2000)
Races - Native Hawaiian and Other Pacific Islander alone (%)
Races - Native Hawaiian and Other Pacific Islander alone (% change since 2000)
Races - Two or more races(%)
Races - Two or more races(% change since 2000)
Races - Other race alone (%)
Races - Other race alone (% change since 2000)
Racial diversity
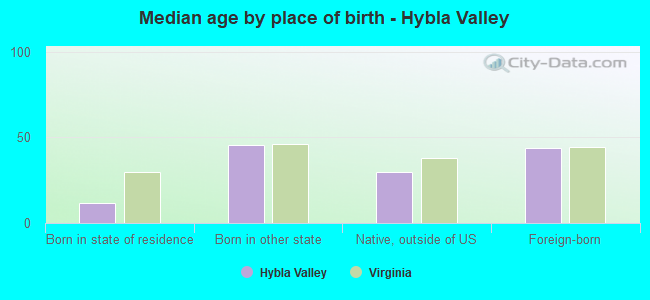
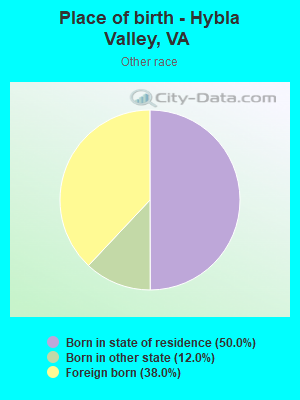
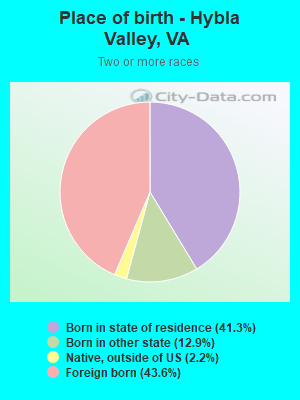
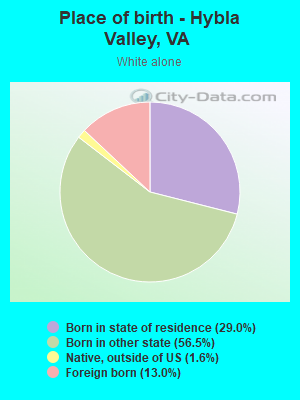
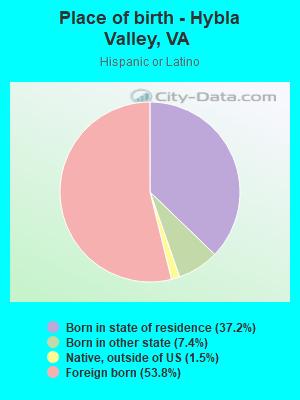
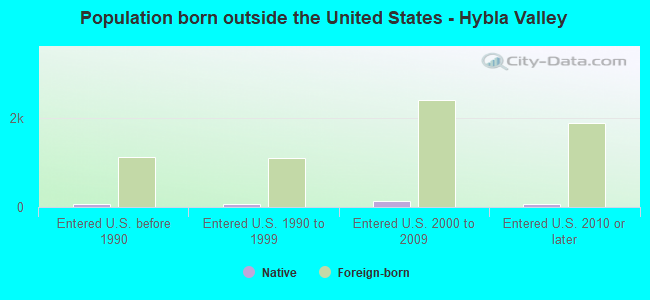
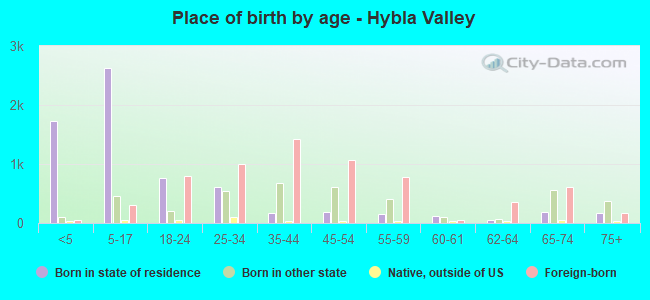
Place of birth - Born in state of residence (%)
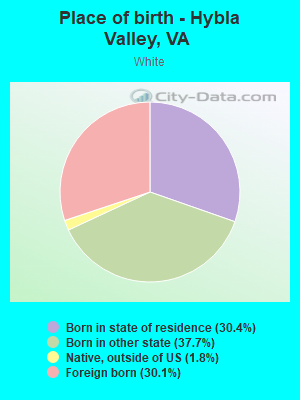
Place of birth - Born in state of residence (%) - White
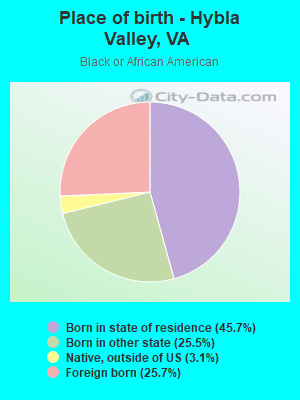
Place of birth - Born in state of residence (%) - Black or African American
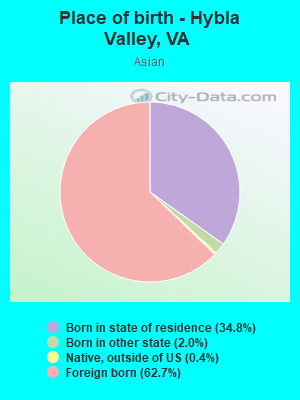
Place of birth - Born in state of residence (%) - Asian
Place of birth - Born in state of residence (%) - Hispanic or Latino
Place of birth - Born in state of residence (%) - American Indian and Alaska Native
Place of birth - Born in state of residence (%) - Multirace
Place of birth - Born in state of residence (%) - Other Race
Place of birth - Born in other state (%)
Place of birth - Born in other state (%) - White
Place of birth - Born in other state (%) - Black or African American
Place of birth - Born in other state (%) - Asian
Place of birth - Born in other state (%) - Hispanic or Latino
Place of birth - Born in other state (%) - American Indian and Alaska Native
Place of birth - Born in other state (%) - Multirace
Place of birth - Born in other state (%) - Other Race
Place of birth - Native, outside of US (%)
Place of birth - Native, outside of US (%) - White
Place of birth - Native, outside of US (%) - Black or African American
Place of birth - Native, outside of US (%) - Asian
Place of birth - Native, outside of US (%) - Hispanic or Latino
Place of birth - Native, outside of US (%) - American Indian and Alaska Native
Place of birth - Native, outside of US (%) - Multirace
Place of birth - Native, outside of US (%) - Other Race
Place of birth - Foreign born (%)
Place of birth - Foreign born (%) - White
Place of birth - Foreign born (%) - Black or African American
Place of birth - Foreign born (%) - Asian
Place of birth - Foreign born (%) - Hispanic or Latino
Place of birth - Foreign born (%) - American Indian and Alaska Native
Place of birth - Foreign born (%) - Multirace
Place of birth - Foreign born (%) - Other Race
Residents speaking English at home (%)
Residents speaking English at home - Born in the United States (%)
Residents speaking English at home - Native, born elsewhere (%)
Residents speaking English at home - Foreign born (%)
Residents speaking Spanish at home (%)
Residents speaking Spanish at home - Born in the United States (%)
Residents speaking Spanish at home - Native, born elsewhere (%)
Residents speaking Spanish at home - Foreign born (%)
Residents speaking other language at home (%)
Residents speaking other language at home - Born in the United States (%)
Residents speaking other language at home - Native, born elsewhere (%)
Residents speaking other language at home - Foreign born (%)
Marital status - Never married (%)
Marital status - Now married (%)
Marital status - Separated (%)
Marital status - Widowed (%)
Marital status - Divorced (%)
Ancestries Reported - Arab (%)
Ancestries Reported - Czech (%)
Ancestries Reported - Danish (%)
Ancestries Reported - Dutch (%)
Ancestries Reported - English (%)
Ancestries Reported - French (%)
Ancestries Reported - French Canadian (%)
Ancestries Reported - German (%)
Ancestries Reported - Greek (%)
Ancestries Reported - Hungarian (%)
Ancestries Reported - Irish (%)
Ancestries Reported - Italian (%)
Ancestries Reported - Lithuanian (%)
Ancestries Reported - Norwegian (%)
Ancestries Reported - Polish (%)
Ancestries Reported - Portuguese (%)
Ancestries Reported - Russian (%)
Ancestries Reported - Scotch-Irish (%)
Ancestries Reported - Scottish (%)
Ancestries Reported - Slovak (%)
Ancestries Reported - Subsaharan African (%)
Ancestries Reported - Swedish (%)
Ancestries Reported - Swiss (%)
Ancestries Reported - Ukrainian (%)
Ancestries Reported - United States (%)
Ancestries Reported - Welsh (%)
Ancestries Reported - West Indian (%)
Ancestries Reported - Other (%)
Geographical mobility - Same house 1 year ago (%)
Geographical mobility - Same house 1 year ago (%) - White
Geographical mobility - Same house 1 year ago (%) - Black or African American
Geographical mobility - Same house 1 year ago (%) - Asian
Geographical mobility - Same house 1 year ago (%) - Hispanic or Latino
Geographical mobility - Same house 1 year ago (%) - American Indian and Alaska Native
Geographical mobility - Same house 1 year ago (%) - Multirace
Geographical mobility - Same house 1 year ago (%) - Other Race
Geographical mobility - Moved within same county (%)
Geographical mobility - Moved within same county (%) - White
Geographical mobility - Moved within same county (%) - Black or African American
Geographical mobility - Moved within same county (%) - Asian
Geographical mobility - Moved within same county (%) - Hispanic or Latino
Geographical mobility - Moved within same county (%) - American Indian and Alaska Native
Geographical mobility - Moved within same county (%) - Multirace
Geographical mobility - Moved within same county (%) - Other Race
Geographical mobility - Moved from different county within same state (%)
Geographical mobility - Moved from different county within same state (%) - White
Geographical mobility - Moved from different county within same state (%) - Black or African American
Geographical mobility - Moved from different county within same state (%) - Asian
Geographical mobility - Moved from different county within same state (%) - Hispanic or Latino
Geographical mobility - Moved from different county within same state (%) - American Indian and Alaska Native
Geographical mobility - Moved from different county within same state (%) - Multirace
Geographical mobility - Moved from different county within same state (%) - Other Race
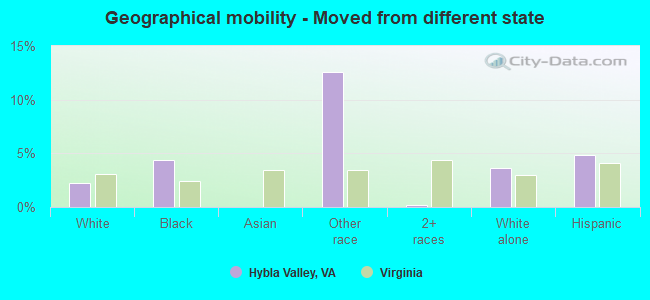
Geographical mobility - Moved from different state (%)
Geographical mobility - Moved from different state (%) - White
Geographical mobility - Moved from different state (%) - Black or African American
Geographical mobility - Moved from different state (%) - Asian
Geographical mobility - Moved from different state (%) - Hispanic or Latino
Geographical mobility - Moved from different state (%) - American Indian and Alaska Native
Geographical mobility - Moved from different state (%) - Multirace
Geographical mobility - Moved from different state (%) - Other Race
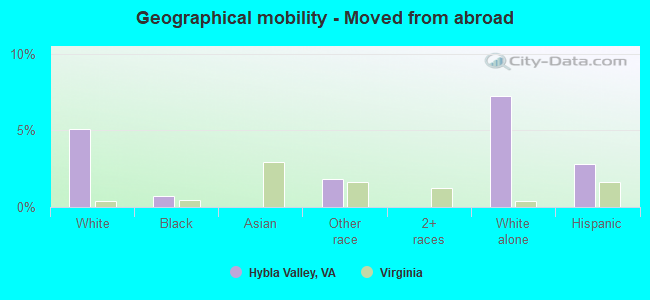
Geographical mobility - Moved from abroad (%)
Geographical mobility - Moved from abroad (%) - White
Geographical mobility - Moved from abroad (%) - Black or African American
Geographical mobility - Moved from abroad (%) - Asian
Geographical mobility - Moved from abroad (%) - Hispanic or Latino
Geographical mobility - Moved from abroad (%) - American Indian and Alaska Native
Geographical mobility - Moved from abroad (%) - Multirace
Geographical mobility - Moved from abroad (%) - Other Race
Place of birth for the foreign-born population - Ireland (%)
Place of birth for the foreign-born population - Denmark (%)
Place of birth for the foreign-born population - Norway (%)
Place of birth for the foreign-born population - Sweden (%)
Place of birth for the foreign-born population - United Kingdom (%)
Place of birth for the foreign-born population - England (%)
Place of birth for the foreign-born population - Scotland (%)
Place of birth for the foreign-born population - Other Northern Europe (%)
Place of birth for the foreign-born population - Austria (%)
Place of birth for the foreign-born population - Belgium (%)
Place of birth for the foreign-born population - France (%)
Place of birth for the foreign-born population - Germany (%)
Place of birth for the foreign-born population - Netherlands (%)
Place of birth for the foreign-born population - Switzerland (%)
Place of birth for the foreign-born population - Other Western Europe (%)
Place of birth for the foreign-born population - Greece (%)
Place of birth for the foreign-born population - Italy (%)
Place of birth for the foreign-born population - Portugal (%)
Place of birth for the foreign-born population - Spain (%)
Place of birth for the foreign-born population - Other Southern Europe (%)
Place of birth for the foreign-born population - Albania (%)
Place of birth for the foreign-born population - Belarus (%)
Place of birth for the foreign-born population - Bosnia and Herzegovina (%)
Place of birth for the foreign-born population - Bulgaria (%)
Place of birth for the foreign-born population - Croatia (%)
Place of birth for the foreign-born population - Czechoslovakia (%)
Place of birth for the foreign-born population - Hungary (%)
Place of birth for the foreign-born population - Latvia (%)
Place of birth for the foreign-born population - Lithuania (%)
Place of birth for the foreign-born population - North Macedonia (Macedonia) (%)
Place of birth for the foreign-born population - Moldova (%)
Place of birth for the foreign-born population - Poland (%)
Place of birth for the foreign-born population - Romania (%)
Place of birth for the foreign-born population - Russia (%)
Place of birth for the foreign-born population - Serbia (%)
Place of birth for the foreign-born population - Ukraine (%)
Place of birth for the foreign-born population - Other Eastern Europe (%)
Place of birth for the foreign-born population - China (%)
Place of birth for the foreign-born population - Hong Kong (%)
Place of birth for the foreign-born population - Taiwan (%)
Place of birth for the foreign-born population - Japan (%)
Place of birth for the foreign-born population - Korea (%)
Place of birth for the foreign-born population - Other Eastern Asia (%)
Place of birth for the foreign-born population - Afghanistan (%)
Place of birth for the foreign-born population - Bangladesh (%)
Place of birth for the foreign-born population - India (%)
Place of birth for the foreign-born population - Iran (%)
Place of birth for the foreign-born population - Kazakhstan (%)
Place of birth for the foreign-born population - Nepal (%)
Place of birth for the foreign-born population - Pakistan (%)
Place of birth for the foreign-born population - Sri Lanka (%)
Place of birth for the foreign-born population - Uzbekistan (%)
Place of birth for the foreign-born population - Other South Central Asia (%)
Place of birth for the foreign-born population - Burma (%)
Place of birth for the foreign-born population - Cambodia (%)
Place of birth for the foreign-born population - Indonesia (%)
Place of birth for the foreign-born population - Laos (%)
Place of birth for the foreign-born population - Malaysia (%)
Place of birth for the foreign-born population - Philippines (%)
Place of birth for the foreign-born population - Singapore (%)
Place of birth for the foreign-born population - Thailand (%)
Place of birth for the foreign-born population - Vietnam (%)
Place of birth for the foreign-born population - Other South Eastern Asia (%)
Place of birth for the foreign-born population - Armenia (%)
Place of birth for the foreign-born population - Iraq (%)
Place of birth for the foreign-born population - Israel (%)
Place of birth for the foreign-born population - Jordan (%)
Place of birth for the foreign-born population - Kuwait (%)
Place of birth for the foreign-born population - Lebanon (%)
Place of birth for the foreign-born population - Saudi Arabia (%)
Place of birth for the foreign-born population - Syria (%)
Place of birth for the foreign-born population - Turkey (%)
Place of birth for the foreign-born population - Yemen (%)
Place of birth for the foreign-born population - Other Western Asia (%)
Place of birth for the foreign-born population - Eritrea (%)
Place of birth for the foreign-born population - Ethiopia (%)
Place of birth for the foreign-born population - Kenya (%)
Place of birth for the foreign-born population - Somalia (%)
Place of birth for the foreign-born population - Uganda (%)
Place of birth for the foreign-born population - Zimbabwe (%)
Place of birth for the foreign-born population - Other Eastern Africa (%)
Place of birth for the foreign-born population - Cameroon (%)
Place of birth for the foreign-born population - Congo (%)
Place of birth for the foreign-born population - Democratic Republic of Congo (Zaire) (%)
Place of birth for the foreign-born population - Other Middle Africa (%)
Place of birth for the foreign-born population - Egypt (%)
Place of birth for the foreign-born population - Morocco (%)
Place of birth for the foreign-born population - Sudan (%)
Place of birth for the foreign-born population - Other Northern Africa (%)
Place of birth for the foreign-born population - South Africa (%)
Place of birth for the foreign-born population - Other Southern Africa (%)
Place of birth for the foreign-born population - Cabo Verde (%)
Place of birth for the foreign-born population - Ghana (%)
Place of birth for the foreign-born population - Liberia (%)
Place of birth for the foreign-born population - Nigeria (%)
Place of birth for the foreign-born population - Senegal (%)
Place of birth for the foreign-born population - Sierra Leone (%)
Place of birth for the foreign-born population - Other Western Africa (%)
Place of birth for the foreign-born population - Australia (%)
Place of birth for the foreign-born population - New Zealand (%)
Place of birth for the foreign-born population - Fiji (%)
Place of birth for the foreign-born population - Micronesia (%)
Place of birth for the foreign-born population - Bahamas (%)
Place of birth for the foreign-born population - Barbados (%)
Place of birth for the foreign-born population - Cuba (%)
Place of birth for the foreign-born population - Dominica (%)
Place of birth for the foreign-born population - Dominican Republic (%)
Place of birth for the foreign-born population - Grenada (%)
Place of birth for the foreign-born population - Haiti (%)
Place of birth for the foreign-born population - Jamaica (%)
Place of birth for the foreign-born population - St. Vincent and the Grenadines (%)
Place of birth for the foreign-born population - Trinidad and Tobago (%)
Place of birth for the foreign-born population - West Indies (%)
Place of birth for the foreign-born population - Other Caribbean (%)
Place of birth for the foreign-born population - Belize (%)
Place of birth for the foreign-born population - Costa Rica (%)
Place of birth for the foreign-born population - El Salvador (%)
Place of birth for the foreign-born population - Guatemala (%)
Place of birth for the foreign-born population - Honduras (%)
Place of birth for the foreign-born population - Mexico (%)
Place of birth for the foreign-born population - Nicaragua (%)
Place of birth for the foreign-born population - Panama (%)
Place of birth for the foreign-born population - Other Central America (%)
Place of birth for the foreign-born population - Argentina (%)
Place of birth for the foreign-born population - Bolivia (%)
Place of birth for the foreign-born population - Brazil (%)
Place of birth for the foreign-born population - Chile (%)
Place of birth for the foreign-born population - Colombia (%)
Place of birth for the foreign-born population - Ecuador (%)
Place of birth for the foreign-born population - Guyana (%)
Place of birth for the foreign-born population - Peru (%)
Place of birth for the foreign-born population - Uruguay (%)
Place of birth for the foreign-born population - Venezuela (%)
Place of birth for the foreign-born population - Other South America (%)
Place of birth for the foreign-born population - Canada (%)
Place of birth for the foreign-born population - Other Northern America (%)
Place of birth for the foreign-born population - Other (%)
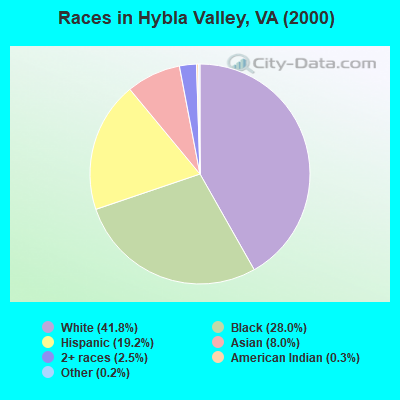
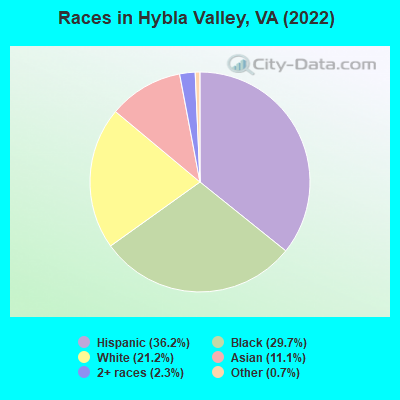
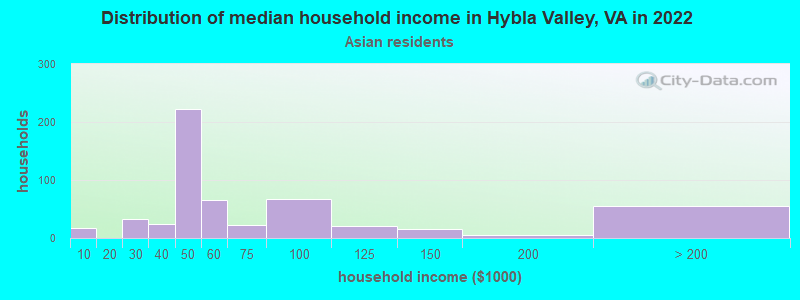
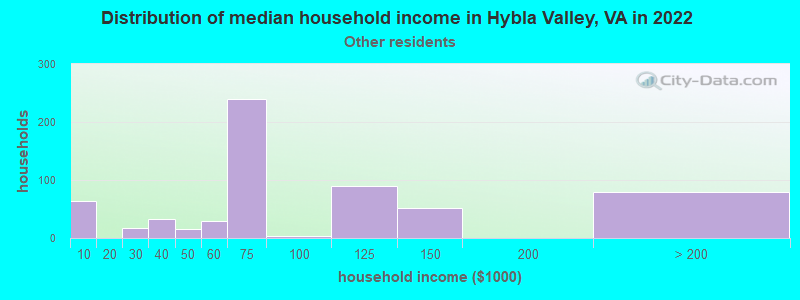
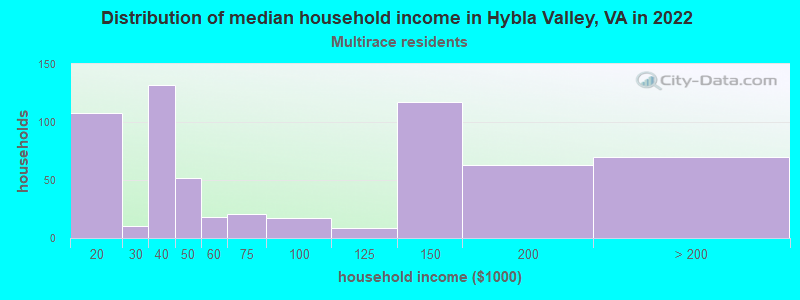
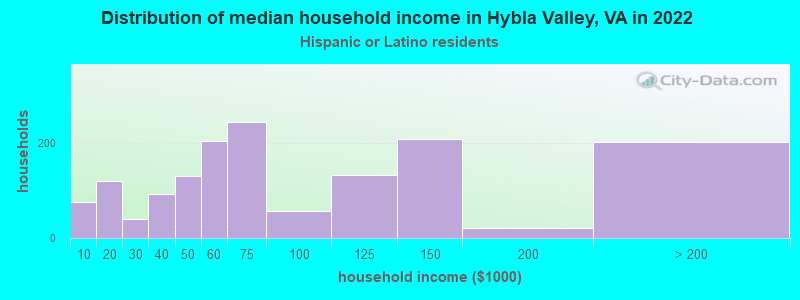
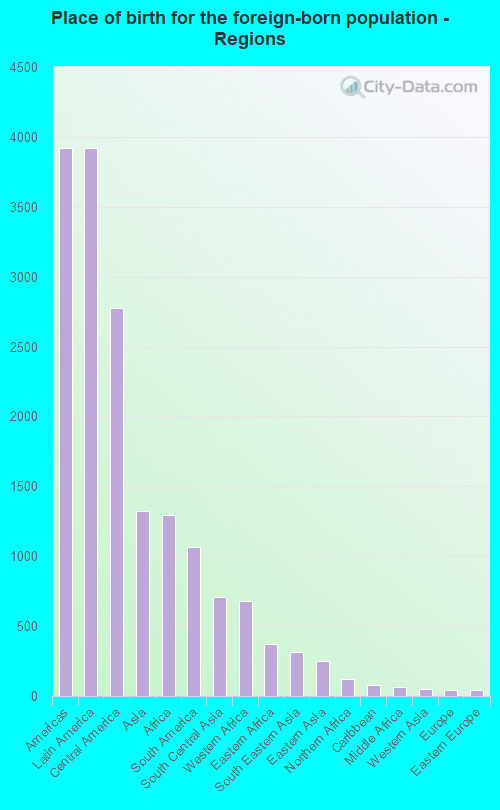
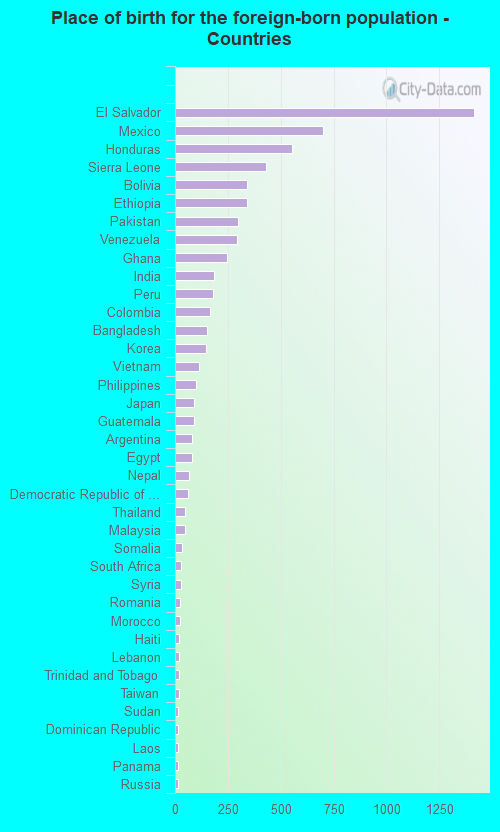
According to 2022 data, the most numerous races in Hybla Valley, VA are White alone (3,815 residents), Black alone (5,338 residents), and Hispanic (6,515 residents). 47.6% of Hybla Valley residents speak English at home. 36.6% of Hybla Valley, VA residents are foreign-born (21.8% born in Latin America, 7.4% born in Asia, 7.2% born in Africa), which is 67.3% greater than the foreign-born rate of 12.0% across the entire state of Virginia.
Race distribution in Hybla Valley
2000 2022
4,965,637 70.2% White alone 1,376,378 19.4% Black alone 329,540 4.7% Hispanic 259,277 3.7% Asian alone 114,022 1.6% Two or more races 18,596 0.3% American Indian alone 11,685 0.2% Other race alone 3,380 0.05% Native Hawaiian and Other
5,095,130 58.7% White alone 1,594,785 18.4% Black alone 905,750 10.4% Hispanic 602,881 6.9% Asian alone 406,047 4.7% Two or more races 60,419 0.7% Other race alone 11,738 0.1% American Indian alone 6,869 0.08% Native Hawaiian and Other
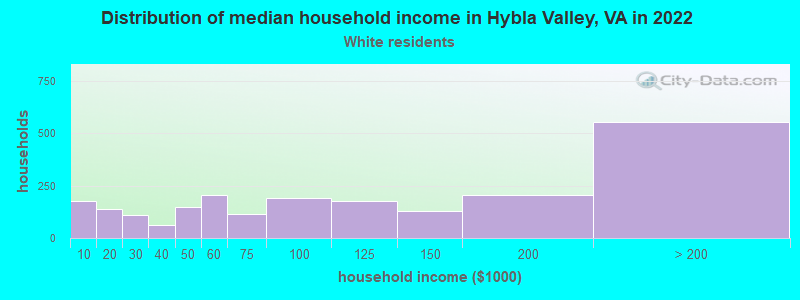
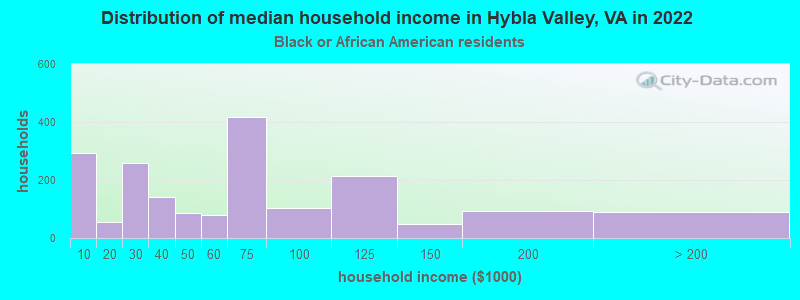
Income and house value in Hybla Valley Median household income in 2022 $141,130 White non-Hispanic householders$56,717 Black householders$43,138 Asian householders$65,372 Some other race householders$63,267 Hispanic or Latino race householdersMedian 2022 house value $774,161 White Non-Hispanic householders$392,351 Black or African American householders $543,081 Asian householders$641,097 Native Hawaiian and other Pacific Islander householders$454,182 Some other race householders$470,708 Two or more races householders$475,837 Hispanic or Latino householders
Median age by race in Hybla Valley
37.3 Median age for White residents39.3 35.6 30.3 Median age for Black or African American residents25.7 32.8 -754,182,753.4 Median age for American Indian / Alaska Native residents-964,539,006.1 -669,005,847.3 38.0 Median age for Asian residents27.2 55.4 -666,666,666.0 Median age for Native Hawaiian / Pacific Islander residents-558,791,801.0 -584,518,166.9 16.8 Median age for Other race residents19.1 3.0 38.0 Median age for Two or more races residents38.5 45.5 47.0 Median age for White alone residents40.5 51.8 25.0 Median age for Hispanic or Latino residents30.6 23.2
Owner/renter occupied households by race in Hybla Valley
House owners and renters - White residents 1,313 60.3% Owner occupied863 39.7% Renter occupiedHouse owners and renters - Black or African American residents 423 21.0% Owner occupied1,591 79.0% Renter occupiedHouse owners and renters - Asian residents 261 48.2% Owner occupied280 51.8% Renter occupiedHouse owners and renters - Other race residents 207 37.1% Owner occupied351 62.9% Renter occupiedHouse owners and renters - Two or more races residents 264 41.6% Owner occupied371 58.4% Renter occupiedHouse owners and renters - White alone residents 1,063 72.0% Owner occupied413 28.0% Renter occupiedHouse owners and renters - Hispanic or Latino residents 596 37.3% Owner occupied1,001 62.7% Renter occupied
Language usage in Hybla Valley
English speakers - Total 47.6% of residents of Hybla Valley speak English at home.
33.4% of residents speak Spanish at home 2,614 48.8% Speak English very well2,738 51.2% Speak English less than very well18.2% of residents speak other language at home 1,812 61.9% Speak English very well1,113 38.1% Speak English less than very well
English speakers - Born in the United States 87.7% of residents of Hybla Valley speak English at home.
7.8% of residents speak Spanish at home 313 100.0% Speak English very well4.0% of residents speak other language at home 156 95.7% Speak English very well7 4.3% Speak English less than very well
English speakers - Native, born elsewhere 35.1% of residents of Hybla Valley speak English at home.
20.5% of residents speak Spanish at home 69 100.0% Speak English less than very well47.3% of residents speak other language at home 159 100.0% Speak English very well
English speakers - Foreign-born 8.5% of residents of Hybla Valley speak English at home.
55.1% of residents speak Spanish at home 1,288 35.7% Speak English very well2,323 64.3% Speak English less than very well35.6% of residents speak other language at home 1,358 58.2% Speak English very well976 41.8% Speak English less than very well
White (Caucasian) - Speak only English Native:
72.4% (2,930)Foreign-born:
3.7% (66)
White (Caucasian) - Speak another language Native:
21.6% (874)Foreign-born:
88.4% (1,592)
Black or African American - Speak only English Native:
87.1% (2,847)Foreign-born:
17.3% (232)
Black or African American - Speak another language Native:
13.2% (432)Foreign-born:
81.1% (1,086)
Asian - Speak only English Native:
89.1% (586)Foreign-born:
8.7% (109)
Asian - Speak another language Native:
7.4% (49)Foreign-born:
90.6% (1,131)
Other race - Speak only English Native:
20.0% (137)Foreign-born:
3.4% (32)
Other race - Speak another language Native:
72.9% (497)Foreign-born:
95.6% (902)
Two or more races - Speak only English Native:
55.5% (525)Foreign-born:
20.8% (184)
Two or more races - Speak another language Native:
45.8% (433)Foreign-born:
79.0% (700)
White alone - Speak only English Native:
89.8% (2,882)Foreign-born:
10.6% (47)
White alone - Speak another language Native:
9.7% (310)Foreign-born:
86.8% (385)
Hispanic or Latino - Speak only English Native:
17.6% (352)Foreign-born:
3.5% (120)
Hispanic or Latino - Speak another language Native:
77.2% (1,548)Foreign-born:
96.5% (3,342)
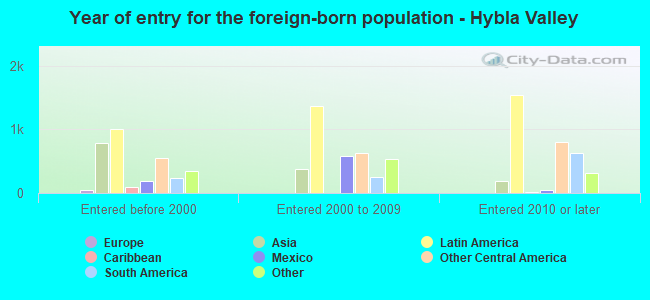
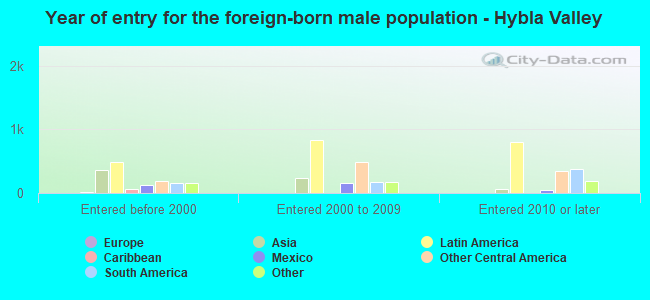
Foreign-born residents in Hybla Valley 6,593 residents are foreign born (21.8% Latin America , 7.4% Asia , 7.2% Africa ).
This city:
36.6%Virginia:
12.6%
Marital status for residents in Hybla Valley Marital status - White (Caucasian) population 15 years and over
Males 22.5% Never married73.1% Now married1.2% Separated0.7% Widowed2.5% DivorcedFemales 30.4% Never married54.5% Now married0.8% Separated5.7% Widowed8.7% DivorcedWomen who gave birth in the past 12 months Now married:
100.0% (67)Unmarried:
0.0% (0)
Women who did not give birth in the past 12 months Now married:
58.0% (903)Unmarried:
42.0% (654)
Marital status - Black or African American population 15 years and over
Males 42.1% Never married49.4% Now married1.6% Separated0.1% Widowed6.8% DivorcedFemales 58.6% Never married21.2% Now married3.5% Separated6.3% Widowed10.3% DivorcedWomen who gave birth in the past 12 months Now married:
14.2% (17)Unmarried:
85.8% (102)
Women who did not give birth in the past 12 months Now married:
15.6% (242)Unmarried:
84.4% (1,309)
Marital status - Asian population 15 years and over
Males 51.6% Never married42.3% Now married0.0% Separated6.1% Widowed0.0% DivorcedFemales 9.2% Never married76.8% Now married7.2% Separated6.8% Widowed0.0% DivorcedWomen who gave birth in the past 12 months Now married:
100.0% (34)Unmarried:
0.0% (0)
Women who did not give birth in the past 12 months Now married:
78.2% (190)Unmarried:
21.8% (53)
Marital status - Other race population 15 years and over
Males 38.4% Never married33.4% Now married28.2% Separated0.0% Widowed0.0% DivorcedFemales 14.8% Never married55.3% Now married0.0% Separated24.8% Widowed5.2% DivorcedWomen who gave birth in the past 12 months Now married:
100.0% (36)Unmarried:
0.0% (0)
Women who did not give birth in the past 12 months Now married:
65.2% (184)Unmarried:
34.8% (98)
Marital status - Two or more races population 15 years and over
Males 47.1% Never married37.8% Now married6.1% Separated0.0% Widowed8.9% DivorcedFemales 37.0% Never married43.1% Now married0.0% Separated0.0% Widowed19.9% DivorcedWomen who did not give birth in the past 12 months Now married:
42.9% (223)Unmarried:
57.1% (297)
Marital status - White alone, not Hispanic / Latino population 15 years and over
Males 24.2% Never married68.1% Now married2.1% Separated1.2% Widowed4.4% DivorcedFemales 23.1% Never married53.4% Now married0.0% Separated8.8% Widowed14.8% DivorcedWomen who gave birth in the past 12 months Now married:
100.0% (52)Unmarried:
0.0% (0)
Women who did not give birth in the past 12 months Now married:
63.9% (471)Unmarried:
36.1% (266)
Marital status - Hispanic or Latino population 15 years and over
Males 29.5% Never married58.4% Now married10.0% Separated0.0% Widowed2.1% DivorcedFemales 33.5% Never married53.6% Now married1.2% Separated5.5% Widowed6.2% DivorcedWomen who gave birth in the past 12 months Now married:
100.0% (50)Unmarried:
0.0% (0)
Women who did not give birth in the past 12 months Now married:
53.4% (784)Unmarried:
46.6% (684)
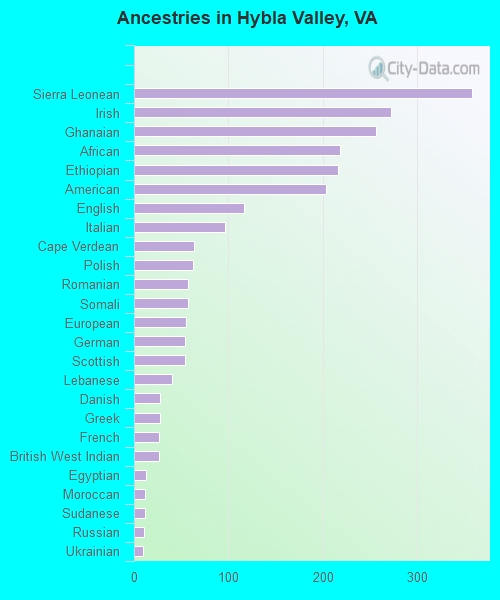
Ancestries in Hybla Valley
358 3.4% Sierra Leonean272 2.6% Irish256 2.4% Ghanaian218 2.1% African216 2.1% Ethiopian203 1.9% American116 1.1% English96 0.9% Italian64 0.6% Cape Verdean62 0.6% Polish57 0.5% Romanian57 0.5% Somali55 0.5% European54 0.5% German54 0.5% Scottish40 0.4% Lebanese28 0.3% Danish28 0.3% Greek27 0.3% French27 0.3% British West Indian13 0.1% Egyptian12 0.1% Moroccan12 0.1% Sudanese11 0.1% Russian10 0.10% Ukrainian9 0.09% Haitian2 0.02% Welsh
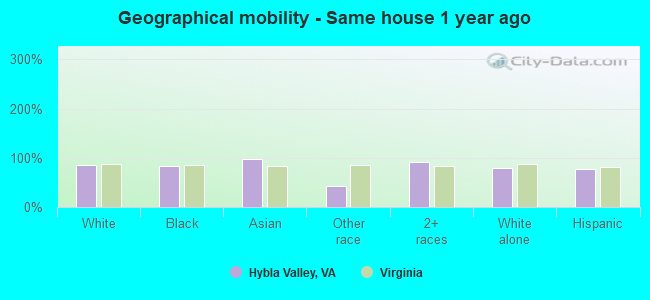
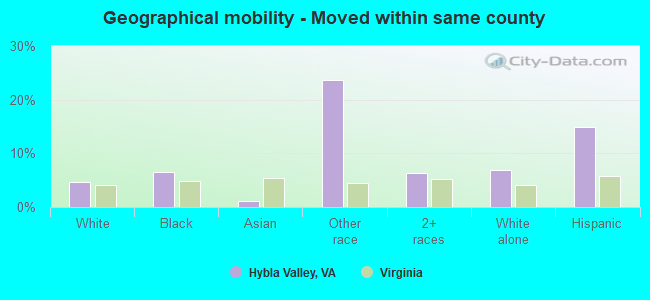
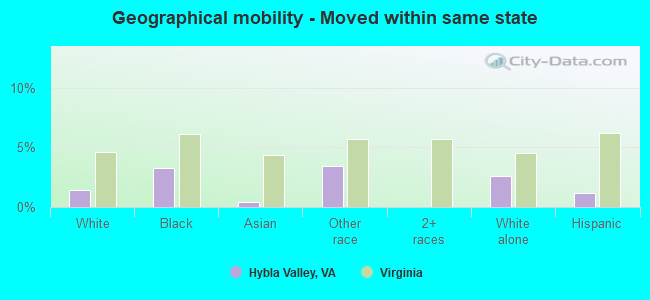
Geographical mobility in Hybla Valley Same house 1 year ago 5,617 85.8% White (Caucasian)4,311 83.0% Black or African American1,950 97.5% Asian900 42.3% Other race1,814 90.5% Two or more races2,980 79.1% White alone, not Hispanic / Latino4,798 77.1% Hispanic or LatinoMoved within same county 299 4.6% White / Caucasian343 6.6% Black or African American21 1.1% Asian502 23.6% Other race128 6.4% Two or more races259 6.9% White alone, not Hispanic / Latino927 14.9% Hispanic or LatinoMoved within same state 92 1.4% White / Caucasian170 3.3% Black or African American9 0.5% Asian73 3.4% Other race97 2.6% White alone, not Hispanic / Latino74 1.2% Hispanic or LatinoMoved from different state 147 2.2% White / Caucasian227 4.4% Black or African American267 12.6% Other race4 0.2% Two or more races135 3.6% White alone, not Hispanic / Latino304 4.9% Hispanic or LatinoMoved from abroad 335 5.1% White37 0.7% Black or African American39 1.8% Other race272 7.2% White alone, not Hispanic / Latino176 2.8% Hispanic or Latino
Children Nativity (place of birth) in Hybla Valley
Children under 6 years - Living with two parents Both parents native 36 90.5% Native4 9.5% Foreign-bornBoth parents foreign-born 293 100.0% NativeOne native, one foreign-born parent 659 94.4% Native39 5.6% Foreign-bornChildren under 6 years - Living with one parent Native parent 346 100.0% NativeForeign-born parent 512 96.8% Native17 3.2% Foreign-bornChildren 6 to 17 years - Living with two parents Both parents native 406 99.6% Native2 0.4% Foreign-bornBoth parents foreign-born 685 78.6% Native186 21.4% Foreign-bornOne native, one foreign-born parent 85 90.9% Native9 9.1% Foreign-bornChildren 6 to 17 years - Living with one parent Native parent 140 100.0% NativeForeign-born parent 1,547 52.8% Native1,381 47.2% Foreign-born
Grandparents responsible for own grandchildren in Hybla Valley
Grandparents (30 to 59 years) White / Caucasian 38 100.0% Not responsible for grandchildrenAsian 20 100.0% Not responsible for grandchildrenOther race 183 100.0% Not responsible for grandchildrenWhite alone, not Hispanic / Latino 20 100.0% Not responsible for grandchildrenHispanic or Latino 157 100.0% Not responsible for grandchildrenGrandparents (60 years and over) White / Caucasian 14 100.0% Responsible for grandchildrenAsian 10 14.7% Responsible for grandchildren60 85.3% Not responsible for grandchildrenHispanic or Latino 21 100.0% Responsible for grandchildren