Races in Huntington, New York (NY) Detailed Stats
Data:
Races - White alone (%)
Races - White alone (% change since 2000)
Races - Black alone (%)
Races - Black alone (% change since 2000)
Races - American Indian alone (%)
Races - American Indian alone (% change since 2000)
Races - Asian alone (%)
Races - Asian alone (% change since 2000)
Races - Hispanic (%)
Races - Hispanic (% change since 2000)
Races - Native Hawaiian and Other Pacific Islander alone (%)
Races - Native Hawaiian and Other Pacific Islander alone (% change since 2000)
Races - Two or more races(%)
Races - Two or more races(% change since 2000)
Races - Other race alone (%)
Races - Other race alone (% change since 2000)
Racial diversity
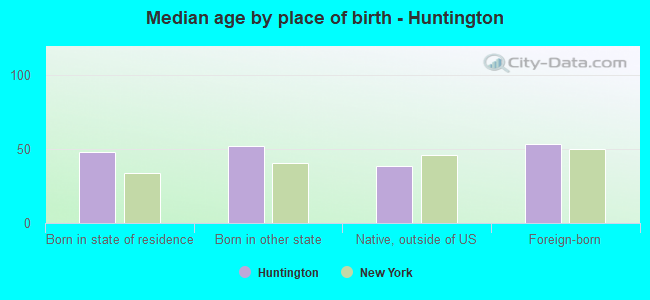
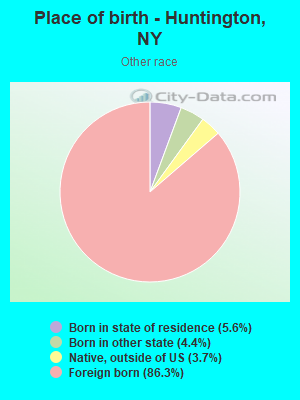
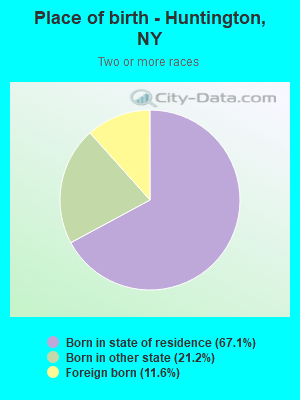
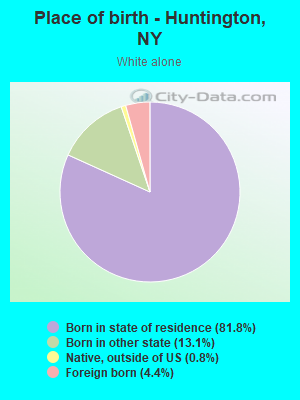
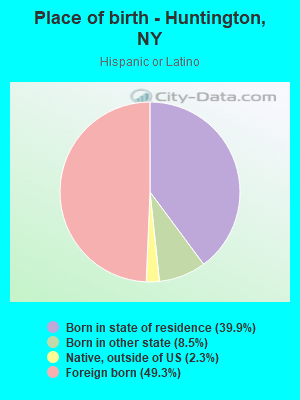
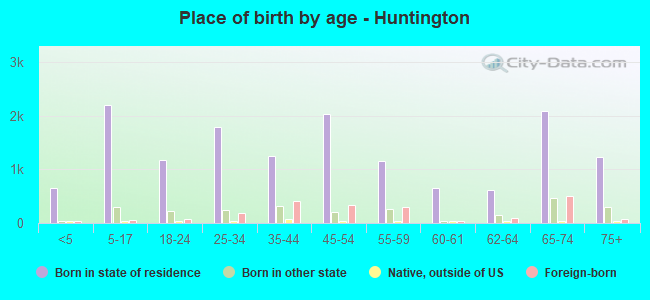
Place of birth - Born in state of residence (%)
Place of birth - Born in state of residence (%) - White
Place of birth - Born in state of residence (%) - Black or African American
Place of birth - Born in state of residence (%) - Asian
Place of birth - Born in state of residence (%) - Hispanic or Latino
Place of birth - Born in state of residence (%) - American Indian and Alaska Native
Place of birth - Born in state of residence (%) - Multirace
Place of birth - Born in state of residence (%) - Other Race
Place of birth - Born in other state (%)
Place of birth - Born in other state (%) - White
Place of birth - Born in other state (%) - Black or African American
Place of birth - Born in other state (%) - Asian
Place of birth - Born in other state (%) - Hispanic or Latino
Place of birth - Born in other state (%) - American Indian and Alaska Native
Place of birth - Born in other state (%) - Multirace
Place of birth - Born in other state (%) - Other Race
Place of birth - Native, outside of US (%)
Place of birth - Native, outside of US (%) - White
Place of birth - Native, outside of US (%) - Black or African American
Place of birth - Native, outside of US (%) - Asian
Place of birth - Native, outside of US (%) - Hispanic or Latino
Place of birth - Native, outside of US (%) - American Indian and Alaska Native
Place of birth - Native, outside of US (%) - Multirace
Place of birth - Native, outside of US (%) - Other Race
Place of birth - Foreign born (%)
Place of birth - Foreign born (%) - White
Place of birth - Foreign born (%) - Black or African American
Place of birth - Foreign born (%) - Asian
Place of birth - Foreign born (%) - Hispanic or Latino
Place of birth - Foreign born (%) - American Indian and Alaska Native
Place of birth - Foreign born (%) - Multirace
Place of birth - Foreign born (%) - Other Race
Residents speaking English at home (%)
Residents speaking English at home - Born in the United States (%)
Residents speaking English at home - Native, born elsewhere (%)
Residents speaking English at home - Foreign born (%)
Residents speaking Spanish at home (%)
Residents speaking Spanish at home - Born in the United States (%)
Residents speaking Spanish at home - Native, born elsewhere (%)
Residents speaking Spanish at home - Foreign born (%)
Residents speaking other language at home (%)
Residents speaking other language at home - Born in the United States (%)
Residents speaking other language at home - Native, born elsewhere (%)
Residents speaking other language at home - Foreign born (%)
Marital status - Never married (%)
Marital status - Now married (%)
Marital status - Separated (%)
Marital status - Widowed (%)
Marital status - Divorced (%)
Ancestries Reported - Arab (%)
Ancestries Reported - Czech (%)
Ancestries Reported - Danish (%)
Ancestries Reported - Dutch (%)
Ancestries Reported - English (%)
Ancestries Reported - French (%)
Ancestries Reported - French Canadian (%)
Ancestries Reported - German (%)
Ancestries Reported - Greek (%)
Ancestries Reported - Hungarian (%)
Ancestries Reported - Irish (%)
Ancestries Reported - Italian (%)
Ancestries Reported - Lithuanian (%)
Ancestries Reported - Norwegian (%)
Ancestries Reported - Polish (%)
Ancestries Reported - Portuguese (%)
Ancestries Reported - Russian (%)
Ancestries Reported - Scotch-Irish (%)
Ancestries Reported - Scottish (%)
Ancestries Reported - Slovak (%)
Ancestries Reported - Subsaharan African (%)
Ancestries Reported - Swedish (%)
Ancestries Reported - Swiss (%)
Ancestries Reported - Ukrainian (%)
Ancestries Reported - United States (%)
Ancestries Reported - Welsh (%)
Ancestries Reported - West Indian (%)
Ancestries Reported - Other (%)
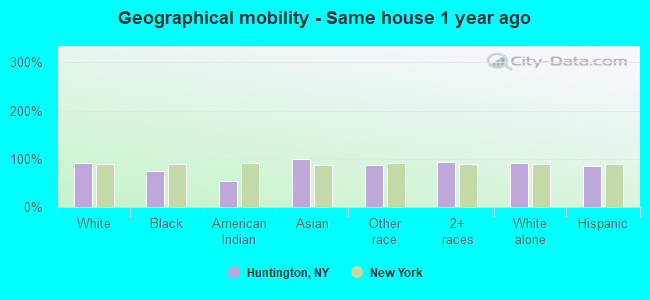
Geographical mobility - Same house 1 year ago (%)
Geographical mobility - Same house 1 year ago (%) - White
Geographical mobility - Same house 1 year ago (%) - Black or African American
Geographical mobility - Same house 1 year ago (%) - Asian
Geographical mobility - Same house 1 year ago (%) - Hispanic or Latino
Geographical mobility - Same house 1 year ago (%) - American Indian and Alaska Native
Geographical mobility - Same house 1 year ago (%) - Multirace
Geographical mobility - Same house 1 year ago (%) - Other Race
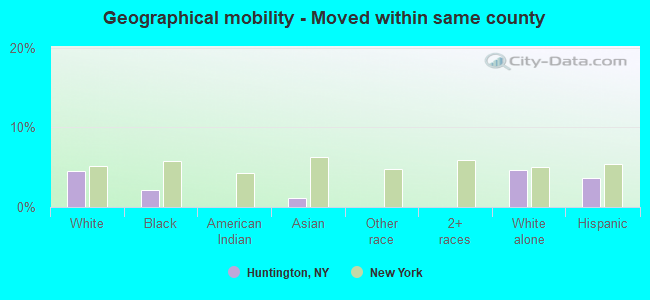
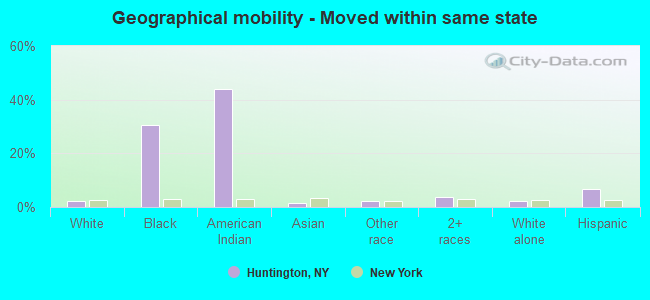
Geographical mobility - Moved within same county (%)
Geographical mobility - Moved within same county (%) - White
Geographical mobility - Moved within same county (%) - Black or African American
Geographical mobility - Moved within same county (%) - Asian
Geographical mobility - Moved within same county (%) - Hispanic or Latino
Geographical mobility - Moved within same county (%) - American Indian and Alaska Native
Geographical mobility - Moved within same county (%) - Multirace
Geographical mobility - Moved within same county (%) - Other Race
Geographical mobility - Moved from different county within same state (%)
Geographical mobility - Moved from different county within same state (%) - White
Geographical mobility - Moved from different county within same state (%) - Black or African American
Geographical mobility - Moved from different county within same state (%) - Asian
Geographical mobility - Moved from different county within same state (%) - Hispanic or Latino
Geographical mobility - Moved from different county within same state (%) - American Indian and Alaska Native
Geographical mobility - Moved from different county within same state (%) - Multirace
Geographical mobility - Moved from different county within same state (%) - Other Race
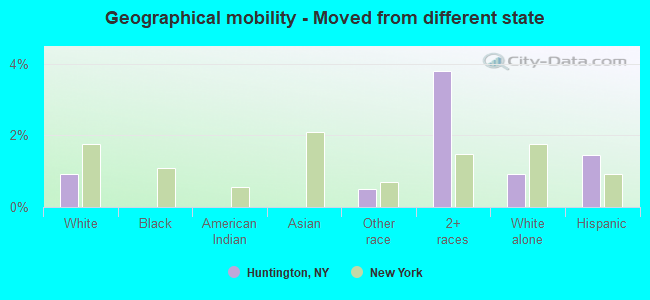
Geographical mobility - Moved from different state (%)
Geographical mobility - Moved from different state (%) - White
Geographical mobility - Moved from different state (%) - Black or African American
Geographical mobility - Moved from different state (%) - Asian
Geographical mobility - Moved from different state (%) - Hispanic or Latino
Geographical mobility - Moved from different state (%) - American Indian and Alaska Native
Geographical mobility - Moved from different state (%) - Multirace
Geographical mobility - Moved from different state (%) - Other Race
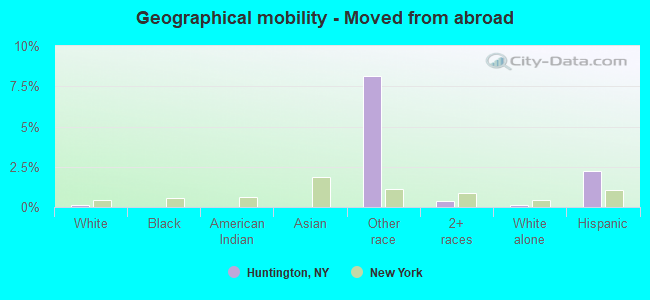
Geographical mobility - Moved from abroad (%)
Geographical mobility - Moved from abroad (%) - White
Geographical mobility - Moved from abroad (%) - Black or African American
Geographical mobility - Moved from abroad (%) - Asian
Geographical mobility - Moved from abroad (%) - Hispanic or Latino
Geographical mobility - Moved from abroad (%) - American Indian and Alaska Native
Geographical mobility - Moved from abroad (%) - Multirace
Geographical mobility - Moved from abroad (%) - Other Race
Place of birth for the foreign-born population - Ireland (%)
Place of birth for the foreign-born population - Denmark (%)
Place of birth for the foreign-born population - Norway (%)
Place of birth for the foreign-born population - Sweden (%)
Place of birth for the foreign-born population - United Kingdom (%)
Place of birth for the foreign-born population - England (%)
Place of birth for the foreign-born population - Scotland (%)
Place of birth for the foreign-born population - Other Northern Europe (%)
Place of birth for the foreign-born population - Austria (%)
Place of birth for the foreign-born population - Belgium (%)
Place of birth for the foreign-born population - France (%)
Place of birth for the foreign-born population - Germany (%)
Place of birth for the foreign-born population - Netherlands (%)
Place of birth for the foreign-born population - Switzerland (%)
Place of birth for the foreign-born population - Other Western Europe (%)
Place of birth for the foreign-born population - Greece (%)
Place of birth for the foreign-born population - Italy (%)
Place of birth for the foreign-born population - Portugal (%)
Place of birth for the foreign-born population - Spain (%)
Place of birth for the foreign-born population - Other Southern Europe (%)
Place of birth for the foreign-born population - Albania (%)
Place of birth for the foreign-born population - Belarus (%)
Place of birth for the foreign-born population - Bosnia and Herzegovina (%)
Place of birth for the foreign-born population - Bulgaria (%)
Place of birth for the foreign-born population - Croatia (%)
Place of birth for the foreign-born population - Czechoslovakia (%)
Place of birth for the foreign-born population - Hungary (%)
Place of birth for the foreign-born population - Latvia (%)
Place of birth for the foreign-born population - Lithuania (%)
Place of birth for the foreign-born population - North Macedonia (Macedonia) (%)
Place of birth for the foreign-born population - Moldova (%)
Place of birth for the foreign-born population - Poland (%)
Place of birth for the foreign-born population - Romania (%)
Place of birth for the foreign-born population - Russia (%)
Place of birth for the foreign-born population - Serbia (%)
Place of birth for the foreign-born population - Ukraine (%)
Place of birth for the foreign-born population - Other Eastern Europe (%)
Place of birth for the foreign-born population - China (%)
Place of birth for the foreign-born population - Hong Kong (%)
Place of birth for the foreign-born population - Taiwan (%)
Place of birth for the foreign-born population - Japan (%)
Place of birth for the foreign-born population - Korea (%)
Place of birth for the foreign-born population - Other Eastern Asia (%)
Place of birth for the foreign-born population - Afghanistan (%)
Place of birth for the foreign-born population - Bangladesh (%)
Place of birth for the foreign-born population - India (%)
Place of birth for the foreign-born population - Iran (%)
Place of birth for the foreign-born population - Kazakhstan (%)
Place of birth for the foreign-born population - Nepal (%)
Place of birth for the foreign-born population - Pakistan (%)
Place of birth for the foreign-born population - Sri Lanka (%)
Place of birth for the foreign-born population - Uzbekistan (%)
Place of birth for the foreign-born population - Other South Central Asia (%)
Place of birth for the foreign-born population - Burma (%)
Place of birth for the foreign-born population - Cambodia (%)
Place of birth for the foreign-born population - Indonesia (%)
Place of birth for the foreign-born population - Laos (%)
Place of birth for the foreign-born population - Malaysia (%)
Place of birth for the foreign-born population - Philippines (%)
Place of birth for the foreign-born population - Singapore (%)
Place of birth for the foreign-born population - Thailand (%)
Place of birth for the foreign-born population - Vietnam (%)
Place of birth for the foreign-born population - Other South Eastern Asia (%)
Place of birth for the foreign-born population - Armenia (%)
Place of birth for the foreign-born population - Iraq (%)
Place of birth for the foreign-born population - Israel (%)
Place of birth for the foreign-born population - Jordan (%)
Place of birth for the foreign-born population - Kuwait (%)
Place of birth for the foreign-born population - Lebanon (%)
Place of birth for the foreign-born population - Saudi Arabia (%)
Place of birth for the foreign-born population - Syria (%)
Place of birth for the foreign-born population - Turkey (%)
Place of birth for the foreign-born population - Yemen (%)
Place of birth for the foreign-born population - Other Western Asia (%)
Place of birth for the foreign-born population - Eritrea (%)
Place of birth for the foreign-born population - Ethiopia (%)
Place of birth for the foreign-born population - Kenya (%)
Place of birth for the foreign-born population - Somalia (%)
Place of birth for the foreign-born population - Uganda (%)
Place of birth for the foreign-born population - Zimbabwe (%)
Place of birth for the foreign-born population - Other Eastern Africa (%)
Place of birth for the foreign-born population - Cameroon (%)
Place of birth for the foreign-born population - Congo (%)
Place of birth for the foreign-born population - Democratic Republic of Congo (Zaire) (%)
Place of birth for the foreign-born population - Other Middle Africa (%)
Place of birth for the foreign-born population - Egypt (%)
Place of birth for the foreign-born population - Morocco (%)
Place of birth for the foreign-born population - Sudan (%)
Place of birth for the foreign-born population - Other Northern Africa (%)
Place of birth for the foreign-born population - South Africa (%)
Place of birth for the foreign-born population - Other Southern Africa (%)
Place of birth for the foreign-born population - Cabo Verde (%)
Place of birth for the foreign-born population - Ghana (%)
Place of birth for the foreign-born population - Liberia (%)
Place of birth for the foreign-born population - Nigeria (%)
Place of birth for the foreign-born population - Senegal (%)
Place of birth for the foreign-born population - Sierra Leone (%)
Place of birth for the foreign-born population - Other Western Africa (%)
Place of birth for the foreign-born population - Australia (%)
Place of birth for the foreign-born population - New Zealand (%)
Place of birth for the foreign-born population - Fiji (%)
Place of birth for the foreign-born population - Micronesia (%)
Place of birth for the foreign-born population - Bahamas (%)
Place of birth for the foreign-born population - Barbados (%)
Place of birth for the foreign-born population - Cuba (%)
Place of birth for the foreign-born population - Dominica (%)
Place of birth for the foreign-born population - Dominican Republic (%)
Place of birth for the foreign-born population - Grenada (%)
Place of birth for the foreign-born population - Haiti (%)
Place of birth for the foreign-born population - Jamaica (%)
Place of birth for the foreign-born population - St. Vincent and the Grenadines (%)
Place of birth for the foreign-born population - Trinidad and Tobago (%)
Place of birth for the foreign-born population - West Indies (%)
Place of birth for the foreign-born population - Other Caribbean (%)
Place of birth for the foreign-born population - Belize (%)
Place of birth for the foreign-born population - Costa Rica (%)
Place of birth for the foreign-born population - El Salvador (%)
Place of birth for the foreign-born population - Guatemala (%)
Place of birth for the foreign-born population - Honduras (%)
Place of birth for the foreign-born population - Mexico (%)
Place of birth for the foreign-born population - Nicaragua (%)
Place of birth for the foreign-born population - Panama (%)
Place of birth for the foreign-born population - Other Central America (%)
Place of birth for the foreign-born population - Argentina (%)
Place of birth for the foreign-born population - Bolivia (%)
Place of birth for the foreign-born population - Brazil (%)
Place of birth for the foreign-born population - Chile (%)
Place of birth for the foreign-born population - Colombia (%)
Place of birth for the foreign-born population - Ecuador (%)
Place of birth for the foreign-born population - Guyana (%)
Place of birth for the foreign-born population - Peru (%)
Place of birth for the foreign-born population - Uruguay (%)
Place of birth for the foreign-born population - Venezuela (%)
Place of birth for the foreign-born population - Other South America (%)
Place of birth for the foreign-born population - Canada (%)
Place of birth for the foreign-born population - Other Northern America (%)
Place of birth for the foreign-born population - Other (%)
Latest news about races in Huntington, NY collected exclusively by city-data.com from local newspapers, TV, and radio stations
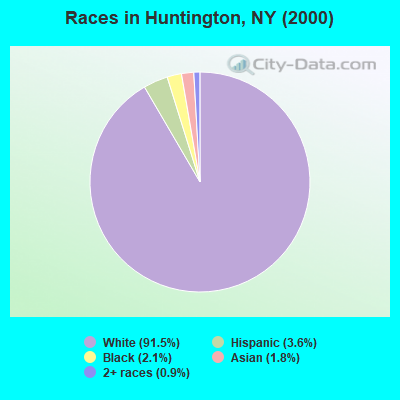
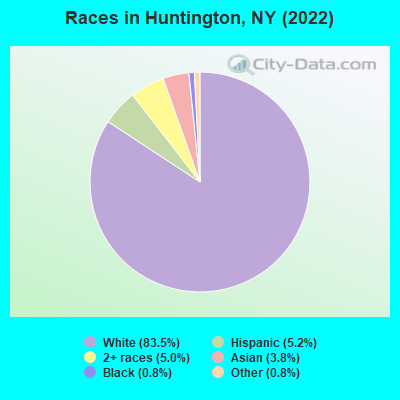
According to 2022 data, the most numerous races in Huntington, NY are White alone (16,389 residents), Hispanic (1,023 residents), and Black alone (160 residents). 86.2% of Huntington residents speak English at home. 9.4% of Huntington, NY residents are foreign-born (3.3% born in Europe, 3.0% born in Asia, 2.4% born in Latin America), which is 133.7% less than the foreign-born rate of 22.0% across the entire state of New York.
Race distribution in Huntington
2000 2022
11,760,981 62.0% White alone 2,867,583 15.1% Hispanic 2,812,623 14.8% Black alone 1,035,926 5.5% Asian alone 366,116 1.9% Two or more races 75,499 0.4% Other race alone 52,499 0.3% American Indian alone 5,230 0.03% Native Hawaiian and Other
10,408,933 52.9% White alone 3,867,299 19.7% Hispanic 2,633,840 13.4% Black alone 1,776,286 9.0% Asian alone 732,670 3.7% Two or more races 216,110 1.1% Other race alone 35,082 0.2% American Indian alone 6,931 0.04% Native Hawaiian and Other
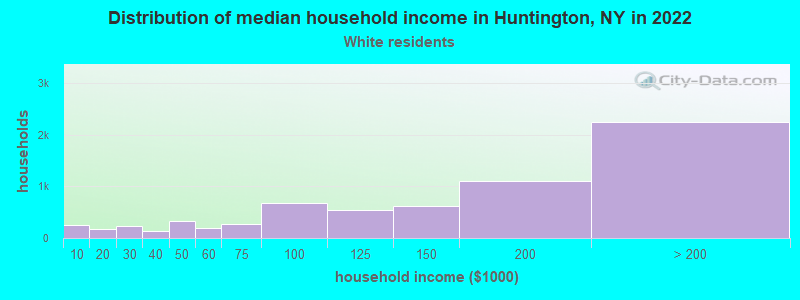
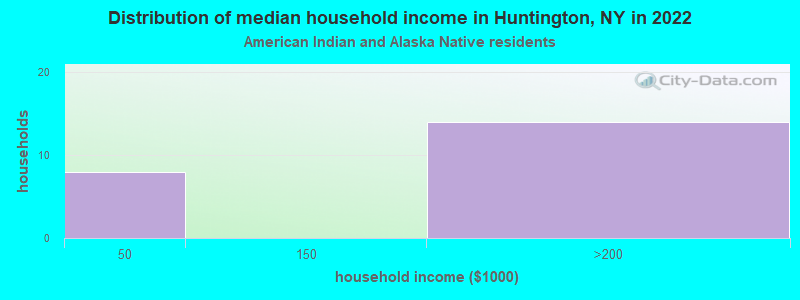
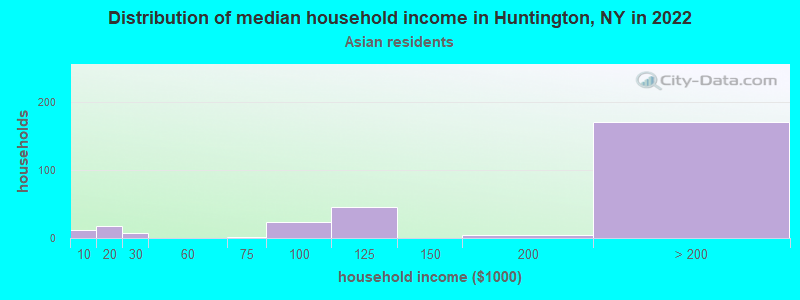
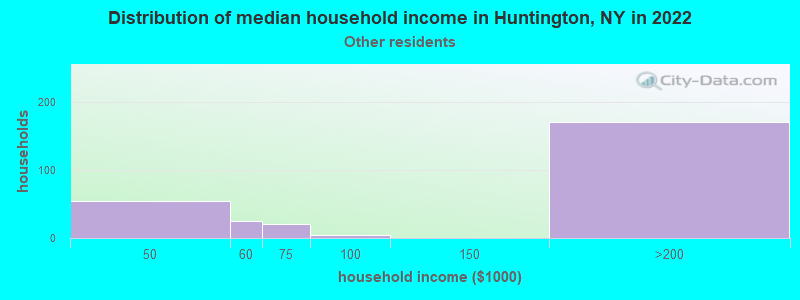
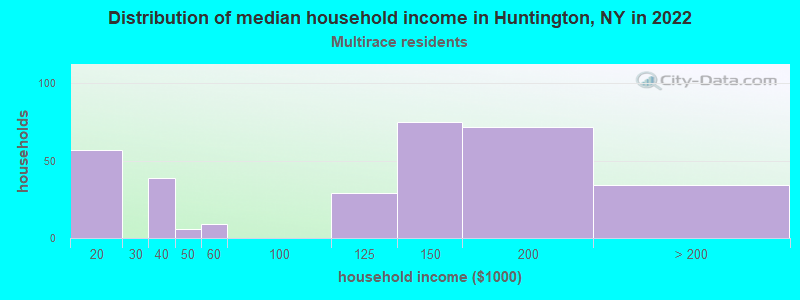
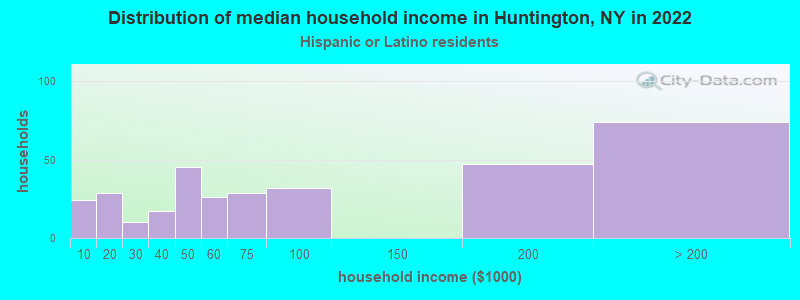
Income and house value in Huntington Median household income in 2022 $145,042 White non-Hispanic householdersover $200,000 Asian householders$127,412 Two or more races householders$71,793 Hispanic or Latino race householdersMedian 2022 house value $810,746 White Non-Hispanic householders$650,710 Black or African American householders $665,657 Asian householders$483,201 Some other race householders$866,927 Two or more races householders$776,987 Hispanic or Latino householders
Median age by race in Huntington
52.0 Median age for White residents51.4 52.2 52.7 Median age for Black or African American residents52.3 52.4 -748,832,865.7 Median age for American Indian / Alaska Native residents-807,017,543.1 -513,692,161.9 37.6 Median age for Asian residents37.1 49.4 -742,816,091.2 Median age for Native Hawaiian / Pacific Islander residents-831,187,409.8 -771,300,447.7 38.2 Median age for Other race residents45.8 27.0 24.9 Median age for Two or more races residents6.2 44.7 50.7 Median age for White alone residents50.5 51.1 31.8 Median age for Hispanic or Latino residents27.9 33.0
Owner/renter occupied households by race in Huntington
House owners and renters - White residents 5,739 84.5% Owner occupied1,052 15.5% Renter occupiedHouse owners and renters - Black or African American residents 8 100.0% Owner occupiedHouse owners and renters - American Indian / Alaska Native residents 9 29.7% Owner occupied21 70.3% Renter occupiedHouse owners and renters - Asian residents 278 89.1% Owner occupied34 10.9% Renter occupiedHouse owners and renters - Other race residents 190 88.0% Owner occupied26 12.0% Renter occupiedHouse owners and renters - Two or more races residents 248 80.8% Owner occupied59 19.2% Renter occupiedHouse owners and renters - White alone residents 5,853 84.4% Owner occupied1,080 15.6% Renter occupiedHouse owners and renters - Hispanic or Latino residents 185 56.5% Owner occupied143 43.5% Renter occupied
Language usage in Huntington
English speakers - Total 86.2% of residents of Huntington speak English at home.
4.8% of residents speak Spanish at home 553 60.8% Speak English very well357 39.2% Speak English less than very well8.3% of residents speak other language at home 1,339 85.2% Speak English very well232 14.8% Speak English less than very well
English speakers - Born in the United States 90.9% of residents of Huntington speak English at home.
2.4% of residents speak Spanish at home 49 83.1% Speak English very well10 16.9% Speak English less than very well7.1% of residents speak other language at home 176 100.0% Speak English very well
English speakers - Native, born elsewhere 91.5% of residents of Huntington speak English at home.
8.5% of residents speak Spanish at home 12 100.0% Speak English very well10.6% of residents speak other language at home 15 100.0% Speak English very well
English speakers - Foreign-born 41.6% of residents of Huntington speak English at home.
20.4% of residents speak Spanish at home 186 45.5% Speak English very well223 54.5% Speak English less than very well34.9% of residents speak other language at home 520 74.3% Speak English very well180 25.7% Speak English less than very well
White (Caucasian) - Speak only English Native:
95.6% (14,260)Foreign-born:
59.1% (368)
White (Caucasian) - Speak another language Native:
4.6% (687)Foreign-born:
49.9% (311)
Black or African American - Speak only English Native:
97.0% (140)Foreign-born:
83.4% (15)
American Indian / Alaska Native - Speak another language Native:
100.0% (12)Foreign-born:
100.0% (17)
Asian - Speak only English Native:
61.0% (139)Foreign-born:
30.8% (158)
Asian - Speak another language Native:
36.1% (82)Foreign-born:
56.1% (288)
Other race - Speak only English Native:
70.1% (56)Foreign-born:
31.6% (144)
Other race - Speak another language Native:
33.5% (27)Foreign-born:
63.0% (287)
Two or more races - Speak only English Native:
77.0% (682)Foreign-born:
30.2% (46)
Two or more races - Speak another language Native:
23.5% (208)Foreign-born:
67.4% (103)
White alone - Speak only English Native:
93.9% (14,331)Foreign-born:
51.1% (366)
White alone - Speak another language Native:
6.2% (952)Foreign-born:
48.9% (350)
Hispanic or Latino - Speak only English Native:
66.7% (337)Foreign-born:
15.8% (80)
Hispanic or Latino - Speak another language Native:
34.5% (174)Foreign-born:
83.3% (423)
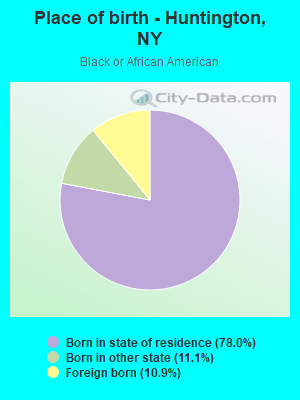
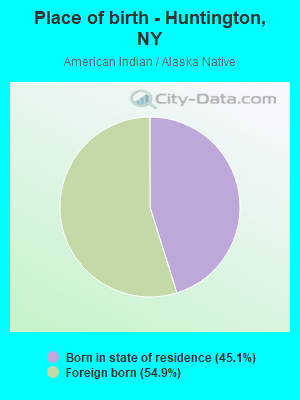
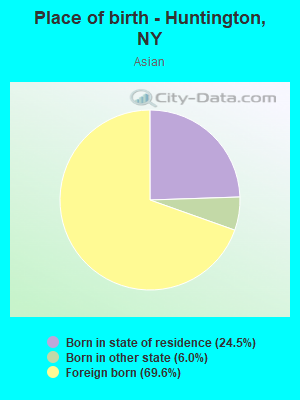
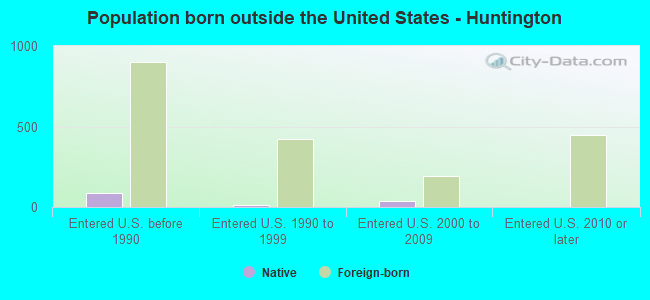
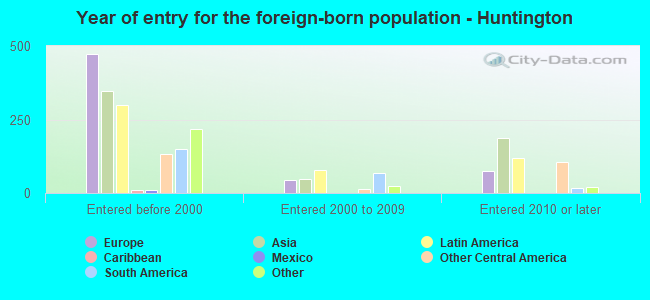
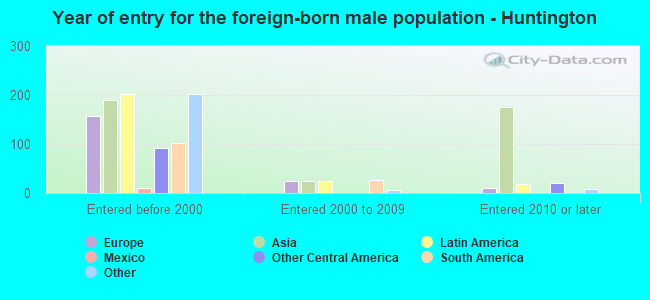
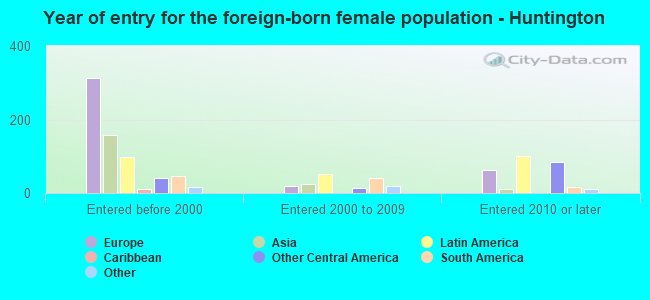
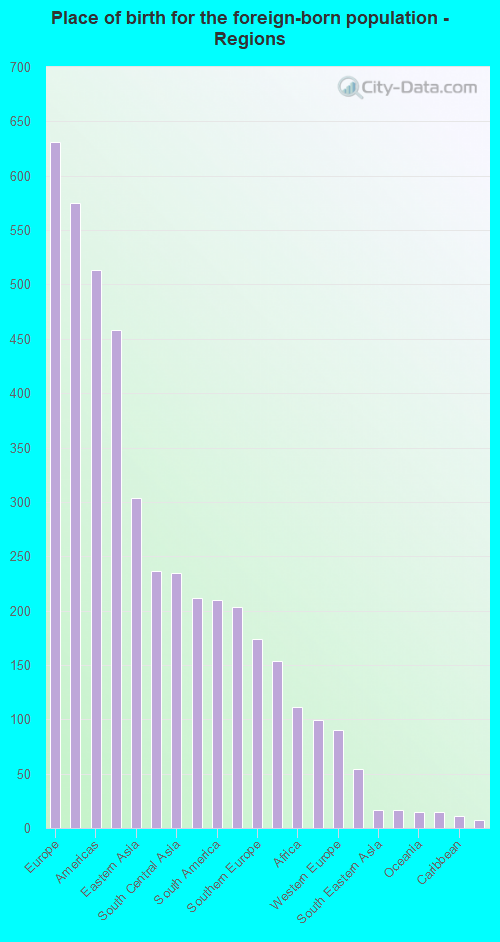
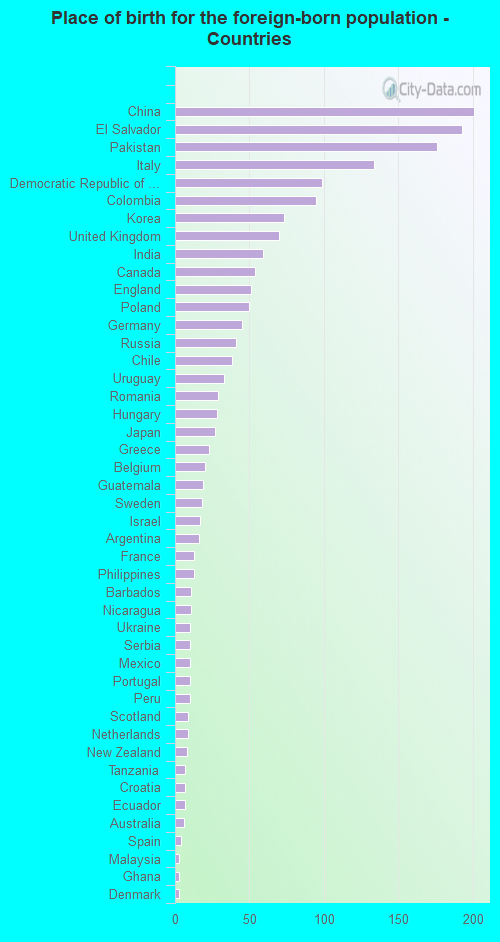
Foreign-born residents in Huntington 1,847 residents are foreign born (3.3% Europe , 3.0% Asia , 2.4% Latin America ).
This city:
9.4%New York:
22.6%
Marital status for residents in Huntington Marital status - White (Caucasian) population 15 years and over
Males 29.0% Never married60.1% Now married1.3% Separated2.2% Widowed7.4% DivorcedFemales 28.7% Never married48.0% Now married1.5% Separated8.5% Widowed13.2% DivorcedWomen who gave birth in the past 12 months Now married:
87.1% (100)Unmarried:
12.9% (15)
Women who did not give birth in the past 12 months Now married:
33.3% (1,020)Unmarried:
66.7% (2,047)
Marital status - Black or African American population 15 years and over
Males 56.1% Never married9.8% Now married0.0% Separated3.7% Widowed30.5% DivorcedFemales 13.7% Never married38.7% Now married0.0% Separated0.0% Widowed47.5% DivorcedWomen who did not give birth in the past 12 months Now married:
100.0% (23)Unmarried:
0.0% (0)
Marital status - Asian population 15 years and over
Males 54.2% Never married38.2% Now married0.7% Separated0.0% Widowed6.8% DivorcedFemales 11.1% Never married57.7% Now married0.0% Separated10.3% Widowed20.9% DivorcedWomen who gave birth in the past 12 months Now married:
100.0% (4)Unmarried:
0.0% (0)
Women who did not give birth in the past 12 months Now married:
52.3% (71)Unmarried:
47.7% (65)
Marital status - Other race population 15 years and over
Males 76.3% Never married23.7% Now married0.0% Separated0.0% Widowed0.0% DivorcedFemales 59.5% Never married28.6% Now married0.0% Separated0.0% Widowed11.9% DivorcedWomen who did not give birth in the past 12 months Now married:
27.9% (42)Unmarried:
72.1% (109)
Marital status - Two or more races population 15 years and over
Males 32.6% Never married59.1% Now married0.0% Separated3.9% Widowed4.4% DivorcedFemales 24.9% Never married48.9% Now married4.8% Separated4.8% Widowed16.6% DivorcedWomen who gave birth in the past 12 months Now married:
100.0% (22)Unmarried:
0.0% (0)
Women who did not give birth in the past 12 months Now married:
52.6% (180)Unmarried:
47.4% (162)
Marital status - White alone, not Hispanic / Latino population 15 years and over
Males 28.8% Never married60.5% Now married1.1% Separated2.1% Widowed7.5% DivorcedFemales 28.8% Never married48.2% Now married1.3% Separated8.6% Widowed13.0% DivorcedWomen who gave birth in the past 12 months Now married:
87.1% (108)Unmarried:
12.9% (16)
Women who did not give birth in the past 12 months Now married:
33.0% (1,071)Unmarried:
67.0% (2,176)
Marital status - Hispanic or Latino population 15 years and over
Males 36.2% Never married51.9% Now married5.2% Separated4.7% Widowed2.1% DivorcedFemales 37.9% Never married35.5% Now married4.7% Separated1.6% Widowed20.4% DivorcedWomen who did not give birth in the past 12 months Now married:
40.0% (126)Unmarried:
60.0% (189)
Ancestries in Huntington
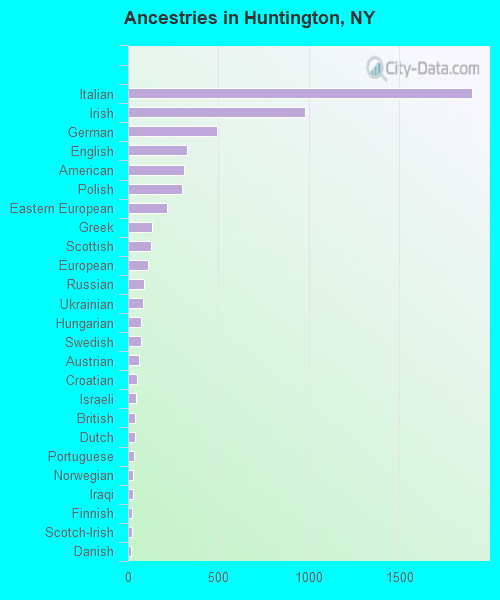
1,900 25.6% Italian978 13.2% Irish494 6.7% German324 4.4% English310 4.2% American298 4.0% Polish214 2.9% Eastern European130 1.8% Greek125 1.7% Scottish111 1.5% European91 1.2% Russian81 1.1% Ukrainian72 1.0% Hungarian70 0.9% Swedish61 0.8% Austrian49 0.7% Croatian44 0.6% Israeli41 0.6% British40 0.5% Dutch31 0.4% Portuguese29 0.4% Norwegian28 0.4% Iraqi24 0.3% Finnish20 0.3% Scotch-Irish19 0.3% Danish19 0.3% Romanian18 0.2% French14 0.2% Serbian9 0.1% Armenian9 0.1% New Zealander9 0.1% Northern European9 0.1% Ghanaian8 0.1% Jordanian6 0.08% Celtic4 0.05% Scandinavian3 0.04% Lithuanian
Children Nativity (place of birth) in Huntington
Children under 6 years - Living with two parents Both parents native 541 100.0% NativeBoth parents foreign-born 67 100.0% NativeOne native, one foreign-born parent 64 100.0% NativeChildren under 6 years - Living with one parent Native parent 207 100.0% NativeForeign-born parent 9 100.0% NativeChildren 6 to 17 years - Living with two parents Both parents native 1,156 98.5% Native18 1.5% Foreign-bornBoth parents foreign-born 103 92.3% Native9 7.7% Foreign-bornOne native, one foreign-born parent 245 100.0% NativeChildren 6 to 17 years - Living with one parent Native parent 662 96.5% Native24 3.5% Foreign-bornForeign-born parent 42 80.0% Native10 20.0% Foreign-born
Grandparents responsible for own grandchildren in Huntington
Grandparents (30 to 59 years) Other race 23 100.0% Responsible for grandchildrenHispanic or Latino 26 100.0% Responsible for grandchildren
Grandparents (60 years and over)