Races in Hunters Creek, Florida (FL) Detailed Stats
Data:
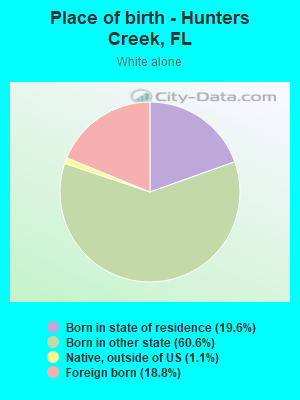
Races - White alone (%)
Races - White alone (% change since 2000)
Races - Black alone (%)
Races - Black alone (% change since 2000)
Races - American Indian alone (%)
Races - American Indian alone (% change since 2000)
Races - Asian alone (%)
Races - Asian alone (% change since 2000)
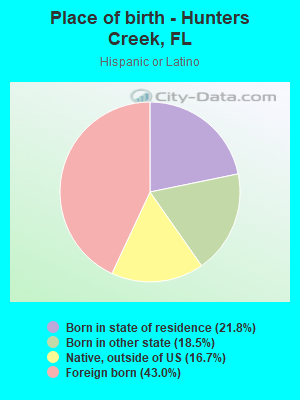
Races - Hispanic (%)
Races - Hispanic (% change since 2000)
Races - Native Hawaiian and Other Pacific Islander alone (%)
Races - Native Hawaiian and Other Pacific Islander alone (% change since 2000)
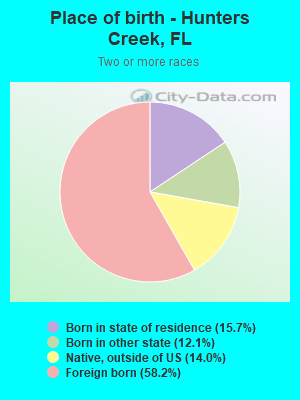
Races - Two or more races(%)
Races - Two or more races(% change since 2000)
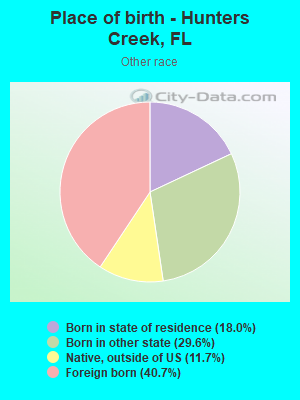
Races - Other race alone (%)
Races - Other race alone (% change since 2000)
Racial diversity
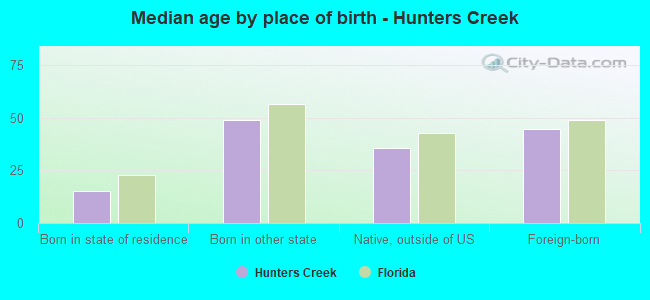
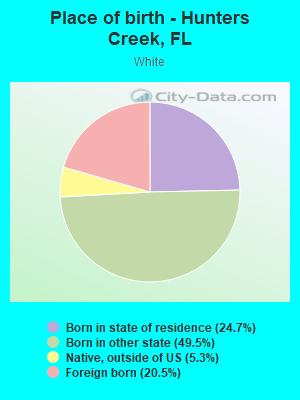
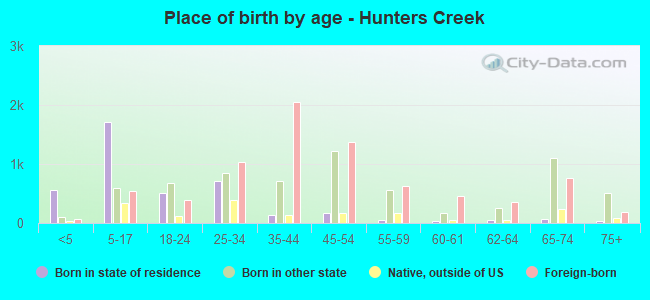
Place of birth - Born in state of residence (%)
Place of birth - Born in state of residence (%) - White
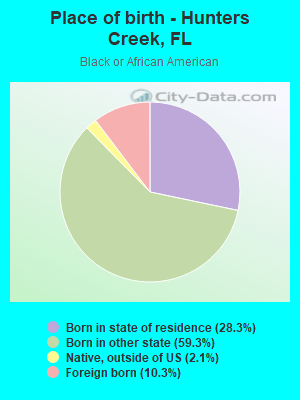
Place of birth - Born in state of residence (%) - Black or African American
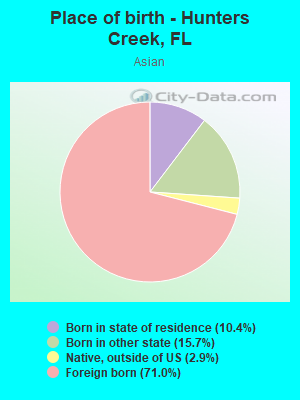
Place of birth - Born in state of residence (%) - Asian
Place of birth - Born in state of residence (%) - Hispanic or Latino
Place of birth - Born in state of residence (%) - American Indian and Alaska Native
Place of birth - Born in state of residence (%) - Multirace
Place of birth - Born in state of residence (%) - Other Race
Place of birth - Born in other state (%)
Place of birth - Born in other state (%) - White
Place of birth - Born in other state (%) - Black or African American
Place of birth - Born in other state (%) - Asian
Place of birth - Born in other state (%) - Hispanic or Latino
Place of birth - Born in other state (%) - American Indian and Alaska Native
Place of birth - Born in other state (%) - Multirace
Place of birth - Born in other state (%) - Other Race
Place of birth - Native, outside of US (%)
Place of birth - Native, outside of US (%) - White
Place of birth - Native, outside of US (%) - Black or African American
Place of birth - Native, outside of US (%) - Asian
Place of birth - Native, outside of US (%) - Hispanic or Latino
Place of birth - Native, outside of US (%) - American Indian and Alaska Native
Place of birth - Native, outside of US (%) - Multirace
Place of birth - Native, outside of US (%) - Other Race
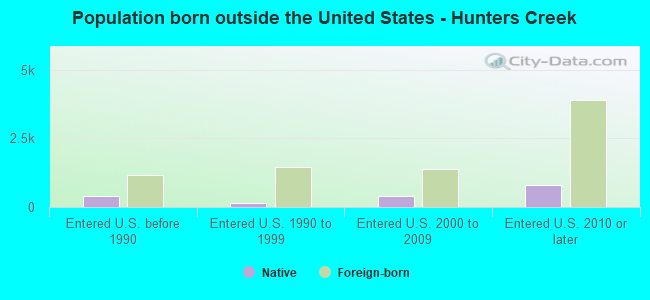
Place of birth - Foreign born (%)
Place of birth - Foreign born (%) - White
Place of birth - Foreign born (%) - Black or African American
Place of birth - Foreign born (%) - Asian
Place of birth - Foreign born (%) - Hispanic or Latino
Place of birth - Foreign born (%) - American Indian and Alaska Native
Place of birth - Foreign born (%) - Multirace
Place of birth - Foreign born (%) - Other Race
Residents speaking English at home (%)
Residents speaking English at home - Born in the United States (%)
Residents speaking English at home - Native, born elsewhere (%)
Residents speaking English at home - Foreign born (%)
Residents speaking Spanish at home (%)
Residents speaking Spanish at home - Born in the United States (%)
Residents speaking Spanish at home - Native, born elsewhere (%)
Residents speaking Spanish at home - Foreign born (%)
Residents speaking other language at home (%)
Residents speaking other language at home - Born in the United States (%)
Residents speaking other language at home - Native, born elsewhere (%)
Residents speaking other language at home - Foreign born (%)
Marital status - Never married (%)
Marital status - Now married (%)
Marital status - Separated (%)
Marital status - Widowed (%)
Marital status - Divorced (%)
Ancestries Reported - Arab (%)
Ancestries Reported - Czech (%)
Ancestries Reported - Danish (%)
Ancestries Reported - Dutch (%)
Ancestries Reported - English (%)
Ancestries Reported - French (%)
Ancestries Reported - French Canadian (%)
Ancestries Reported - German (%)
Ancestries Reported - Greek (%)
Ancestries Reported - Hungarian (%)
Ancestries Reported - Irish (%)
Ancestries Reported - Italian (%)
Ancestries Reported - Lithuanian (%)
Ancestries Reported - Norwegian (%)
Ancestries Reported - Polish (%)
Ancestries Reported - Portuguese (%)
Ancestries Reported - Russian (%)
Ancestries Reported - Scotch-Irish (%)
Ancestries Reported - Scottish (%)
Ancestries Reported - Slovak (%)
Ancestries Reported - Subsaharan African (%)
Ancestries Reported - Swedish (%)
Ancestries Reported - Swiss (%)
Ancestries Reported - Ukrainian (%)
Ancestries Reported - United States (%)
Ancestries Reported - Welsh (%)
Ancestries Reported - West Indian (%)
Ancestries Reported - Other (%)
Geographical mobility - Same house 1 year ago (%)
Geographical mobility - Same house 1 year ago (%) - White
Geographical mobility - Same house 1 year ago (%) - Black or African American
Geographical mobility - Same house 1 year ago (%) - Asian
Geographical mobility - Same house 1 year ago (%) - Hispanic or Latino
Geographical mobility - Same house 1 year ago (%) - American Indian and Alaska Native
Geographical mobility - Same house 1 year ago (%) - Multirace
Geographical mobility - Same house 1 year ago (%) - Other Race
Geographical mobility - Moved within same county (%)
Geographical mobility - Moved within same county (%) - White
Geographical mobility - Moved within same county (%) - Black or African American
Geographical mobility - Moved within same county (%) - Asian
Geographical mobility - Moved within same county (%) - Hispanic or Latino
Geographical mobility - Moved within same county (%) - American Indian and Alaska Native
Geographical mobility - Moved within same county (%) - Multirace
Geographical mobility - Moved within same county (%) - Other Race
Geographical mobility - Moved from different county within same state (%)
Geographical mobility - Moved from different county within same state (%) - White
Geographical mobility - Moved from different county within same state (%) - Black or African American
Geographical mobility - Moved from different county within same state (%) - Asian
Geographical mobility - Moved from different county within same state (%) - Hispanic or Latino
Geographical mobility - Moved from different county within same state (%) - American Indian and Alaska Native
Geographical mobility - Moved from different county within same state (%) - Multirace
Geographical mobility - Moved from different county within same state (%) - Other Race
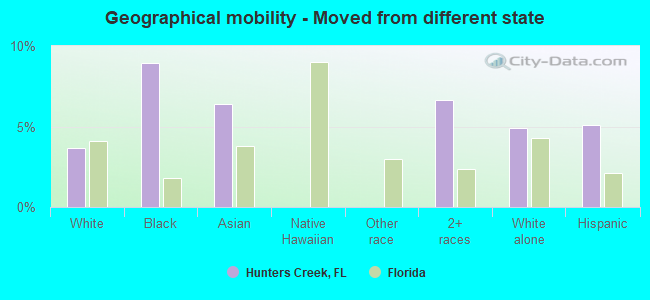
Geographical mobility - Moved from different state (%)
Geographical mobility - Moved from different state (%) - White
Geographical mobility - Moved from different state (%) - Black or African American
Geographical mobility - Moved from different state (%) - Asian
Geographical mobility - Moved from different state (%) - Hispanic or Latino
Geographical mobility - Moved from different state (%) - American Indian and Alaska Native
Geographical mobility - Moved from different state (%) - Multirace
Geographical mobility - Moved from different state (%) - Other Race
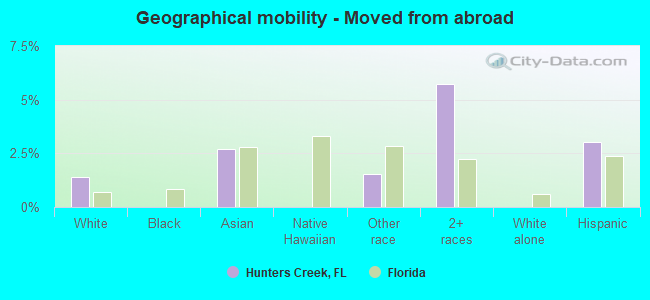
Geographical mobility - Moved from abroad (%)
Geographical mobility - Moved from abroad (%) - White
Geographical mobility - Moved from abroad (%) - Black or African American
Geographical mobility - Moved from abroad (%) - Asian
Geographical mobility - Moved from abroad (%) - Hispanic or Latino
Geographical mobility - Moved from abroad (%) - American Indian and Alaska Native
Geographical mobility - Moved from abroad (%) - Multirace
Geographical mobility - Moved from abroad (%) - Other Race
Place of birth for the foreign-born population - Ireland (%)
Place of birth for the foreign-born population - Denmark (%)
Place of birth for the foreign-born population - Norway (%)
Place of birth for the foreign-born population - Sweden (%)
Place of birth for the foreign-born population - United Kingdom (%)
Place of birth for the foreign-born population - England (%)
Place of birth for the foreign-born population - Scotland (%)
Place of birth for the foreign-born population - Other Northern Europe (%)
Place of birth for the foreign-born population - Austria (%)
Place of birth for the foreign-born population - Belgium (%)
Place of birth for the foreign-born population - France (%)
Place of birth for the foreign-born population - Germany (%)
Place of birth for the foreign-born population - Netherlands (%)
Place of birth for the foreign-born population - Switzerland (%)
Place of birth for the foreign-born population - Other Western Europe (%)
Place of birth for the foreign-born population - Greece (%)
Place of birth for the foreign-born population - Italy (%)
Place of birth for the foreign-born population - Portugal (%)
Place of birth for the foreign-born population - Spain (%)
Place of birth for the foreign-born population - Other Southern Europe (%)
Place of birth for the foreign-born population - Albania (%)
Place of birth for the foreign-born population - Belarus (%)
Place of birth for the foreign-born population - Bosnia and Herzegovina (%)
Place of birth for the foreign-born population - Bulgaria (%)
Place of birth for the foreign-born population - Croatia (%)
Place of birth for the foreign-born population - Czechoslovakia (%)
Place of birth for the foreign-born population - Hungary (%)
Place of birth for the foreign-born population - Latvia (%)
Place of birth for the foreign-born population - Lithuania (%)
Place of birth for the foreign-born population - North Macedonia (Macedonia) (%)
Place of birth for the foreign-born population - Moldova (%)
Place of birth for the foreign-born population - Poland (%)
Place of birth for the foreign-born population - Romania (%)
Place of birth for the foreign-born population - Russia (%)
Place of birth for the foreign-born population - Serbia (%)
Place of birth for the foreign-born population - Ukraine (%)
Place of birth for the foreign-born population - Other Eastern Europe (%)
Place of birth for the foreign-born population - China (%)
Place of birth for the foreign-born population - Hong Kong (%)
Place of birth for the foreign-born population - Taiwan (%)
Place of birth for the foreign-born population - Japan (%)
Place of birth for the foreign-born population - Korea (%)
Place of birth for the foreign-born population - Other Eastern Asia (%)
Place of birth for the foreign-born population - Afghanistan (%)
Place of birth for the foreign-born population - Bangladesh (%)
Place of birth for the foreign-born population - India (%)
Place of birth for the foreign-born population - Iran (%)
Place of birth for the foreign-born population - Kazakhstan (%)
Place of birth for the foreign-born population - Nepal (%)
Place of birth for the foreign-born population - Pakistan (%)
Place of birth for the foreign-born population - Sri Lanka (%)
Place of birth for the foreign-born population - Uzbekistan (%)
Place of birth for the foreign-born population - Other South Central Asia (%)
Place of birth for the foreign-born population - Burma (%)
Place of birth for the foreign-born population - Cambodia (%)
Place of birth for the foreign-born population - Indonesia (%)
Place of birth for the foreign-born population - Laos (%)
Place of birth for the foreign-born population - Malaysia (%)
Place of birth for the foreign-born population - Philippines (%)
Place of birth for the foreign-born population - Singapore (%)
Place of birth for the foreign-born population - Thailand (%)
Place of birth for the foreign-born population - Vietnam (%)
Place of birth for the foreign-born population - Other South Eastern Asia (%)
Place of birth for the foreign-born population - Armenia (%)
Place of birth for the foreign-born population - Iraq (%)
Place of birth for the foreign-born population - Israel (%)
Place of birth for the foreign-born population - Jordan (%)
Place of birth for the foreign-born population - Kuwait (%)
Place of birth for the foreign-born population - Lebanon (%)
Place of birth for the foreign-born population - Saudi Arabia (%)
Place of birth for the foreign-born population - Syria (%)
Place of birth for the foreign-born population - Turkey (%)
Place of birth for the foreign-born population - Yemen (%)
Place of birth for the foreign-born population - Other Western Asia (%)
Place of birth for the foreign-born population - Eritrea (%)
Place of birth for the foreign-born population - Ethiopia (%)
Place of birth for the foreign-born population - Kenya (%)
Place of birth for the foreign-born population - Somalia (%)
Place of birth for the foreign-born population - Uganda (%)
Place of birth for the foreign-born population - Zimbabwe (%)
Place of birth for the foreign-born population - Other Eastern Africa (%)
Place of birth for the foreign-born population - Cameroon (%)
Place of birth for the foreign-born population - Congo (%)
Place of birth for the foreign-born population - Democratic Republic of Congo (Zaire) (%)
Place of birth for the foreign-born population - Other Middle Africa (%)
Place of birth for the foreign-born population - Egypt (%)
Place of birth for the foreign-born population - Morocco (%)
Place of birth for the foreign-born population - Sudan (%)
Place of birth for the foreign-born population - Other Northern Africa (%)
Place of birth for the foreign-born population - South Africa (%)
Place of birth for the foreign-born population - Other Southern Africa (%)
Place of birth for the foreign-born population - Cabo Verde (%)
Place of birth for the foreign-born population - Ghana (%)
Place of birth for the foreign-born population - Liberia (%)
Place of birth for the foreign-born population - Nigeria (%)
Place of birth for the foreign-born population - Senegal (%)
Place of birth for the foreign-born population - Sierra Leone (%)
Place of birth for the foreign-born population - Other Western Africa (%)
Place of birth for the foreign-born population - Australia (%)
Place of birth for the foreign-born population - New Zealand (%)
Place of birth for the foreign-born population - Fiji (%)
Place of birth for the foreign-born population - Micronesia (%)
Place of birth for the foreign-born population - Bahamas (%)
Place of birth for the foreign-born population - Barbados (%)
Place of birth for the foreign-born population - Cuba (%)
Place of birth for the foreign-born population - Dominica (%)
Place of birth for the foreign-born population - Dominican Republic (%)
Place of birth for the foreign-born population - Grenada (%)
Place of birth for the foreign-born population - Haiti (%)
Place of birth for the foreign-born population - Jamaica (%)
Place of birth for the foreign-born population - St. Vincent and the Grenadines (%)
Place of birth for the foreign-born population - Trinidad and Tobago (%)
Place of birth for the foreign-born population - West Indies (%)
Place of birth for the foreign-born population - Other Caribbean (%)
Place of birth for the foreign-born population - Belize (%)
Place of birth for the foreign-born population - Costa Rica (%)
Place of birth for the foreign-born population - El Salvador (%)
Place of birth for the foreign-born population - Guatemala (%)
Place of birth for the foreign-born population - Honduras (%)
Place of birth for the foreign-born population - Mexico (%)
Place of birth for the foreign-born population - Nicaragua (%)
Place of birth for the foreign-born population - Panama (%)
Place of birth for the foreign-born population - Other Central America (%)
Place of birth for the foreign-born population - Argentina (%)
Place of birth for the foreign-born population - Bolivia (%)
Place of birth for the foreign-born population - Brazil (%)
Place of birth for the foreign-born population - Chile (%)
Place of birth for the foreign-born population - Colombia (%)
Place of birth for the foreign-born population - Ecuador (%)
Place of birth for the foreign-born population - Guyana (%)
Place of birth for the foreign-born population - Peru (%)
Place of birth for the foreign-born population - Uruguay (%)
Place of birth for the foreign-born population - Venezuela (%)
Place of birth for the foreign-born population - Other South America (%)
Place of birth for the foreign-born population - Canada (%)
Place of birth for the foreign-born population - Other Northern America (%)
Place of birth for the foreign-born population - Other (%)
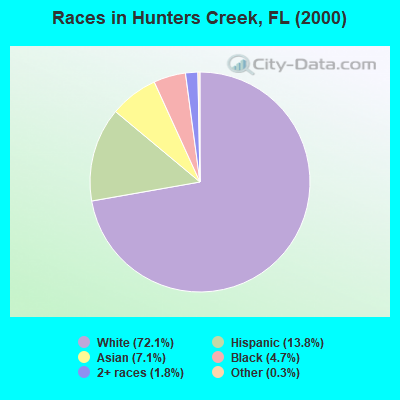
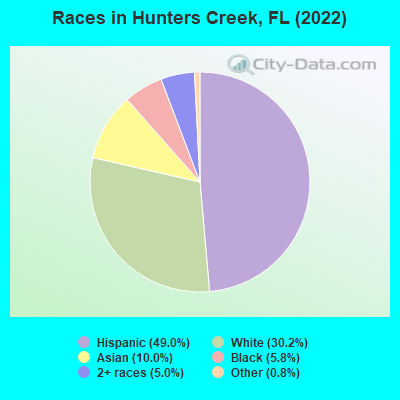
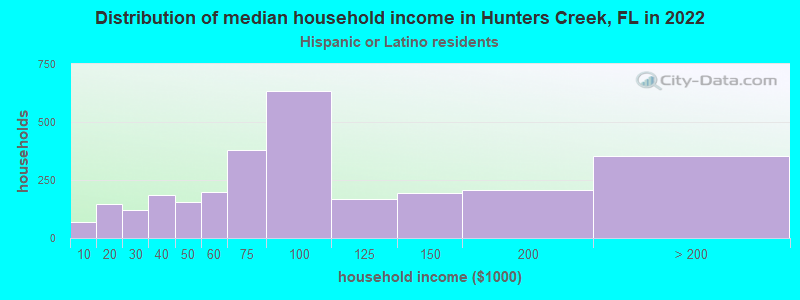
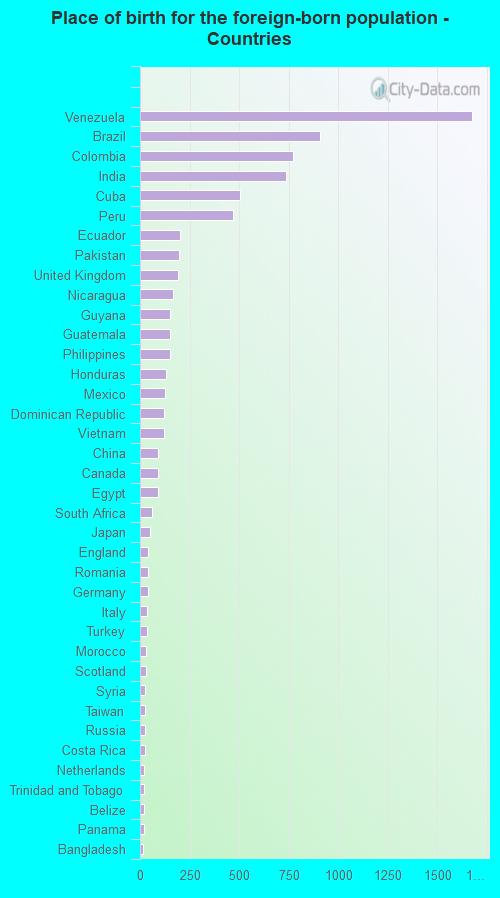
According to 2022 data, the most numerous races in Hunters Creek, FL are White alone (6,123 residents), Hispanic (9,915 residents), and Black alone (1,172 residents). 43.8% of Hunters Creek residents speak English at home. 38.1% of Hunters Creek, FL residents are foreign-born (26.3% born in Latin America, 7.2% born in Asia), which is 44.9% greater than the foreign-born rate of 21.0% across the entire state of Florida.
Race distribution in Hunters Creek
2000 2022
10,458,509 65.4% White alone 2,682,715 16.8% Hispanic 2,264,268 14.2% Black alone 261,693 1.6% Asian alone 236,954 1.5% Two or more races 42,358 0.3% American Indian alone 28,994 0.2% Other race alone 6,887 0.04% Native Hawaiian and Other
11,309,403 50.8% White alone 6,025,039 27.1% Hispanic 3,241,015 14.6% Black alone 861,630 3.9% Two or more races 623,692 2.8% Asian alone 152,054 0.7% Other race alone 22,504 0.1% American Indian alone 9,486 0.04% Native Hawaiian and Other
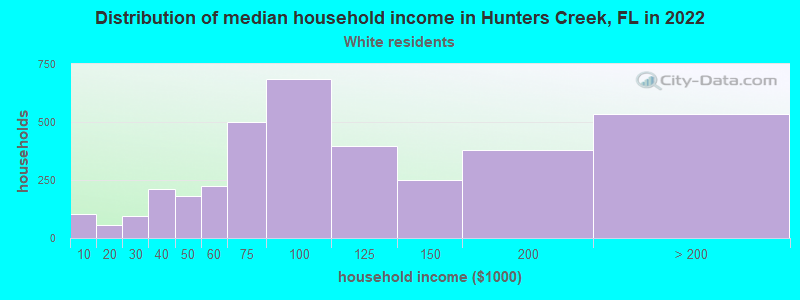
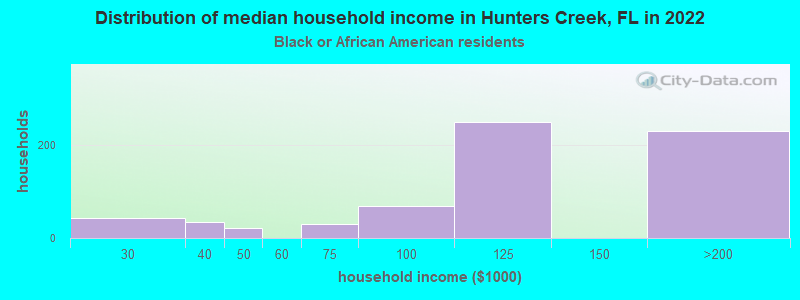
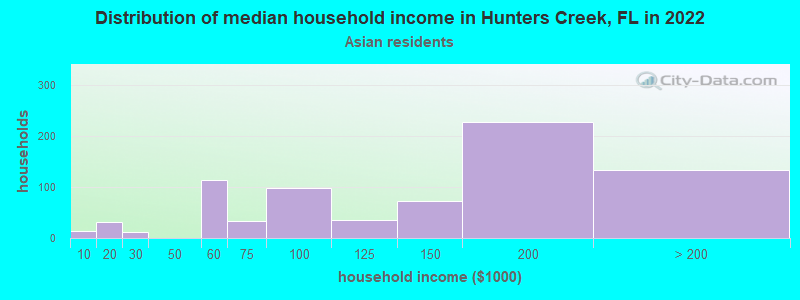
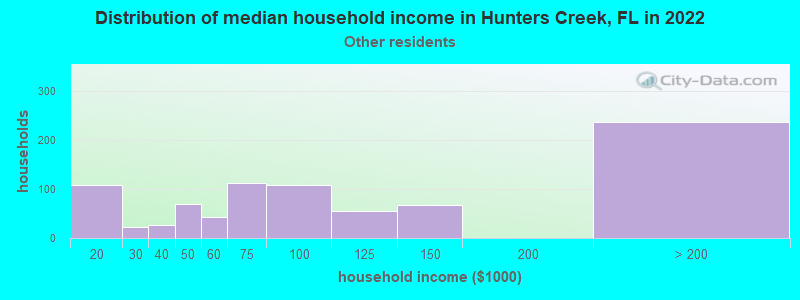
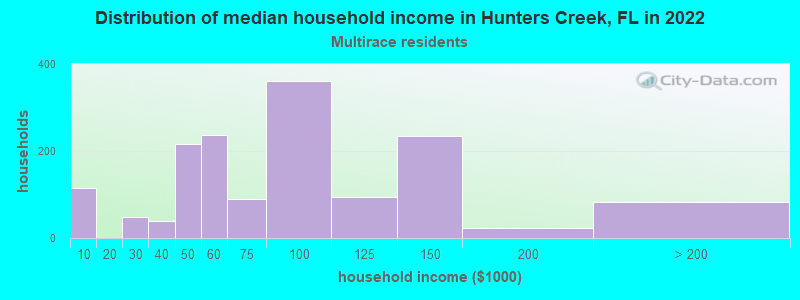
Income and house value in Hunters Creek Median household income in 2022 $92,160 White non-Hispanic householders$123,831 Black householders$118,028 Asian householders$77,369 Some other race householders$90,187 Two or more races householders$84,137 Hispanic or Latino race householdersMedian 2022 house value $438,183 White Non-Hispanic householders$429,547 Black or African American householders $474,254 Asian householders$698,553 Some other race householders$524,042 Two or more races householders$478,572 Hispanic or Latino householders
Median age by race in Hunters Creek
44.9 Median age for White residents45.4 44.2 43.1 Median age for Black or African American residents50.1 36.1 -614,300,100.1 Median age for American Indian / Alaska Native residents-735,632,183.2 -529,680,364.8 37.7 Median age for Asian residents34.4 40.7 -679,790,025.6 Median age for Native Hawaiian / Pacific Islander residents-1,327,635,326.3 -611,111,110.5 31.1 Median age for Other race residents45.7 28.4 40.4 Median age for Two or more races residents35.4 46.1 50.1 Median age for White alone residents49.7 51.0 35.2 Median age for Hispanic or Latino residents34.4 37.5
Owner/renter occupied households by race in Hunters Creek
House owners and renters - White residents 2,252 62.5% Owner occupied1,350 37.5% Renter occupiedHouse owners and renters - Black or African American residents 402 66.7% Owner occupied201 33.3% Renter occupiedHouse owners and renters - Asian residents 323 43.3% Owner occupied423 56.7% Renter occupiedHouse owners and renters - Other race residents 504 55.6% Owner occupied403 44.4% Renter occupiedHouse owners and renters - Two or more races residents 654 41.4% Owner occupied926 58.6% Renter occupiedHouse owners and renters - White alone residents 1,928 65.8% Owner occupied1,002 34.2% Renter occupiedHouse owners and renters - Hispanic or Latino residents 1,308 47.3% Owner occupied1,456 52.7% Renter occupied
Language usage in Hunters Creek
English speakers - Total 43.8% of residents of Hunters Creek speak English at home.
40.2% of residents speak Spanish at home 5,154 65.6% Speak English very well2,697 34.4% Speak English less than very well15.9% of residents speak other language at home 2,163 69.6% Speak English very well946 30.4% Speak English less than very well
English speakers - Born in the United States 76.5% of residents of Hunters Creek speak English at home.
20.1% of residents speak Spanish at home 942 70.2% Speak English very well400 29.8% Speak English less than very well4.1% of residents speak other language at home 219 80.8% Speak English very well52 19.2% Speak English less than very well
English speakers - Native, born elsewhere 12.3% of residents of Hunters Creek speak English at home.
90.8% of residents speak Spanish at home 1,457 89.8% Speak English very well165 10.2% Speak English less than very well2.5% of residents speak other language at home 45 100.0% Speak English very well
English speakers - Foreign-born 10.8% of residents of Hunters Creek speak English at home.
55.8% of residents speak Spanish at home 2,019 46.7% Speak English very well2,308 53.3% Speak English less than very well33.0% of residents speak other language at home 1,678 65.5% Speak English very well883 34.5% Speak English less than very well
White (Caucasian) - Speak only English Native:
74.3% (4,889)Foreign-born:
15.5% (262)
White (Caucasian) - Speak another language Native:
17.8% (1,172)Foreign-born:
83.7% (1,413)
Black or African American - Speak only English Native:
90.3% (981)Foreign-born:
49.2% (67)
Black or African American - Speak another language Native:
9.5% (103)Foreign-born:
51.2% (69)
Asian - Speak only English Native:
57.0% (256)Foreign-born:
17.5% (257)
Asian - Speak another language Native:
42.1% (189)Foreign-born:
81.7% (1,198)
Other race - Speak only English Native:
40.9% (784)Foreign-born:
4.2% (59)
Other race - Speak another language Native:
60.3% (1,156)Foreign-born:
97.1% (1,353)
Two or more races - Speak only English Native:
54.0% (1,074)Foreign-born:
3.7% (109)
Two or more races - Speak another language Native:
45.5% (906)Foreign-born:
96.4% (2,840)
White alone - Speak only English Native:
92.6% (4,514)Foreign-born:
25.4% (276)
White alone - Speak another language Native:
7.1% (346)Foreign-born:
74.3% (807)
Hispanic or Latino - Speak only English Native:
36.5% (1,947)Foreign-born:
1.5% (65)
Hispanic or Latino - Speak another language Native:
63.6% (3,395)Foreign-born:
99.0% (4,254)
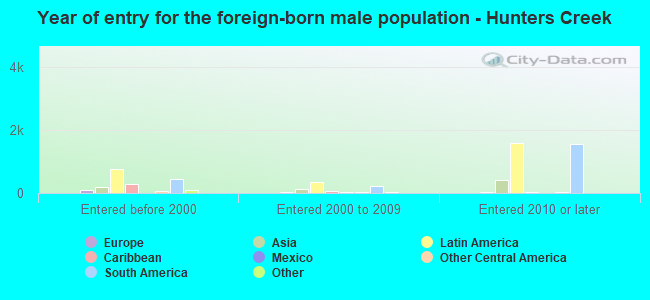
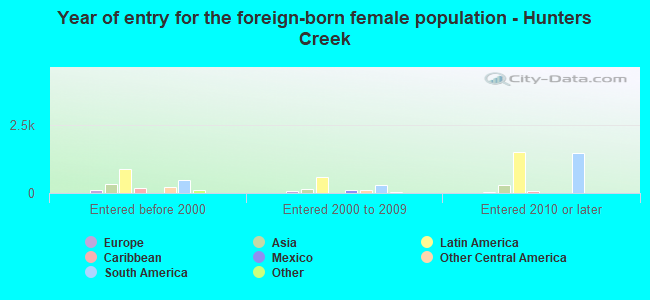
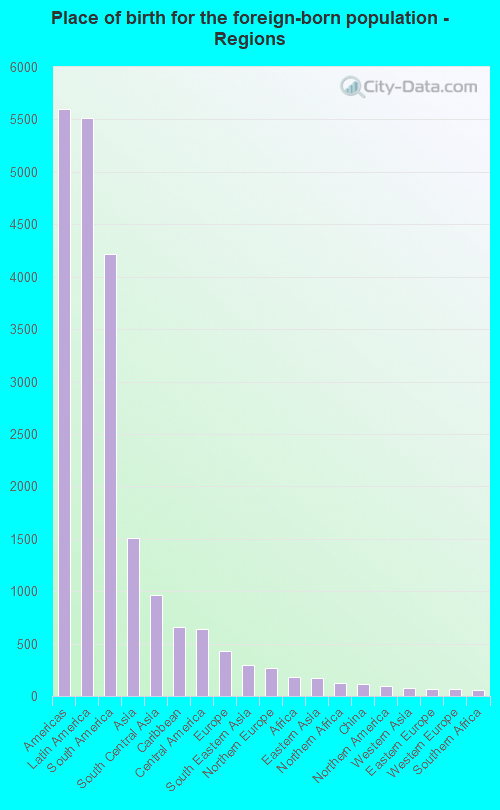
Foreign-born residents in Hunters Creek 7,720 residents are foreign born (26.3% Latin America , 7.2% Asia ).
This city:
38.1%Florida:
21.1%
Marital status for residents in Hunters Creek Marital status - White (Caucasian) population 15 years and over
Males 30.9% Never married60.5% Now married0.0% Separated2.1% Widowed6.5% DivorcedFemales 27.5% Never married52.4% Now married0.6% Separated6.2% Widowed13.3% DivorcedWomen who gave birth in the past 12 months Now married:
100.0% (31)Unmarried:
0.0% (0)
Women who did not give birth in the past 12 months Now married:
52.4% (1,211)Unmarried:
47.6% (1,100)
Marital status - Black or African American population 15 years and over
Males 24.1% Never married68.2% Now married0.0% Separated0.0% Widowed7.7% DivorcedFemales 37.3% Never married47.9% Now married0.0% Separated8.0% Widowed6.8% DivorcedWomen who did not give birth in the past 12 months Now married:
32.0% (104)Unmarried:
68.0% (221)
Marital status - Asian population 15 years and over
Males 26.6% Never married67.0% Now married0.0% Separated5.2% Widowed1.1% DivorcedFemales 16.4% Never married69.2% Now married0.0% Separated5.4% Widowed9.0% DivorcedWomen who gave birth in the past 12 months Now married:
100.0% (39)Unmarried:
0.0% (0)
Women who did not give birth in the past 12 months Now married:
75.5% (444)Unmarried:
24.5% (144)
Marital status - Other race population 15 years and over
Males 36.9% Never married44.8% Now married0.0% Separated9.9% Widowed8.4% DivorcedFemales 50.2% Never married38.1% Now married0.0% Separated0.0% Widowed11.7% DivorcedWomen who gave birth in the past 12 months Now married:
100.0% (50)Unmarried:
0.0% (0)
Women who did not give birth in the past 12 months Now married:
20.4% (224)Unmarried:
79.6% (872)
Marital status - Two or more races population 15 years and over
Males 45.0% Never married50.9% Now married0.8% Separated0.0% Widowed3.2% DivorcedFemales 33.2% Never married45.9% Now married0.0% Separated6.4% Widowed14.5% DivorcedWomen who gave birth in the past 12 months Now married:
100.0% (143)Unmarried:
0.0% (0)
Women who did not give birth in the past 12 months Now married:
46.9% (404)Unmarried:
53.1% (457)
Marital status - White alone, not Hispanic / Latino population 15 years and over
Males 32.4% Never married61.0% Now married0.0% Separated1.4% Widowed5.2% DivorcedFemales 25.2% Never married53.2% Now married0.0% Separated5.8% Widowed15.8% DivorcedWomen who did not give birth in the past 12 months Now married:
49.7% (661)Unmarried:
50.3% (670)
Marital status - Hispanic or Latino population 15 years and over
Males 37.8% Never married50.3% Now married0.4% Separated3.9% Widowed7.7% DivorcedFemales 35.9% Never married46.1% Now married0.8% Separated5.5% Widowed11.7% DivorcedWomen who gave birth in the past 12 months Now married:
100.0% (111)Unmarried:
0.0% (0)
Women who did not give birth in the past 12 months Now married:
43.4% (1,168)Unmarried:
56.6% (1,523)
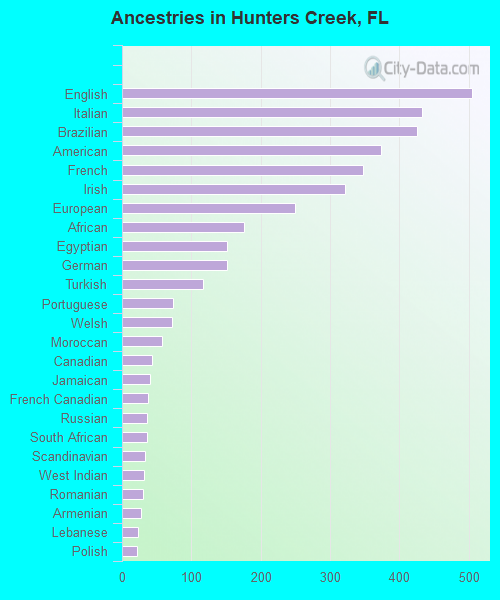
Ancestries in Hunters Creek
504 4.2% English433 3.6% Italian425 3.5% Brazilian373 3.1% American348 2.9% French322 2.7% Irish250 2.1% European176 1.5% African152 1.3% Egyptian152 1.3% German117 1.0% Turkish73 0.6% Portuguese72 0.6% Welsh57 0.5% Moroccan43 0.4% Canadian40 0.3% Jamaican38 0.3% French Canadian36 0.3% Russian36 0.3% South African33 0.3% Scandinavian32 0.3% West Indian31 0.3% Romanian27 0.2% Armenian23 0.2% Lebanese22 0.2% Polish20 0.2% British20 0.2% Lithuanian19 0.2% Icelander17 0.1% Syrian17 0.1% Croatian17 0.1% Eastern European17 0.1% Norwegian16 0.1% Haitian12 0.10% Scotch-Irish12 0.10% Scottish10 0.08% Austrian
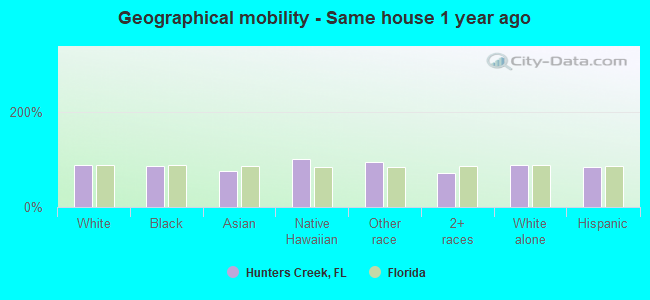
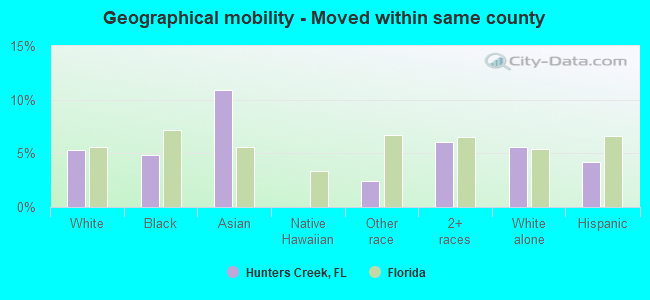
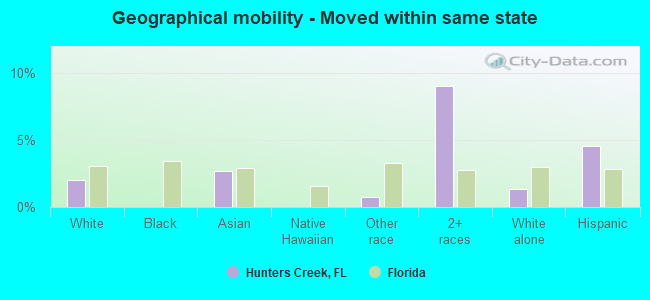
Geographical mobility in Hunters Creek Same house 1 year ago 7,831 87.4% White (Caucasian)1,115 84.6% Black or African American1,564 75.5% Asian14 100.0% Native Hawaiian / Pacific Islander3,149 94.1% Other race3,567 72.0% Two or more races5,414 88.4% White alone, not Hispanic / Latino8,331 84.4% Hispanic or LatinoMoved within same county 479 5.3% White / Caucasian63 4.8% Black or African American226 10.9% Asian80 2.4% Other race300 6.1% Two or more races344 5.6% White alone, not Hispanic / Latino410 4.1% Hispanic or LatinoMoved within same state 179 2.0% White / Caucasian56 2.7% Asian24 0.7% Other race446 9.0% Two or more races82 1.3% White alone, not Hispanic / Latino449 4.6% Hispanic or LatinoMoved from different state 329 3.7% White / Caucasian118 9.0% Black or African American132 6.4% Asian331 6.7% Two or more races302 4.9% White alone, not Hispanic / Latino501 5.1% Hispanic or LatinoMoved from abroad 125 1.4% White56 2.7% Asian52 1.5% Other race284 5.7% Two or more races297 3.0% Hispanic or Latino
Children Nativity (place of birth) in Hunters Creek
Children under 6 years - Living with two parents Both parents native 177 100.0% NativeBoth parents foreign-born 181 79.9% Native46 20.1% Foreign-bornOne native, one foreign-born parent 301 100.0% NativeChildren under 6 years - Living with one parent Native parent 116 98.0% Native2 2.0% Foreign-bornForeign-born parent 98 55.7% Native78 44.3% Foreign-bornChildren 6 to 17 years - Living with two parents Both parents native 1,006 100.0% Native0 0.0% Foreign-bornBoth parents foreign-born 777 64.9% Native419 35.1% Foreign-bornOne native, one foreign-born parent 242 93.9% Native16 6.1% Foreign-bornChildren 6 to 17 years - Living with one parent Native parent 136 100.0% NativeForeign-born parent 352 53.3% Native309 46.7% Foreign-born
Grandparents responsible for own grandchildren in Hunters Creek
Grandparents (30 to 59 years) White / Caucasian 32 100.0% Not responsible for grandchildrenHispanic or Latino 62 100.0% Not responsible for grandchildren
Grandparents (60 years and over) White / Caucasian 37 100.0% Not responsible for grandchildrenHispanic or Latino 153 100.0% Not responsible for grandchildren