Races in Holly Hill, Florida (FL) Detailed Stats
Data:
Races - White alone (%)
Races - White alone (% change since 2000)
Races - Black alone (%)
Races - Black alone (% change since 2000)
Races - American Indian alone (%)
Races - American Indian alone (% change since 2000)
Races - Asian alone (%)
Races - Asian alone (% change since 2000)
Races - Hispanic (%)
Races - Hispanic (% change since 2000)
Races - Native Hawaiian and Other Pacific Islander alone (%)
Races - Native Hawaiian and Other Pacific Islander alone (% change since 2000)
Races - Two or more races(%)
Races - Two or more races(% change since 2000)
Races - Other race alone (%)
Races - Other race alone (% change since 2000)
Racial diversity
Place of birth - Born in state of residence (%)
Place of birth - Born in state of residence (%) - White
Place of birth - Born in state of residence (%) - Black or African American
Place of birth - Born in state of residence (%) - Asian
Place of birth - Born in state of residence (%) - Hispanic or Latino
Place of birth - Born in state of residence (%) - American Indian and Alaska Native
Place of birth - Born in state of residence (%) - Multirace
Place of birth - Born in state of residence (%) - Other Race
Place of birth - Born in other state (%)
Place of birth - Born in other state (%) - White
Place of birth - Born in other state (%) - Black or African American
Place of birth - Born in other state (%) - Asian
Place of birth - Born in other state (%) - Hispanic or Latino
Place of birth - Born in other state (%) - American Indian and Alaska Native
Place of birth - Born in other state (%) - Multirace
Place of birth - Born in other state (%) - Other Race
Place of birth - Native, outside of US (%)
Place of birth - Native, outside of US (%) - White
Place of birth - Native, outside of US (%) - Black or African American
Place of birth - Native, outside of US (%) - Asian
Place of birth - Native, outside of US (%) - Hispanic or Latino
Place of birth - Native, outside of US (%) - American Indian and Alaska Native
Place of birth - Native, outside of US (%) - Multirace
Place of birth - Native, outside of US (%) - Other Race
Place of birth - Foreign born (%)
Place of birth - Foreign born (%) - White
Place of birth - Foreign born (%) - Black or African American
Place of birth - Foreign born (%) - Asian
Place of birth - Foreign born (%) - Hispanic or Latino
Place of birth - Foreign born (%) - American Indian and Alaska Native
Place of birth - Foreign born (%) - Multirace
Place of birth - Foreign born (%) - Other Race
Residents speaking English at home (%)
Residents speaking English at home - Born in the United States (%)
Residents speaking English at home - Native, born elsewhere (%)
Residents speaking English at home - Foreign born (%)
Residents speaking Spanish at home (%)
Residents speaking Spanish at home - Born in the United States (%)
Residents speaking Spanish at home - Native, born elsewhere (%)
Residents speaking Spanish at home - Foreign born (%)
Residents speaking other language at home (%)
Residents speaking other language at home - Born in the United States (%)
Residents speaking other language at home - Native, born elsewhere (%)
Residents speaking other language at home - Foreign born (%)
Marital status - Never married (%)
Marital status - Now married (%)
Marital status - Separated (%)
Marital status - Widowed (%)
Marital status - Divorced (%)
Ancestries Reported - Arab (%)
Ancestries Reported - Czech (%)
Ancestries Reported - Danish (%)
Ancestries Reported - Dutch (%)
Ancestries Reported - English (%)
Ancestries Reported - French (%)
Ancestries Reported - French Canadian (%)
Ancestries Reported - German (%)
Ancestries Reported - Greek (%)
Ancestries Reported - Hungarian (%)
Ancestries Reported - Irish (%)
Ancestries Reported - Italian (%)
Ancestries Reported - Lithuanian (%)
Ancestries Reported - Norwegian (%)
Ancestries Reported - Polish (%)
Ancestries Reported - Portuguese (%)
Ancestries Reported - Russian (%)
Ancestries Reported - Scotch-Irish (%)
Ancestries Reported - Scottish (%)
Ancestries Reported - Slovak (%)
Ancestries Reported - Subsaharan African (%)
Ancestries Reported - Swedish (%)
Ancestries Reported - Swiss (%)
Ancestries Reported - Ukrainian (%)
Ancestries Reported - United States (%)
Ancestries Reported - Welsh (%)
Ancestries Reported - West Indian (%)
Ancestries Reported - Other (%)
Geographical mobility - Same house 1 year ago (%)
Geographical mobility - Same house 1 year ago (%) - White
Geographical mobility - Same house 1 year ago (%) - Black or African American
Geographical mobility - Same house 1 year ago (%) - Asian
Geographical mobility - Same house 1 year ago (%) - Hispanic or Latino
Geographical mobility - Same house 1 year ago (%) - American Indian and Alaska Native
Geographical mobility - Same house 1 year ago (%) - Multirace
Geographical mobility - Same house 1 year ago (%) - Other Race
Geographical mobility - Moved within same county (%)
Geographical mobility - Moved within same county (%) - White
Geographical mobility - Moved within same county (%) - Black or African American
Geographical mobility - Moved within same county (%) - Asian
Geographical mobility - Moved within same county (%) - Hispanic or Latino
Geographical mobility - Moved within same county (%) - American Indian and Alaska Native
Geographical mobility - Moved within same county (%) - Multirace
Geographical mobility - Moved within same county (%) - Other Race
Geographical mobility - Moved from different county within same state (%)
Geographical mobility - Moved from different county within same state (%) - White
Geographical mobility - Moved from different county within same state (%) - Black or African American
Geographical mobility - Moved from different county within same state (%) - Asian
Geographical mobility - Moved from different county within same state (%) - Hispanic or Latino
Geographical mobility - Moved from different county within same state (%) - American Indian and Alaska Native
Geographical mobility - Moved from different county within same state (%) - Multirace
Geographical mobility - Moved from different county within same state (%) - Other Race
Geographical mobility - Moved from different state (%)
Geographical mobility - Moved from different state (%) - White
Geographical mobility - Moved from different state (%) - Black or African American
Geographical mobility - Moved from different state (%) - Asian
Geographical mobility - Moved from different state (%) - Hispanic or Latino
Geographical mobility - Moved from different state (%) - American Indian and Alaska Native
Geographical mobility - Moved from different state (%) - Multirace
Geographical mobility - Moved from different state (%) - Other Race
Geographical mobility - Moved from abroad (%)
Geographical mobility - Moved from abroad (%) - White
Geographical mobility - Moved from abroad (%) - Black or African American
Geographical mobility - Moved from abroad (%) - Asian
Geographical mobility - Moved from abroad (%) - Hispanic or Latino
Geographical mobility - Moved from abroad (%) - American Indian and Alaska Native
Geographical mobility - Moved from abroad (%) - Multirace
Geographical mobility - Moved from abroad (%) - Other Race
Place of birth for the foreign-born population - Ireland (%)
Place of birth for the foreign-born population - Denmark (%)
Place of birth for the foreign-born population - Norway (%)
Place of birth for the foreign-born population - Sweden (%)
Place of birth for the foreign-born population - United Kingdom (%)
Place of birth for the foreign-born population - England (%)
Place of birth for the foreign-born population - Scotland (%)
Place of birth for the foreign-born population - Other Northern Europe (%)
Place of birth for the foreign-born population - Austria (%)
Place of birth for the foreign-born population - Belgium (%)
Place of birth for the foreign-born population - France (%)
Place of birth for the foreign-born population - Germany (%)
Place of birth for the foreign-born population - Netherlands (%)
Place of birth for the foreign-born population - Switzerland (%)
Place of birth for the foreign-born population - Other Western Europe (%)
Place of birth for the foreign-born population - Greece (%)
Place of birth for the foreign-born population - Italy (%)
Place of birth for the foreign-born population - Portugal (%)
Place of birth for the foreign-born population - Spain (%)
Place of birth for the foreign-born population - Other Southern Europe (%)
Place of birth for the foreign-born population - Albania (%)
Place of birth for the foreign-born population - Belarus (%)
Place of birth for the foreign-born population - Bosnia and Herzegovina (%)
Place of birth for the foreign-born population - Bulgaria (%)
Place of birth for the foreign-born population - Croatia (%)
Place of birth for the foreign-born population - Czechoslovakia (%)
Place of birth for the foreign-born population - Hungary (%)
Place of birth for the foreign-born population - Latvia (%)
Place of birth for the foreign-born population - Lithuania (%)
Place of birth for the foreign-born population - North Macedonia (Macedonia) (%)
Place of birth for the foreign-born population - Moldova (%)
Place of birth for the foreign-born population - Poland (%)
Place of birth for the foreign-born population - Romania (%)
Place of birth for the foreign-born population - Russia (%)
Place of birth for the foreign-born population - Serbia (%)
Place of birth for the foreign-born population - Ukraine (%)
Place of birth for the foreign-born population - Other Eastern Europe (%)
Place of birth for the foreign-born population - China (%)
Place of birth for the foreign-born population - Hong Kong (%)
Place of birth for the foreign-born population - Taiwan (%)
Place of birth for the foreign-born population - Japan (%)
Place of birth for the foreign-born population - Korea (%)
Place of birth for the foreign-born population - Other Eastern Asia (%)
Place of birth for the foreign-born population - Afghanistan (%)
Place of birth for the foreign-born population - Bangladesh (%)
Place of birth for the foreign-born population - India (%)
Place of birth for the foreign-born population - Iran (%)
Place of birth for the foreign-born population - Kazakhstan (%)
Place of birth for the foreign-born population - Nepal (%)
Place of birth for the foreign-born population - Pakistan (%)
Place of birth for the foreign-born population - Sri Lanka (%)
Place of birth for the foreign-born population - Uzbekistan (%)
Place of birth for the foreign-born population - Other South Central Asia (%)
Place of birth for the foreign-born population - Burma (%)
Place of birth for the foreign-born population - Cambodia (%)
Place of birth for the foreign-born population - Indonesia (%)
Place of birth for the foreign-born population - Laos (%)
Place of birth for the foreign-born population - Malaysia (%)
Place of birth for the foreign-born population - Philippines (%)
Place of birth for the foreign-born population - Singapore (%)
Place of birth for the foreign-born population - Thailand (%)
Place of birth for the foreign-born population - Vietnam (%)
Place of birth for the foreign-born population - Other South Eastern Asia (%)
Place of birth for the foreign-born population - Armenia (%)
Place of birth for the foreign-born population - Iraq (%)
Place of birth for the foreign-born population - Israel (%)
Place of birth for the foreign-born population - Jordan (%)
Place of birth for the foreign-born population - Kuwait (%)
Place of birth for the foreign-born population - Lebanon (%)
Place of birth for the foreign-born population - Saudi Arabia (%)
Place of birth for the foreign-born population - Syria (%)
Place of birth for the foreign-born population - Turkey (%)
Place of birth for the foreign-born population - Yemen (%)
Place of birth for the foreign-born population - Other Western Asia (%)
Place of birth for the foreign-born population - Eritrea (%)
Place of birth for the foreign-born population - Ethiopia (%)
Place of birth for the foreign-born population - Kenya (%)
Place of birth for the foreign-born population - Somalia (%)
Place of birth for the foreign-born population - Uganda (%)
Place of birth for the foreign-born population - Zimbabwe (%)
Place of birth for the foreign-born population - Other Eastern Africa (%)
Place of birth for the foreign-born population - Cameroon (%)
Place of birth for the foreign-born population - Congo (%)
Place of birth for the foreign-born population - Democratic Republic of Congo (Zaire) (%)
Place of birth for the foreign-born population - Other Middle Africa (%)
Place of birth for the foreign-born population - Egypt (%)
Place of birth for the foreign-born population - Morocco (%)
Place of birth for the foreign-born population - Sudan (%)
Place of birth for the foreign-born population - Other Northern Africa (%)
Place of birth for the foreign-born population - South Africa (%)
Place of birth for the foreign-born population - Other Southern Africa (%)
Place of birth for the foreign-born population - Cabo Verde (%)
Place of birth for the foreign-born population - Ghana (%)
Place of birth for the foreign-born population - Liberia (%)
Place of birth for the foreign-born population - Nigeria (%)
Place of birth for the foreign-born population - Senegal (%)
Place of birth for the foreign-born population - Sierra Leone (%)
Place of birth for the foreign-born population - Other Western Africa (%)
Place of birth for the foreign-born population - Australia (%)
Place of birth for the foreign-born population - New Zealand (%)
Place of birth for the foreign-born population - Fiji (%)
Place of birth for the foreign-born population - Micronesia (%)
Place of birth for the foreign-born population - Bahamas (%)
Place of birth for the foreign-born population - Barbados (%)
Place of birth for the foreign-born population - Cuba (%)
Place of birth for the foreign-born population - Dominica (%)
Place of birth for the foreign-born population - Dominican Republic (%)
Place of birth for the foreign-born population - Grenada (%)
Place of birth for the foreign-born population - Haiti (%)
Place of birth for the foreign-born population - Jamaica (%)
Place of birth for the foreign-born population - St. Vincent and the Grenadines (%)
Place of birth for the foreign-born population - Trinidad and Tobago (%)
Place of birth for the foreign-born population - West Indies (%)
Place of birth for the foreign-born population - Other Caribbean (%)
Place of birth for the foreign-born population - Belize (%)
Place of birth for the foreign-born population - Costa Rica (%)
Place of birth for the foreign-born population - El Salvador (%)
Place of birth for the foreign-born population - Guatemala (%)
Place of birth for the foreign-born population - Honduras (%)
Place of birth for the foreign-born population - Mexico (%)
Place of birth for the foreign-born population - Nicaragua (%)
Place of birth for the foreign-born population - Panama (%)
Place of birth for the foreign-born population - Other Central America (%)
Place of birth for the foreign-born population - Argentina (%)
Place of birth for the foreign-born population - Bolivia (%)
Place of birth for the foreign-born population - Brazil (%)
Place of birth for the foreign-born population - Chile (%)
Place of birth for the foreign-born population - Colombia (%)
Place of birth for the foreign-born population - Ecuador (%)
Place of birth for the foreign-born population - Guyana (%)
Place of birth for the foreign-born population - Peru (%)
Place of birth for the foreign-born population - Uruguay (%)
Place of birth for the foreign-born population - Venezuela (%)
Place of birth for the foreign-born population - Other South America (%)
Place of birth for the foreign-born population - Canada (%)
Place of birth for the foreign-born population - Other Northern America (%)
Place of birth for the foreign-born population - Other (%)
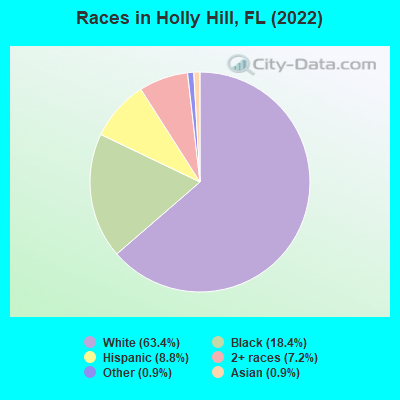
According to 2022 data, the most numerous races in Holly Hill, FL are White alone (8,493 residents), Hispanic (1,183 residents), and Black alone (2,471 residents). 89.2% of Holly Hill residents speak English at home. 5.7% of Holly Hill, FL residents are foreign-born (2.8% born in Latin America, 1.5% born in Europe, 0.8% born in Asia), which is 265.8% less than the foreign-born rate of 21.0% across the entire state of Florida.
Race distribution in Holly Hill
2000 2022
10,458,509 65.4% White alone 2,682,715 16.8% Hispanic 2,264,268 14.2% Black alone 261,693 1.6% Asian alone 236,954 1.5% Two or more races 42,358 0.3% American Indian alone 28,994 0.2% Other race alone 6,887 0.04% Native Hawaiian and Other
11,309,403 50.8% White alone 6,025,039 27.1% Hispanic 3,241,015 14.6% Black alone 861,630 3.9% Two or more races 623,692 2.8% Asian alone 152,054 0.7% Other race alone 22,504 0.1% American Indian alone 9,486 0.04% Native Hawaiian and Other
Income and house value in Holly Hill Median household income in 2022 $42,504 White non-Hispanic householders$39,184 Black householders$72,484 Some other race householders$31,605 Two or more races householders$59,679 Hispanic or Latino race householdersMedian 2022 house value $201,594 White Non-Hispanic householders$192,614 Black or African American householders$203,143 American Indian or Alaska Native householders $253,928 Asian householders$265,076 Two or more races householders$206,859 Hispanic or Latino householders
Median age by race in Holly Hill
55.1 Median age for White residents56.7 53.1 37.5 Median age for Black or African American residents34.1 39.3 -495,279,592.8 Median age for American Indian / Alaska Native residents-455,981,940.9 -459,143,968.4 15.5 Median age for Asian residents14.4 17.4 -668,922,729.2 Median age for Native Hawaiian / Pacific Islander residents-668,922,729.2 -443,298,968.6 34.9 Median age for Other race residents36.1 12.0 26.7 Median age for Two or more races residents30.1 30.4 55.4 Median age for White alone residents56.0 54.9 35.5 Median age for Hispanic or Latino residents35.4 34.1
Owner/renter occupied households by race in Holly Hill
House owners and renters - White residents 2,742 62.7% Owner occupied1,633 37.3% Renter occupiedHouse owners and renters - Black or African American residents 219 19.2% Owner occupied917 80.8% Renter occupiedHouse owners and renters - American Indian / Alaska Native residents 3 22.7% Owner occupied11 77.3% Renter occupiedHouse owners and renters - Asian residents 24 100.0% Owner occupiedHouse owners and renters - Other race residents 68 49.7% Owner occupied69 50.3% Renter occupiedHouse owners and renters - Two or more races residents 183 48.8% Owner occupied192 51.2% Renter occupiedHouse owners and renters - White alone residents 2,769 62.9% Owner occupied1,633 37.1% Renter occupiedHouse owners and renters - Hispanic or Latino residents 168 45.2% Owner occupied203 54.8% Renter occupied
Language usage in Holly Hill
English speakers - Total 89.2% of residents of Holly Hill speak English at home.
6.0% of residents speak Spanish at home 564 74.1% Speak English very well197 25.9% Speak English less than very well4.9% of residents speak other language at home 431 69.1% Speak English very well193 30.9% Speak English less than very well
English speakers - Born in the United States 94.6% of residents of Holly Hill speak English at home.
2.9% of residents speak Spanish at home 183 94.8% Speak English very well10 5.2% Speak English less than very well2.2% of residents speak other language at home 112 76.2% Speak English very well35 23.8% Speak English less than very well
English speakers - Native, born elsewhere 38.0% of residents of Holly Hill speak English at home.
45.0% of residents speak Spanish at home 54 60.0% Speak English very well36 40.0% Speak English less than very well17.0% of residents speak other language at home 5 14.7% Speak English very well29 85.3% Speak English less than very well
English speakers - Foreign-born 24.7% of residents of Holly Hill speak English at home.
34.3% of residents speak Spanish at home 112 45.9% Speak English very well132 54.1% Speak English less than very well40.9% of residents speak other language at home 164 56.4% Speak English very well127 43.6% Speak English less than very well
White (Caucasian) - Speak only English Native:
98.5% (7,812)Foreign-born:
27.0% (92)
White (Caucasian) - Speak another language Native:
2.2% (171)Foreign-born:
62.7% (214)
Black or African American - Speak only English Native:
91.1% (2,041)Foreign-born:
63.5% (72)
Black or African American - Speak another language Native:
10.4% (234)Foreign-born:
35.0% (40)
Asian - Speak only English Native:
32.6% (24)Foreign-born:
11.0% (5)
Asian - Speak another language Native:
76.2% (57)Foreign-born:
90.7% (43)
Other race - Speak another language Native:
36.3% (172)Foreign-born:
98.8% (114)
Two or more races - Speak another language Native:
22.1% (295)Foreign-born:
100.0% (57)
White alone - Speak only English Native:
97.0% (7,740)Foreign-born:
32.3% (96)
White alone - Speak another language Native:
3.0% (238)Foreign-born:
58.6% (174)
Hispanic or Latino - Speak another language Native:
52.8% (409)Foreign-born:
99.4% (250)
Foreign-born residents in Holly Hill 769 residents are foreign born (2.8% Latin America , 1.5% Europe , 0.8% Asia ).
This city:
5.7%Florida:
21.1%
Marital status for residents in Holly Hill Marital status - White (Caucasian) population 15 years and over
Males 33.0% Never married34.1% Now married2.3% Separated6.6% Widowed24.1% DivorcedFemales 27.5% Never married34.3% Now married1.9% Separated11.6% Widowed24.8% DivorcedWomen who gave birth in the past 12 months Now married:
100.0% (13)Unmarried:
0.0% (0)
Women who did not give birth in the past 12 months Now married:
30.1% (484)Unmarried:
69.9% (1,124)
Marital status - Black or African American population 15 years and over
Males 52.3% Never married24.8% Now married0.6% Separated2.3% Widowed20.0% DivorcedFemales 42.0% Never married21.0% Now married9.4% Separated5.2% Widowed22.4% DivorcedWomen who gave birth in the past 12 months Now married:
0.0% (0)Unmarried:
100.0% (25)
Women who did not give birth in the past 12 months Now married:
23.7% (140)Unmarried:
76.3% (449)
Marital status - American Indian / Alaska Native population 15 years and over
Males 0.0% Never married100.0% Now married0.0% Separated0.0% Widowed0.0% DivorcedFemales 0.0% Never married100.0% Now married0.0% Separated0.0% Widowed0.0% DivorcedMarital status - Asian population 15 years and over
Males 100.0% Never married0.0% Now married0.0% Separated0.0% Widowed0.0% DivorcedFemales 32.3% Never married22.6% Now married0.0% Separated19.4% Widowed25.8% DivorcedWomen who did not give birth in the past 12 months Now married:
28.0% (7)Unmarried:
72.0% (19)
Marital status - Other race population 15 years and over
Males 78.3% Never married18.3% Now married0.0% Separated0.0% Widowed3.5% DivorcedFemales 0.0% Never married29.3% Now married0.0% Separated8.6% Widowed62.1% DivorcedWomen who did not give birth in the past 12 months Now married:
32.1% (26)Unmarried:
67.9% (54)
Marital status - Two or more races population 15 years and over
Males 40.2% Never married29.3% Now married3.2% Separated3.6% Widowed23.7% DivorcedFemales 41.9% Never married31.2% Now married11.0% Separated4.0% Widowed11.9% DivorcedWomen who did not give birth in the past 12 months Now married:
47.2% (178)Unmarried:
52.8% (199)
Marital status - White alone, not Hispanic / Latino population 15 years and over
Males 33.0% Never married34.1% Now married2.4% Separated6.6% Widowed23.9% DivorcedFemales 26.5% Never married34.6% Now married1.9% Separated11.8% Widowed25.2% DivorcedWomen who gave birth in the past 12 months Now married:
100.0% (13)Unmarried:
0.0% (0)
Women who did not give birth in the past 12 months Now married:
30.2% (494)Unmarried:
69.8% (1,141)
Marital status - Hispanic or Latino population 15 years and over
Males 48.2% Never married30.2% Now married0.0% Separated1.1% Widowed20.4% DivorcedFemales 35.9% Never married31.5% Now married12.0% Separated3.5% Widowed17.1% DivorcedWomen who gave birth in the past 12 months Now married:
0.0% (0)Unmarried:
100.0% (27)
Women who did not give birth in the past 12 months Now married:
56.5% (180)Unmarried:
43.5% (139)
Ancestries in Holly Hill
545 11.4% Irish476 10.0% English364 7.6% American341 7.1% Italian253 5.3% German162 3.4% Polish86 1.8% French70 1.5% Jamaican64 1.3% Scotch-Irish52 1.1% European50 1.0% Danish48 1.0% Latvian46 1.0% Ukrainian45 0.9% African40 0.8% Russian36 0.8% Iranian31 0.6% Scottish26 0.5% Slavic25 0.5% Czech22 0.5% Hungarian19 0.4% Dutch17 0.4% Scandinavian16 0.3% Lebanese15 0.3% Welsh13 0.3% Brazilian12 0.3% Eastern European12 0.3% Haitian10 0.2% British9 0.2% Slovene8 0.2% French Canadian8 0.2% Romanian8 0.2% Serbian8 0.2% Slovak8 0.2% Swedish7 0.1% Czechoslovakian6 0.1% Finnish
Geographical mobility in Holly Hill Same house 1 year ago 7,064 82.7% White (Caucasian)2,423 96.3% Black or African American24 100.0% American Indian / Alaska Native134 100.0% Asian576 97.2% Other race1,228 83.3% Two or more races6,930 81.6% White alone, not Hispanic / Latino1,087 95.8% Hispanic or LatinoMoved within same county 621 7.3% White / Caucasian59 2.4% Black or African American60 4.1% Two or more races656 7.7% White alone, not Hispanic / Latino22 1.9% Hispanic or LatinoMoved within same state 297 3.5% White / Caucasian39 1.5% Black or African American10 1.7% Other race327 3.9% White alone, not Hispanic / Latino9 0.8% Hispanic or LatinoMoved from different state 538 6.3% White / Caucasian80 3.2% Black or African American299 20.3% Two or more races567 6.7% White alone, not Hispanic / Latino38 3.3% Hispanic or LatinoMoved from abroad 21 0.2% White27 0.3% White alone, not Hispanic / Latino3 0.3% Hispanic or Latino
Children Nativity (place of birth) in Holly Hill
Children under 6 years - Living with two parents Both parents native 65 100.0% NativeOne native, one foreign-born parent 14 100.0% NativeChildren under 6 years - Living with one parent Native parent 601 100.0% NativeChildren 6 to 17 years - Living with two parents Both parents native 337 100.0% NativeBoth parents foreign-born 48 100.0% NativeOne native, one foreign-born parent 47 100.0% NativeChildren 6 to 17 years - Living with one parent Native parent 1,235 100.0% NativeForeign-born parent 99 52.5% Native90 47.5% Foreign-born
Grandparents responsible for own grandchildren in Holly Hill
Grandparents (30 to 59 years) White / Caucasian 30 45.7% Responsible for grandchildren36 54.3% Not responsible for grandchildrenBlack or African American 6 100.0% Not responsible for grandchildrenWhite alone, not Hispanic / Latino 31 44.1% Responsible for grandchildren39 55.9% Not responsible for grandchildrenGrandparents (60 years and over) White / Caucasian 6 9.7% Responsible for grandchildren56 90.3% Not responsible for grandchildrenBlack or African American 27 100.0% Not responsible for grandchildrenWhite alone, not Hispanic / Latino 6 9.9% Responsible for grandchildren55 90.1% Not responsible for grandchildren