Races in Holiday, Florida (FL) Detailed Stats
Data:
Races - White alone (%)
Races - White alone (% change since 2000)
Races - Black alone (%)
Races - Black alone (% change since 2000)
Races - American Indian alone (%)
Races - American Indian alone (% change since 2000)
Races - Asian alone (%)
Races - Asian alone (% change since 2000)
Races - Hispanic (%)
Races - Hispanic (% change since 2000)
Races - Native Hawaiian and Other Pacific Islander alone (%)
Races - Native Hawaiian and Other Pacific Islander alone (% change since 2000)
Races - Two or more races(%)
Races - Two or more races(% change since 2000)
Races - Other race alone (%)
Races - Other race alone (% change since 2000)
Racial diversity
Place of birth - Born in state of residence (%)
Place of birth - Born in state of residence (%) - White
Place of birth - Born in state of residence (%) - Black or African American
Place of birth - Born in state of residence (%) - Asian
Place of birth - Born in state of residence (%) - Hispanic or Latino
Place of birth - Born in state of residence (%) - American Indian and Alaska Native
Place of birth - Born in state of residence (%) - Multirace
Place of birth - Born in state of residence (%) - Other Race
Place of birth - Born in other state (%)
Place of birth - Born in other state (%) - White
Place of birth - Born in other state (%) - Black or African American
Place of birth - Born in other state (%) - Asian
Place of birth - Born in other state (%) - Hispanic or Latino
Place of birth - Born in other state (%) - American Indian and Alaska Native
Place of birth - Born in other state (%) - Multirace
Place of birth - Born in other state (%) - Other Race
Place of birth - Native, outside of US (%)
Place of birth - Native, outside of US (%) - White
Place of birth - Native, outside of US (%) - Black or African American
Place of birth - Native, outside of US (%) - Asian
Place of birth - Native, outside of US (%) - Hispanic or Latino
Place of birth - Native, outside of US (%) - American Indian and Alaska Native
Place of birth - Native, outside of US (%) - Multirace
Place of birth - Native, outside of US (%) - Other Race
Place of birth - Foreign born (%)
Place of birth - Foreign born (%) - White
Place of birth - Foreign born (%) - Black or African American
Place of birth - Foreign born (%) - Asian
Place of birth - Foreign born (%) - Hispanic or Latino
Place of birth - Foreign born (%) - American Indian and Alaska Native
Place of birth - Foreign born (%) - Multirace
Place of birth - Foreign born (%) - Other Race
Residents speaking English at home (%)
Residents speaking English at home - Born in the United States (%)
Residents speaking English at home - Native, born elsewhere (%)
Residents speaking English at home - Foreign born (%)
Residents speaking Spanish at home (%)
Residents speaking Spanish at home - Born in the United States (%)
Residents speaking Spanish at home - Native, born elsewhere (%)
Residents speaking Spanish at home - Foreign born (%)
Residents speaking other language at home (%)
Residents speaking other language at home - Born in the United States (%)
Residents speaking other language at home - Native, born elsewhere (%)
Residents speaking other language at home - Foreign born (%)
Marital status - Never married (%)
Marital status - Now married (%)
Marital status - Separated (%)
Marital status - Widowed (%)
Marital status - Divorced (%)
Ancestries Reported - Arab (%)
Ancestries Reported - Czech (%)
Ancestries Reported - Danish (%)
Ancestries Reported - Dutch (%)
Ancestries Reported - English (%)
Ancestries Reported - French (%)
Ancestries Reported - French Canadian (%)
Ancestries Reported - German (%)
Ancestries Reported - Greek (%)
Ancestries Reported - Hungarian (%)
Ancestries Reported - Irish (%)
Ancestries Reported - Italian (%)
Ancestries Reported - Lithuanian (%)
Ancestries Reported - Norwegian (%)
Ancestries Reported - Polish (%)
Ancestries Reported - Portuguese (%)
Ancestries Reported - Russian (%)
Ancestries Reported - Scotch-Irish (%)
Ancestries Reported - Scottish (%)
Ancestries Reported - Slovak (%)
Ancestries Reported - Subsaharan African (%)
Ancestries Reported - Swedish (%)
Ancestries Reported - Swiss (%)
Ancestries Reported - Ukrainian (%)
Ancestries Reported - United States (%)
Ancestries Reported - Welsh (%)
Ancestries Reported - West Indian (%)
Ancestries Reported - Other (%)
Geographical mobility - Same house 1 year ago (%)
Geographical mobility - Same house 1 year ago (%) - White
Geographical mobility - Same house 1 year ago (%) - Black or African American
Geographical mobility - Same house 1 year ago (%) - Asian
Geographical mobility - Same house 1 year ago (%) - Hispanic or Latino
Geographical mobility - Same house 1 year ago (%) - American Indian and Alaska Native
Geographical mobility - Same house 1 year ago (%) - Multirace
Geographical mobility - Same house 1 year ago (%) - Other Race
Geographical mobility - Moved within same county (%)
Geographical mobility - Moved within same county (%) - White
Geographical mobility - Moved within same county (%) - Black or African American
Geographical mobility - Moved within same county (%) - Asian
Geographical mobility - Moved within same county (%) - Hispanic or Latino
Geographical mobility - Moved within same county (%) - American Indian and Alaska Native
Geographical mobility - Moved within same county (%) - Multirace
Geographical mobility - Moved within same county (%) - Other Race
Geographical mobility - Moved from different county within same state (%)
Geographical mobility - Moved from different county within same state (%) - White
Geographical mobility - Moved from different county within same state (%) - Black or African American
Geographical mobility - Moved from different county within same state (%) - Asian
Geographical mobility - Moved from different county within same state (%) - Hispanic or Latino
Geographical mobility - Moved from different county within same state (%) - American Indian and Alaska Native
Geographical mobility - Moved from different county within same state (%) - Multirace
Geographical mobility - Moved from different county within same state (%) - Other Race
Geographical mobility - Moved from different state (%)
Geographical mobility - Moved from different state (%) - White
Geographical mobility - Moved from different state (%) - Black or African American
Geographical mobility - Moved from different state (%) - Asian
Geographical mobility - Moved from different state (%) - Hispanic or Latino
Geographical mobility - Moved from different state (%) - American Indian and Alaska Native
Geographical mobility - Moved from different state (%) - Multirace
Geographical mobility - Moved from different state (%) - Other Race
Geographical mobility - Moved from abroad (%)
Geographical mobility - Moved from abroad (%) - White
Geographical mobility - Moved from abroad (%) - Black or African American
Geographical mobility - Moved from abroad (%) - Asian
Geographical mobility - Moved from abroad (%) - Hispanic or Latino
Geographical mobility - Moved from abroad (%) - American Indian and Alaska Native
Geographical mobility - Moved from abroad (%) - Multirace
Geographical mobility - Moved from abroad (%) - Other Race
Place of birth for the foreign-born population - Ireland (%)
Place of birth for the foreign-born population - Denmark (%)
Place of birth for the foreign-born population - Norway (%)
Place of birth for the foreign-born population - Sweden (%)
Place of birth for the foreign-born population - United Kingdom (%)
Place of birth for the foreign-born population - England (%)
Place of birth for the foreign-born population - Scotland (%)
Place of birth for the foreign-born population - Other Northern Europe (%)
Place of birth for the foreign-born population - Austria (%)
Place of birth for the foreign-born population - Belgium (%)
Place of birth for the foreign-born population - France (%)
Place of birth for the foreign-born population - Germany (%)
Place of birth for the foreign-born population - Netherlands (%)
Place of birth for the foreign-born population - Switzerland (%)
Place of birth for the foreign-born population - Other Western Europe (%)
Place of birth for the foreign-born population - Greece (%)
Place of birth for the foreign-born population - Italy (%)
Place of birth for the foreign-born population - Portugal (%)
Place of birth for the foreign-born population - Spain (%)
Place of birth for the foreign-born population - Other Southern Europe (%)
Place of birth for the foreign-born population - Albania (%)
Place of birth for the foreign-born population - Belarus (%)
Place of birth for the foreign-born population - Bosnia and Herzegovina (%)
Place of birth for the foreign-born population - Bulgaria (%)
Place of birth for the foreign-born population - Croatia (%)
Place of birth for the foreign-born population - Czechoslovakia (%)
Place of birth for the foreign-born population - Hungary (%)
Place of birth for the foreign-born population - Latvia (%)
Place of birth for the foreign-born population - Lithuania (%)
Place of birth for the foreign-born population - North Macedonia (Macedonia) (%)
Place of birth for the foreign-born population - Moldova (%)
Place of birth for the foreign-born population - Poland (%)
Place of birth for the foreign-born population - Romania (%)
Place of birth for the foreign-born population - Russia (%)
Place of birth for the foreign-born population - Serbia (%)
Place of birth for the foreign-born population - Ukraine (%)
Place of birth for the foreign-born population - Other Eastern Europe (%)
Place of birth for the foreign-born population - China (%)
Place of birth for the foreign-born population - Hong Kong (%)
Place of birth for the foreign-born population - Taiwan (%)
Place of birth for the foreign-born population - Japan (%)
Place of birth for the foreign-born population - Korea (%)
Place of birth for the foreign-born population - Other Eastern Asia (%)
Place of birth for the foreign-born population - Afghanistan (%)
Place of birth for the foreign-born population - Bangladesh (%)
Place of birth for the foreign-born population - India (%)
Place of birth for the foreign-born population - Iran (%)
Place of birth for the foreign-born population - Kazakhstan (%)
Place of birth for the foreign-born population - Nepal (%)
Place of birth for the foreign-born population - Pakistan (%)
Place of birth for the foreign-born population - Sri Lanka (%)
Place of birth for the foreign-born population - Uzbekistan (%)
Place of birth for the foreign-born population - Other South Central Asia (%)
Place of birth for the foreign-born population - Burma (%)
Place of birth for the foreign-born population - Cambodia (%)
Place of birth for the foreign-born population - Indonesia (%)
Place of birth for the foreign-born population - Laos (%)
Place of birth for the foreign-born population - Malaysia (%)
Place of birth for the foreign-born population - Philippines (%)
Place of birth for the foreign-born population - Singapore (%)
Place of birth for the foreign-born population - Thailand (%)
Place of birth for the foreign-born population - Vietnam (%)
Place of birth for the foreign-born population - Other South Eastern Asia (%)
Place of birth for the foreign-born population - Armenia (%)
Place of birth for the foreign-born population - Iraq (%)
Place of birth for the foreign-born population - Israel (%)
Place of birth for the foreign-born population - Jordan (%)
Place of birth for the foreign-born population - Kuwait (%)
Place of birth for the foreign-born population - Lebanon (%)
Place of birth for the foreign-born population - Saudi Arabia (%)
Place of birth for the foreign-born population - Syria (%)
Place of birth for the foreign-born population - Turkey (%)
Place of birth for the foreign-born population - Yemen (%)
Place of birth for the foreign-born population - Other Western Asia (%)
Place of birth for the foreign-born population - Eritrea (%)
Place of birth for the foreign-born population - Ethiopia (%)
Place of birth for the foreign-born population - Kenya (%)
Place of birth for the foreign-born population - Somalia (%)
Place of birth for the foreign-born population - Uganda (%)
Place of birth for the foreign-born population - Zimbabwe (%)
Place of birth for the foreign-born population - Other Eastern Africa (%)
Place of birth for the foreign-born population - Cameroon (%)
Place of birth for the foreign-born population - Congo (%)
Place of birth for the foreign-born population - Democratic Republic of Congo (Zaire) (%)
Place of birth for the foreign-born population - Other Middle Africa (%)
Place of birth for the foreign-born population - Egypt (%)
Place of birth for the foreign-born population - Morocco (%)
Place of birth for the foreign-born population - Sudan (%)
Place of birth for the foreign-born population - Other Northern Africa (%)
Place of birth for the foreign-born population - South Africa (%)
Place of birth for the foreign-born population - Other Southern Africa (%)
Place of birth for the foreign-born population - Cabo Verde (%)
Place of birth for the foreign-born population - Ghana (%)
Place of birth for the foreign-born population - Liberia (%)
Place of birth for the foreign-born population - Nigeria (%)
Place of birth for the foreign-born population - Senegal (%)
Place of birth for the foreign-born population - Sierra Leone (%)
Place of birth for the foreign-born population - Other Western Africa (%)
Place of birth for the foreign-born population - Australia (%)
Place of birth for the foreign-born population - New Zealand (%)
Place of birth for the foreign-born population - Fiji (%)
Place of birth for the foreign-born population - Micronesia (%)
Place of birth for the foreign-born population - Bahamas (%)
Place of birth for the foreign-born population - Barbados (%)
Place of birth for the foreign-born population - Cuba (%)
Place of birth for the foreign-born population - Dominica (%)
Place of birth for the foreign-born population - Dominican Republic (%)
Place of birth for the foreign-born population - Grenada (%)
Place of birth for the foreign-born population - Haiti (%)
Place of birth for the foreign-born population - Jamaica (%)
Place of birth for the foreign-born population - St. Vincent and the Grenadines (%)
Place of birth for the foreign-born population - Trinidad and Tobago (%)
Place of birth for the foreign-born population - West Indies (%)
Place of birth for the foreign-born population - Other Caribbean (%)
Place of birth for the foreign-born population - Belize (%)
Place of birth for the foreign-born population - Costa Rica (%)
Place of birth for the foreign-born population - El Salvador (%)
Place of birth for the foreign-born population - Guatemala (%)
Place of birth for the foreign-born population - Honduras (%)
Place of birth for the foreign-born population - Mexico (%)
Place of birth for the foreign-born population - Nicaragua (%)
Place of birth for the foreign-born population - Panama (%)
Place of birth for the foreign-born population - Other Central America (%)
Place of birth for the foreign-born population - Argentina (%)
Place of birth for the foreign-born population - Bolivia (%)
Place of birth for the foreign-born population - Brazil (%)
Place of birth for the foreign-born population - Chile (%)
Place of birth for the foreign-born population - Colombia (%)
Place of birth for the foreign-born population - Ecuador (%)
Place of birth for the foreign-born population - Guyana (%)
Place of birth for the foreign-born population - Peru (%)
Place of birth for the foreign-born population - Uruguay (%)
Place of birth for the foreign-born population - Venezuela (%)
Place of birth for the foreign-born population - Other South America (%)
Place of birth for the foreign-born population - Canada (%)
Place of birth for the foreign-born population - Other Northern America (%)
Place of birth for the foreign-born population - Other (%)
Latest news about races in Holiday, FL collected exclusively by city-data.com from local newspapers, TV, and radio stations
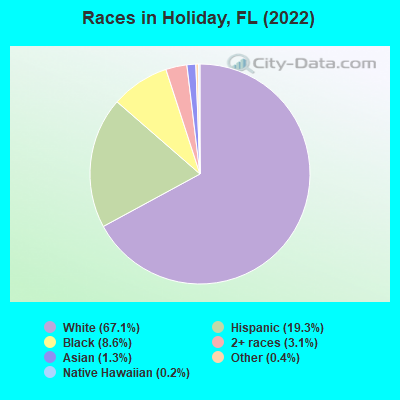
According to 2022 data, the most numerous races in Holiday, FL are White alone (15,428 residents), Hispanic (4,442 residents), and Black alone (1,979 residents). 80.3% of Holiday residents speak English at home. 8.8% of Holiday, FL residents are foreign-born (3.2% born in Europe, 2.7% born in Latin America, 1.6% born in Asia, 0.9% born in Africa), which is 139.5% less than the foreign-born rate of 21.0% across the entire state of Florida.
Race distribution in Holiday
2000 2022
10,458,509 65.4% White alone 2,682,715 16.8% Hispanic 2,264,268 14.2% Black alone 261,693 1.6% Asian alone 236,954 1.5% Two or more races 42,358 0.3% American Indian alone 28,994 0.2% Other race alone 6,887 0.04% Native Hawaiian and Other
11,309,403 50.8% White alone 6,025,039 27.1% Hispanic 3,241,015 14.6% Black alone 861,630 3.9% Two or more races 623,692 2.8% Asian alone 152,054 0.7% Other race alone 22,504 0.1% American Indian alone 9,486 0.04% Native Hawaiian and Other
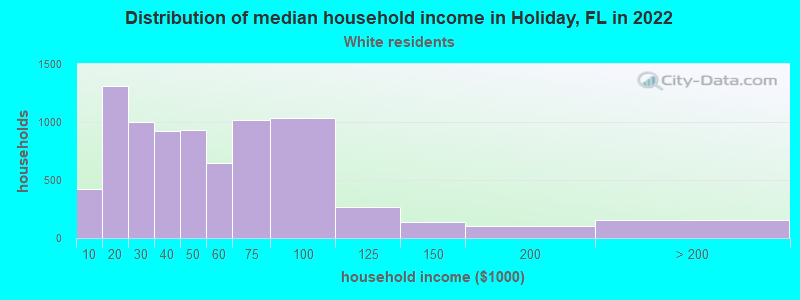
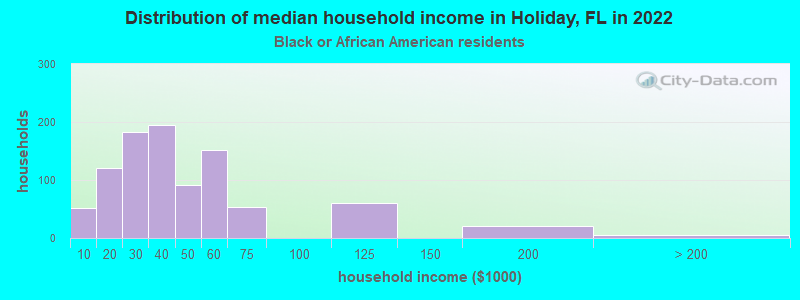
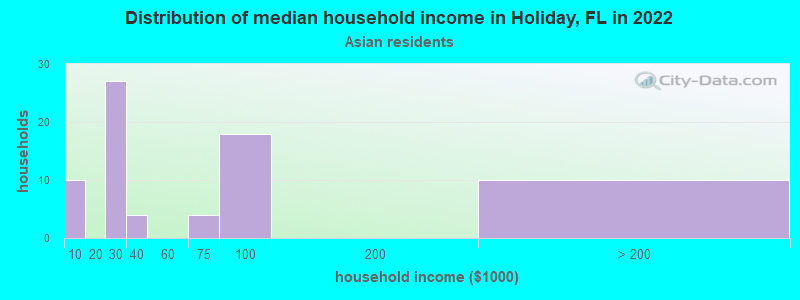
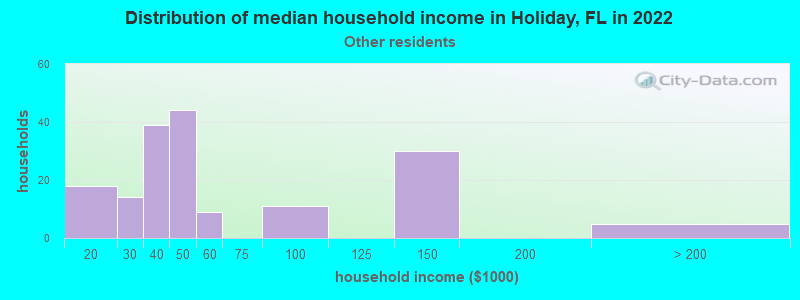
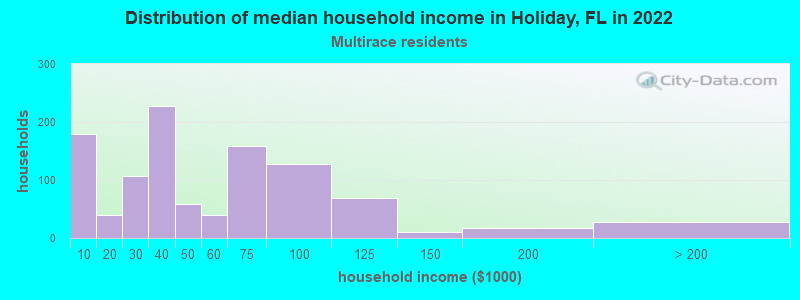
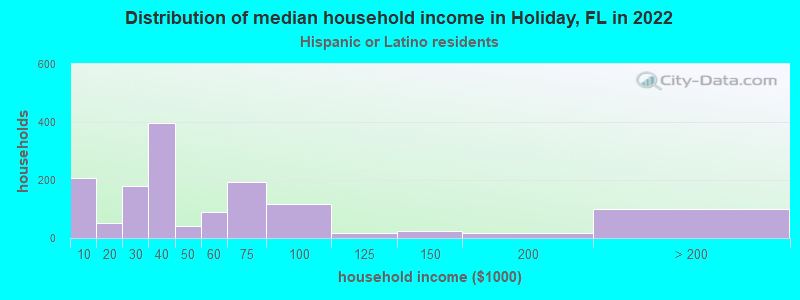
Income and house value in Holiday Median household income in 2022 $43,516 White non-Hispanic householders$32,625 Black householders$40,271 Some other race householders$44,456 Two or more races householders$39,737 Hispanic or Latino race householdersMedian 2022 house value $163,028 White Non-Hispanic householders$211,168 Black or African American householders $265,806 Asian householders$157,416 Some other race householders$168,048 Two or more races householders$159,779 Hispanic or Latino householders
Median age by race in Holiday
49.9 Median age for White residents49.5 50.5 29.0 Median age for Black or African American residents30.5 28.2 -513,238,288.7 Median age for American Indian / Alaska Native residents-769,874,476.2 -501,002,003.5 39.6 Median age for Asian residents36.4 40.5 46.5 Median age for Native Hawaiian / Pacific Islander residents-858,307,848.3 25.1 33.4 Median age for Other race residents35.0 31.1 27.6 Median age for Two or more races residents31.1 23.4 51.4 Median age for White alone residents50.4 52.4 32.9 Median age for Hispanic or Latino residents31.2 34.7
Owner/renter occupied households by race in Holiday
House owners and renters - White residents 5,363 65.2% Owner occupied2,868 34.8% Renter occupiedHouse owners and renters - Black or African American residents 169 18.2% Owner occupied761 81.8% Renter occupiedHouse owners and renters - Asian residents 53 71.6% Owner occupied21 28.4% Renter occupiedHouse owners and renters - Other race residents 99 41.1% Owner occupied141 58.9% Renter occupiedHouse owners and renters - Two or more races residents 466 42.3% Owner occupied637 57.7% Renter occupiedHouse owners and renters - White alone residents 5,196 64.9% Owner occupied2,810 35.1% Renter occupiedHouse owners and renters - Hispanic or Latino residents 680 50.0% Owner occupied680 50.0% Renter occupied
Language usage in Holiday
English speakers - Total 80.3% of residents of Holiday speak English at home.
11.9% of residents speak Spanish at home 1,930 74.2% Speak English very well670 25.8% Speak English less than very well7.6% of residents speak other language at home 1,204 72.8% Speak English very well449 27.2% Speak English less than very well
English speakers - Born in the United States 90.5% of residents of Holiday speak English at home.
7.4% of residents speak Spanish at home 735 96.6% Speak English very well26 3.4% Speak English less than very well2.2% of residents speak other language at home 214 92.6% Speak English very well17 7.4% Speak English less than very well
English speakers - Native, born elsewhere 12.7% of residents of Holiday speak English at home.
77.8% of residents speak Spanish at home 523 66.0% Speak English very well269 34.0% Speak English less than very well14.0% of residents speak other language at home 119 83.2% Speak English very well24 16.8% Speak English less than very well
English speakers - Foreign-born 15.3% of residents of Holiday speak English at home.
26.4% of residents speak Spanish at home 290 48.3% Speak English very well310 51.7% Speak English less than very well57.2% of residents speak other language at home 868 66.7% Speak English very well433 33.3% Speak English less than very well
White (Caucasian) - Speak only English Native:
94.3% (13,757)Foreign-born:
18.3% (184)
White (Caucasian) - Speak another language Native:
5.3% (779)Foreign-born:
81.6% (823)
Black or African American - Speak only English Native:
90.6% (1,516)Foreign-born:
27.6% (68)
Black or African American - Speak another language Native:
9.8% (164)Foreign-born:
66.1% (162)
Asian - Speak only English Native:
59.0% (27)Foreign-born:
5.7% (11)
Asian - Speak another language Native:
36.9% (17)Foreign-born:
89.8% (179)
Other race - Speak only English Native:
29.6% (177)Foreign-born:
30.8% (33)
Other race - Speak another language Native:
72.0% (431)Foreign-born:
69.4% (75)
Two or more races - Speak only English Native:
62.9% (1,657)Foreign-born:
2.9% (12)
Two or more races - Speak another language Native:
36.9% (973)Foreign-born:
99.8% (407)
White alone - Speak only English Native:
97.0% (13,446)Foreign-born:
18.7% (205)
White alone - Speak another language Native:
3.0% (419)Foreign-born:
85.2% (933)
Hispanic or Latino - Speak only English Native:
46.9% (1,605)Foreign-born:
5.3% (31)
Hispanic or Latino - Speak another language Native:
53.2% (1,821)Foreign-born:
96.2% (563)
Foreign-born residents in Holiday 2,016 residents are foreign born (3.2% Europe , 2.7% Latin America , 1.6% Asia , 0.9% Africa ).
This city:
8.8%Florida:
21.1%
Marital status for residents in Holiday Marital status - White (Caucasian) population 15 years and over
Males 39.2% Never married37.8% Now married1.0% Separated5.6% Widowed16.5% DivorcedFemales 29.3% Never married36.3% Now married1.9% Separated13.8% Widowed18.7% DivorcedWomen who gave birth in the past 12 months Now married:
78.0% (91)Unmarried:
22.0% (26)
Women who did not give birth in the past 12 months Now married:
43.7% (1,332)Unmarried:
56.3% (1,714)
Marital status - Black or African American population 15 years and over
Males 57.3% Never married36.9% Now married0.0% Separated0.0% Widowed5.9% DivorcedFemales 60.5% Never married14.0% Now married5.6% Separated7.8% Widowed12.2% DivorcedWomen who did not give birth in the past 12 months Now married:
17.0% (92)Unmarried:
83.0% (450)
Marital status - Asian population 15 years and over
Males 9.7% Never married68.9% Now married0.0% Separated8.7% Widowed12.6% DivorcedFemales 12.4% Never married87.6% Now married0.0% Separated0.0% Widowed0.0% DivorcedWomen who did not give birth in the past 12 months Now married:
75.0% (40)Unmarried:
25.0% (13)
Marital status - Other race population 15 years and over
Males 49.7% Never married43.4% Now married0.0% Separated4.6% Widowed2.3% DivorcedFemales 22.2% Never married33.3% Now married30.1% Separated2.6% Widowed11.8% DivorcedWomen who gave birth in the past 12 months Now married:
100.0% (27)Unmarried:
0.0% (0)
Women who did not give birth in the past 12 months Now married:
48.1% (92)Unmarried:
51.9% (99)
Marital status - Two or more races population 15 years and over
Males 50.5% Never married35.6% Now married0.8% Separated6.4% Widowed6.7% DivorcedFemales 51.1% Never married37.9% Now married6.3% Separated0.0% Widowed4.8% DivorcedWomen who gave birth in the past 12 months Now married:
13.6% (23)Unmarried:
86.4% (146)
Women who did not give birth in the past 12 months Now married:
45.0% (277)Unmarried:
55.0% (339)
Marital status - White alone, not Hispanic / Latino population 15 years and over
Males 39.6% Never married37.2% Now married1.0% Separated5.1% Widowed17.1% DivorcedFemales 29.2% Never married35.4% Now married1.8% Separated14.5% Widowed19.1% DivorcedWomen who gave birth in the past 12 months Now married:
75.0% (81)Unmarried:
25.0% (27)
Women who did not give birth in the past 12 months Now married:
42.4% (1,173)Unmarried:
57.6% (1,592)
Marital status - Hispanic or Latino population 15 years and over
Males 47.3% Never married40.9% Now married0.0% Separated6.2% Widowed5.6% DivorcedFemales 35.9% Never married42.7% Now married7.3% Separated5.4% Widowed8.7% DivorcedWomen who gave birth in the past 12 months Now married:
26.1% (35)Unmarried:
73.9% (99)
Women who did not give birth in the past 12 months Now married:
52.8% (575)Unmarried:
47.2% (515)
Ancestries in Holiday
5,334 41.0% American581 4.5% Italian546 4.2% German430 3.3% Greek422 3.2% Irish386 3.0% English276 2.1% Egyptian250 1.9% Dutch128 1.0% Lebanese122 0.9% French Canadian121 0.9% European115 0.9% Portuguese103 0.8% Brazilian95 0.7% French85 0.7% Polish74 0.6% Hungarian64 0.5% British52 0.4% Scottish35 0.3% Swiss34 0.3% Scandinavian32 0.2% Jamaican26 0.2% Arab25 0.2% Swedish24 0.2% Albanian22 0.2% Slovak21 0.2% West Indian20 0.2% Russian17 0.1% Turkish16 0.1% Finnish13 0.10% Norwegian11 0.08% Czech10 0.08% Pennsylvania German10 0.08% Iranian10 0.08% Eastern European10 0.08% Kenyan9 0.07% Lithuanian8 0.06% Welsh8 0.06% Haitian6 0.05% Croatian5 0.04% Scotch-Irish4 0.03% Slovene4 0.03% Latvian1 0.01% Trinidadian and Tobagonian
Geographical mobility in Holiday Same house 1 year ago 14,762 92.0% White (Caucasian)2,083 90.8% Black or African American144 49.3% Asian58 100.0% Native Hawaiian / Pacific Islander425 61.8% Other race3,209 93.9% Two or more races14,113 92.1% White alone, not Hispanic / Latino3,968 92.1% Hispanic or LatinoMoved within same county 326 2.0% White / Caucasian143 48.9% Asian72 10.4% Other race28 0.8% Two or more races342 2.2% White alone, not Hispanic / Latino41 1.0% Hispanic or LatinoMoved within same state 337 2.1% White / Caucasian114 5.0% Black or African American26 8.9% Asian55 8.0% Other race147 4.3% Two or more races229 1.5% White alone, not Hispanic / Latino241 5.6% Hispanic or LatinoMoved from different state 577 3.6% White / Caucasian68 2.9% Black or African American39 13.4% Asian25 3.6% Other race61 1.8% Two or more races580 3.8% White alone, not Hispanic / Latino79 1.8% Hispanic or LatinoMoved from abroad 178 1.1% White37 1.6% Black or African American9 3.1% Asian219 1.4% White alone, not Hispanic / Latino24 0.6% Hispanic or Latino
Children Nativity (place of birth) in Holiday
Children under 6 years - Living with two parents Both parents native 441 100.0% NativeBoth parents foreign-born 46 67.3% Native22 32.7% Foreign-bornOne native, one foreign-born parent 120 100.0% NativeChildren under 6 years - Living with one parent Native parent 1,002 100.0% NativeForeign-born parent 9 28.6% Native21 71.4% Foreign-bornChildren 6 to 17 years - Living with two parents Both parents native 1,305 99.9% Native1 0.1% Foreign-bornBoth parents foreign-born 53 79.5% Native14 20.5% Foreign-bornOne native, one foreign-born parent 126 100.0% NativeChildren 6 to 17 years - Living with one parent Native parent 871 100.0% NativeForeign-born parent 107 58.0% Native78 42.0% Foreign-born
Grandparents responsible for own grandchildren in Holiday
Grandparents (30 to 59 years) White / Caucasian 32 41.5% Responsible for grandchildren45 58.5% Not responsible for grandchildrenBlack or African American 21 100.0% Not responsible for grandchildrenAsian 29 100.0% Responsible for grandchildrenNative Hawaiian / Pacific Islander 10 100.0% Responsible for grandchildrenWhite alone, not Hispanic / Latino 34 46.5% Responsible for grandchildren39 53.5% Not responsible for grandchildrenGrandparents (60 years and over) White / Caucasian 108 47.0% Responsible for grandchildren122 53.0% Not responsible for grandchildrenBlack or African American 36 68.6% Responsible for grandchildren16 31.4% Not responsible for grandchildrenWhite alone, not Hispanic / Latino 113 66.1% Responsible for grandchildren58 33.9% Not responsible for grandchildren