Races in Hilo, Hawaii (HI) Detailed Stats
Data:
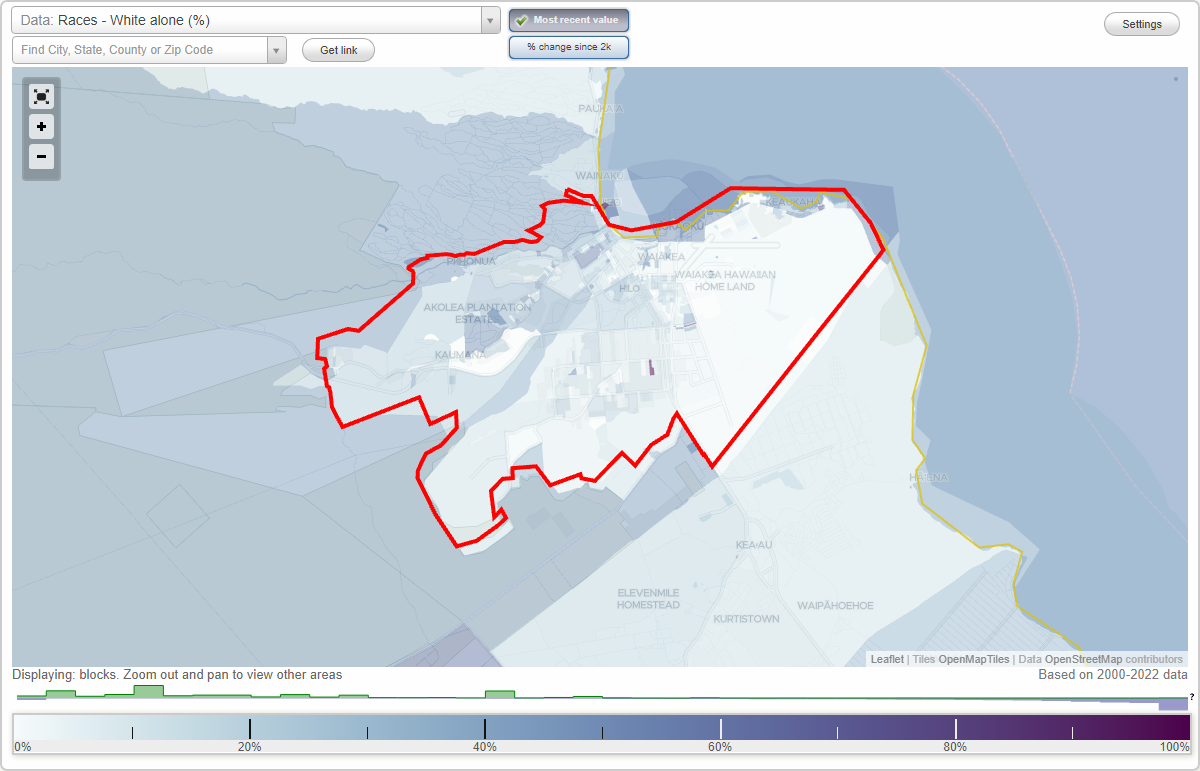
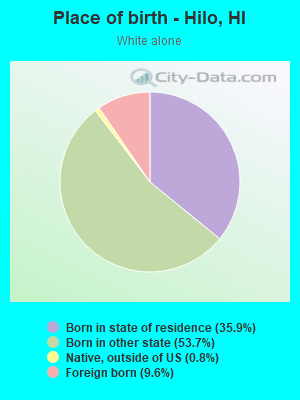
Races - White alone (%)
Races - White alone (% change since 2000)
Races - Black alone (%)
Races - Black alone (% change since 2000)
Races - American Indian alone (%)
Races - American Indian alone (% change since 2000)
Races - Asian alone (%)
Races - Asian alone (% change since 2000)
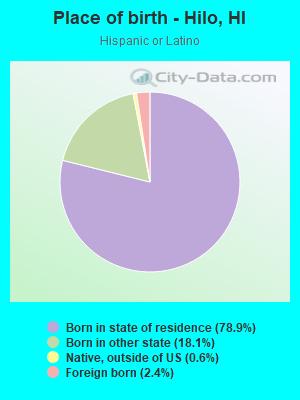
Races - Hispanic (%)
Races - Hispanic (% change since 2000)
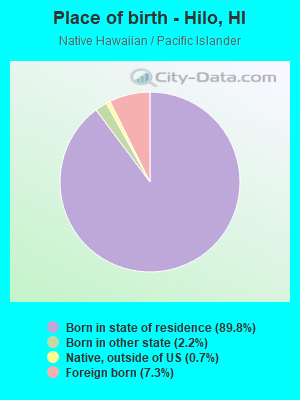
Races - Native Hawaiian and Other Pacific Islander alone (%)
Races - Native Hawaiian and Other Pacific Islander alone (% change since 2000)
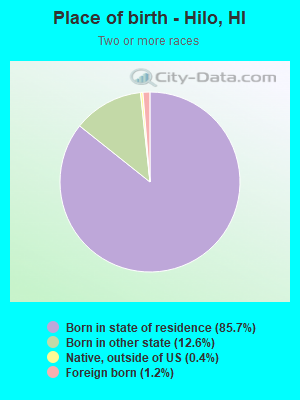
Races - Two or more races(%)
Races - Two or more races(% change since 2000)
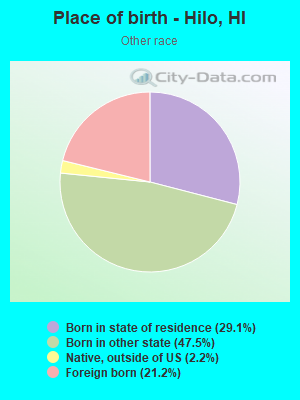
Races - Other race alone (%)
Races - Other race alone (% change since 2000)
Racial diversity
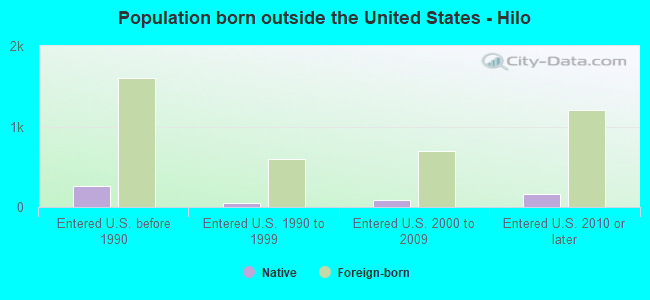
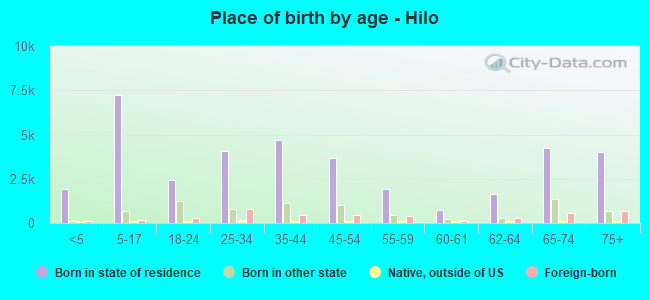
Place of birth - Born in state of residence (%)
Place of birth - Born in state of residence (%) - White
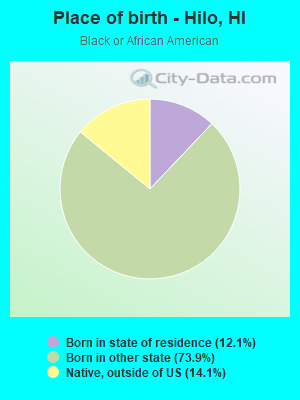
Place of birth - Born in state of residence (%) - Black or African American
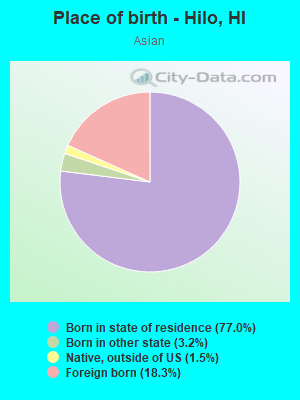
Place of birth - Born in state of residence (%) - Asian
Place of birth - Born in state of residence (%) - Hispanic or Latino
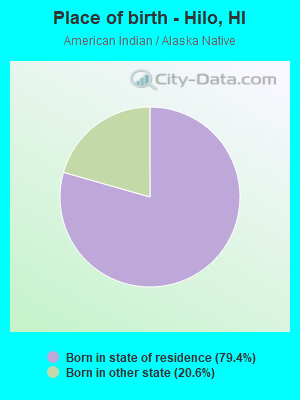
Place of birth - Born in state of residence (%) - American Indian and Alaska Native
Place of birth - Born in state of residence (%) - Multirace
Place of birth - Born in state of residence (%) - Other Race
Place of birth - Born in other state (%)
Place of birth - Born in other state (%) - White
Place of birth - Born in other state (%) - Black or African American
Place of birth - Born in other state (%) - Asian
Place of birth - Born in other state (%) - Hispanic or Latino
Place of birth - Born in other state (%) - American Indian and Alaska Native
Place of birth - Born in other state (%) - Multirace
Place of birth - Born in other state (%) - Other Race
Place of birth - Native, outside of US (%)
Place of birth - Native, outside of US (%) - White
Place of birth - Native, outside of US (%) - Black or African American
Place of birth - Native, outside of US (%) - Asian
Place of birth - Native, outside of US (%) - Hispanic or Latino
Place of birth - Native, outside of US (%) - American Indian and Alaska Native
Place of birth - Native, outside of US (%) - Multirace
Place of birth - Native, outside of US (%) - Other Race
Place of birth - Foreign born (%)
Place of birth - Foreign born (%) - White
Place of birth - Foreign born (%) - Black or African American
Place of birth - Foreign born (%) - Asian
Place of birth - Foreign born (%) - Hispanic or Latino
Place of birth - Foreign born (%) - American Indian and Alaska Native
Place of birth - Foreign born (%) - Multirace
Place of birth - Foreign born (%) - Other Race
Residents speaking English at home (%)
Residents speaking English at home - Born in the United States (%)
Residents speaking English at home - Native, born elsewhere (%)
Residents speaking English at home - Foreign born (%)
Residents speaking Spanish at home (%)
Residents speaking Spanish at home - Born in the United States (%)
Residents speaking Spanish at home - Native, born elsewhere (%)
Residents speaking Spanish at home - Foreign born (%)
Residents speaking other language at home (%)
Residents speaking other language at home - Born in the United States (%)
Residents speaking other language at home - Native, born elsewhere (%)
Residents speaking other language at home - Foreign born (%)
Marital status - Never married (%)
Marital status - Now married (%)
Marital status - Separated (%)
Marital status - Widowed (%)
Marital status - Divorced (%)
Ancestries Reported - Arab (%)
Ancestries Reported - Czech (%)
Ancestries Reported - Danish (%)
Ancestries Reported - Dutch (%)
Ancestries Reported - English (%)
Ancestries Reported - French (%)
Ancestries Reported - French Canadian (%)
Ancestries Reported - German (%)
Ancestries Reported - Greek (%)
Ancestries Reported - Hungarian (%)
Ancestries Reported - Irish (%)
Ancestries Reported - Italian (%)
Ancestries Reported - Lithuanian (%)
Ancestries Reported - Norwegian (%)
Ancestries Reported - Polish (%)
Ancestries Reported - Portuguese (%)
Ancestries Reported - Russian (%)
Ancestries Reported - Scotch-Irish (%)
Ancestries Reported - Scottish (%)
Ancestries Reported - Slovak (%)
Ancestries Reported - Subsaharan African (%)
Ancestries Reported - Swedish (%)
Ancestries Reported - Swiss (%)
Ancestries Reported - Ukrainian (%)
Ancestries Reported - United States (%)
Ancestries Reported - Welsh (%)
Ancestries Reported - West Indian (%)
Ancestries Reported - Other (%)
Geographical mobility - Same house 1 year ago (%)
Geographical mobility - Same house 1 year ago (%) - White
Geographical mobility - Same house 1 year ago (%) - Black or African American
Geographical mobility - Same house 1 year ago (%) - Asian
Geographical mobility - Same house 1 year ago (%) - Hispanic or Latino
Geographical mobility - Same house 1 year ago (%) - American Indian and Alaska Native
Geographical mobility - Same house 1 year ago (%) - Multirace
Geographical mobility - Same house 1 year ago (%) - Other Race
Geographical mobility - Moved within same county (%)
Geographical mobility - Moved within same county (%) - White
Geographical mobility - Moved within same county (%) - Black or African American
Geographical mobility - Moved within same county (%) - Asian
Geographical mobility - Moved within same county (%) - Hispanic or Latino
Geographical mobility - Moved within same county (%) - American Indian and Alaska Native
Geographical mobility - Moved within same county (%) - Multirace
Geographical mobility - Moved within same county (%) - Other Race
Geographical mobility - Moved from different county within same state (%)
Geographical mobility - Moved from different county within same state (%) - White
Geographical mobility - Moved from different county within same state (%) - Black or African American
Geographical mobility - Moved from different county within same state (%) - Asian
Geographical mobility - Moved from different county within same state (%) - Hispanic or Latino
Geographical mobility - Moved from different county within same state (%) - American Indian and Alaska Native
Geographical mobility - Moved from different county within same state (%) - Multirace
Geographical mobility - Moved from different county within same state (%) - Other Race
Geographical mobility - Moved from different state (%)
Geographical mobility - Moved from different state (%) - White
Geographical mobility - Moved from different state (%) - Black or African American
Geographical mobility - Moved from different state (%) - Asian
Geographical mobility - Moved from different state (%) - Hispanic or Latino
Geographical mobility - Moved from different state (%) - American Indian and Alaska Native
Geographical mobility - Moved from different state (%) - Multirace
Geographical mobility - Moved from different state (%) - Other Race
Geographical mobility - Moved from abroad (%)
Geographical mobility - Moved from abroad (%) - White
Geographical mobility - Moved from abroad (%) - Black or African American
Geographical mobility - Moved from abroad (%) - Asian
Geographical mobility - Moved from abroad (%) - Hispanic or Latino
Geographical mobility - Moved from abroad (%) - American Indian and Alaska Native
Geographical mobility - Moved from abroad (%) - Multirace
Geographical mobility - Moved from abroad (%) - Other Race
Place of birth for the foreign-born population - Ireland (%)
Place of birth for the foreign-born population - Denmark (%)
Place of birth for the foreign-born population - Norway (%)
Place of birth for the foreign-born population - Sweden (%)
Place of birth for the foreign-born population - United Kingdom (%)
Place of birth for the foreign-born population - England (%)
Place of birth for the foreign-born population - Scotland (%)
Place of birth for the foreign-born population - Other Northern Europe (%)
Place of birth for the foreign-born population - Austria (%)
Place of birth for the foreign-born population - Belgium (%)
Place of birth for the foreign-born population - France (%)
Place of birth for the foreign-born population - Germany (%)
Place of birth for the foreign-born population - Netherlands (%)
Place of birth for the foreign-born population - Switzerland (%)
Place of birth for the foreign-born population - Other Western Europe (%)
Place of birth for the foreign-born population - Greece (%)
Place of birth for the foreign-born population - Italy (%)
Place of birth for the foreign-born population - Portugal (%)
Place of birth for the foreign-born population - Spain (%)
Place of birth for the foreign-born population - Other Southern Europe (%)
Place of birth for the foreign-born population - Albania (%)
Place of birth for the foreign-born population - Belarus (%)
Place of birth for the foreign-born population - Bosnia and Herzegovina (%)
Place of birth for the foreign-born population - Bulgaria (%)
Place of birth for the foreign-born population - Croatia (%)
Place of birth for the foreign-born population - Czechoslovakia (%)
Place of birth for the foreign-born population - Hungary (%)
Place of birth for the foreign-born population - Latvia (%)
Place of birth for the foreign-born population - Lithuania (%)
Place of birth for the foreign-born population - North Macedonia (Macedonia) (%)
Place of birth for the foreign-born population - Moldova (%)
Place of birth for the foreign-born population - Poland (%)
Place of birth for the foreign-born population - Romania (%)
Place of birth for the foreign-born population - Russia (%)
Place of birth for the foreign-born population - Serbia (%)
Place of birth for the foreign-born population - Ukraine (%)
Place of birth for the foreign-born population - Other Eastern Europe (%)
Place of birth for the foreign-born population - China (%)
Place of birth for the foreign-born population - Hong Kong (%)
Place of birth for the foreign-born population - Taiwan (%)
Place of birth for the foreign-born population - Japan (%)
Place of birth for the foreign-born population - Korea (%)
Place of birth for the foreign-born population - Other Eastern Asia (%)
Place of birth for the foreign-born population - Afghanistan (%)
Place of birth for the foreign-born population - Bangladesh (%)
Place of birth for the foreign-born population - India (%)
Place of birth for the foreign-born population - Iran (%)
Place of birth for the foreign-born population - Kazakhstan (%)
Place of birth for the foreign-born population - Nepal (%)
Place of birth for the foreign-born population - Pakistan (%)
Place of birth for the foreign-born population - Sri Lanka (%)
Place of birth for the foreign-born population - Uzbekistan (%)
Place of birth for the foreign-born population - Other South Central Asia (%)
Place of birth for the foreign-born population - Burma (%)
Place of birth for the foreign-born population - Cambodia (%)
Place of birth for the foreign-born population - Indonesia (%)
Place of birth for the foreign-born population - Laos (%)
Place of birth for the foreign-born population - Malaysia (%)
Place of birth for the foreign-born population - Philippines (%)
Place of birth for the foreign-born population - Singapore (%)
Place of birth for the foreign-born population - Thailand (%)
Place of birth for the foreign-born population - Vietnam (%)
Place of birth for the foreign-born population - Other South Eastern Asia (%)
Place of birth for the foreign-born population - Armenia (%)
Place of birth for the foreign-born population - Iraq (%)
Place of birth for the foreign-born population - Israel (%)
Place of birth for the foreign-born population - Jordan (%)
Place of birth for the foreign-born population - Kuwait (%)
Place of birth for the foreign-born population - Lebanon (%)
Place of birth for the foreign-born population - Saudi Arabia (%)
Place of birth for the foreign-born population - Syria (%)
Place of birth for the foreign-born population - Turkey (%)
Place of birth for the foreign-born population - Yemen (%)
Place of birth for the foreign-born population - Other Western Asia (%)
Place of birth for the foreign-born population - Eritrea (%)
Place of birth for the foreign-born population - Ethiopia (%)
Place of birth for the foreign-born population - Kenya (%)
Place of birth for the foreign-born population - Somalia (%)
Place of birth for the foreign-born population - Uganda (%)
Place of birth for the foreign-born population - Zimbabwe (%)
Place of birth for the foreign-born population - Other Eastern Africa (%)
Place of birth for the foreign-born population - Cameroon (%)
Place of birth for the foreign-born population - Congo (%)
Place of birth for the foreign-born population - Democratic Republic of Congo (Zaire) (%)
Place of birth for the foreign-born population - Other Middle Africa (%)
Place of birth for the foreign-born population - Egypt (%)
Place of birth for the foreign-born population - Morocco (%)
Place of birth for the foreign-born population - Sudan (%)
Place of birth for the foreign-born population - Other Northern Africa (%)
Place of birth for the foreign-born population - South Africa (%)
Place of birth for the foreign-born population - Other Southern Africa (%)
Place of birth for the foreign-born population - Cabo Verde (%)
Place of birth for the foreign-born population - Ghana (%)
Place of birth for the foreign-born population - Liberia (%)
Place of birth for the foreign-born population - Nigeria (%)
Place of birth for the foreign-born population - Senegal (%)
Place of birth for the foreign-born population - Sierra Leone (%)
Place of birth for the foreign-born population - Other Western Africa (%)
Place of birth for the foreign-born population - Australia (%)
Place of birth for the foreign-born population - New Zealand (%)
Place of birth for the foreign-born population - Fiji (%)
Place of birth for the foreign-born population - Micronesia (%)
Place of birth for the foreign-born population - Bahamas (%)
Place of birth for the foreign-born population - Barbados (%)
Place of birth for the foreign-born population - Cuba (%)
Place of birth for the foreign-born population - Dominica (%)
Place of birth for the foreign-born population - Dominican Republic (%)
Place of birth for the foreign-born population - Grenada (%)
Place of birth for the foreign-born population - Haiti (%)
Place of birth for the foreign-born population - Jamaica (%)
Place of birth for the foreign-born population - St. Vincent and the Grenadines (%)
Place of birth for the foreign-born population - Trinidad and Tobago (%)
Place of birth for the foreign-born population - West Indies (%)
Place of birth for the foreign-born population - Other Caribbean (%)
Place of birth for the foreign-born population - Belize (%)
Place of birth for the foreign-born population - Costa Rica (%)
Place of birth for the foreign-born population - El Salvador (%)
Place of birth for the foreign-born population - Guatemala (%)
Place of birth for the foreign-born population - Honduras (%)
Place of birth for the foreign-born population - Mexico (%)
Place of birth for the foreign-born population - Nicaragua (%)
Place of birth for the foreign-born population - Panama (%)
Place of birth for the foreign-born population - Other Central America (%)
Place of birth for the foreign-born population - Argentina (%)
Place of birth for the foreign-born population - Bolivia (%)
Place of birth for the foreign-born population - Brazil (%)
Place of birth for the foreign-born population - Chile (%)
Place of birth for the foreign-born population - Colombia (%)
Place of birth for the foreign-born population - Ecuador (%)
Place of birth for the foreign-born population - Guyana (%)
Place of birth for the foreign-born population - Peru (%)
Place of birth for the foreign-born population - Uruguay (%)
Place of birth for the foreign-born population - Venezuela (%)
Place of birth for the foreign-born population - Other South America (%)
Place of birth for the foreign-born population - Canada (%)
Place of birth for the foreign-born population - Other Northern America (%)
Place of birth for the foreign-born population - Other (%)
Latest news about races in Hilo, HI collected exclusively by city-data.com from local newspapers, TV, and radio stations
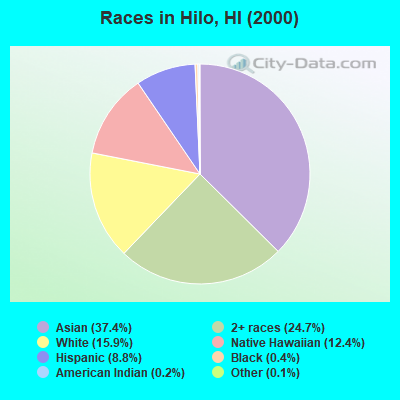
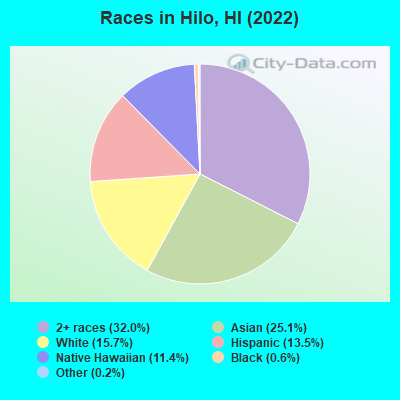
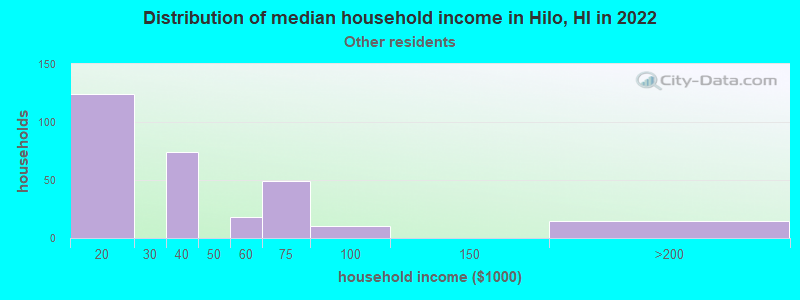
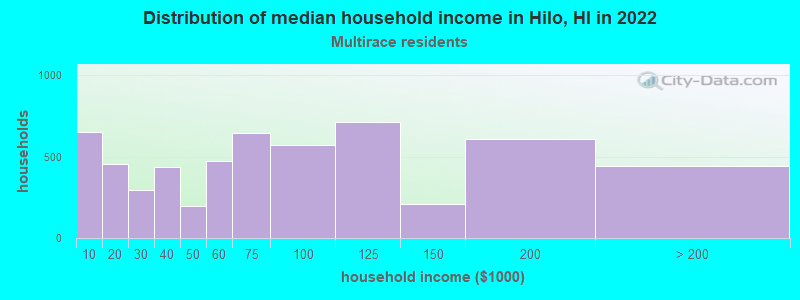
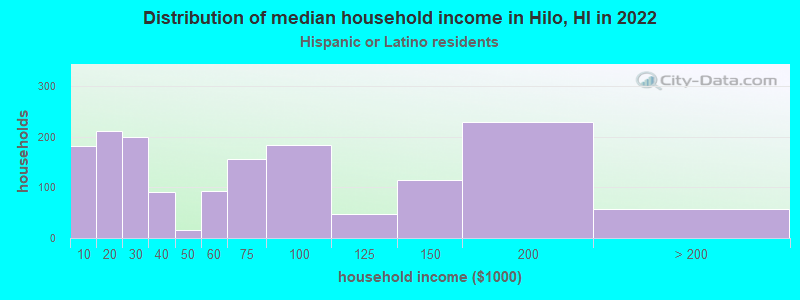
According to 2022 data, the most numerous races in Hilo, HI are Asian alone (12,205 residents), Two or more races (15,541 residents), and White alone (7,620 residents). 80.8% of Hilo residents speak English at home. 9.0% of Hilo, HI residents are foreign-born (6.8% born in Asia, 1.0% born in Europe, 0.9% born in Oceania), which is 99.4% less than the foreign-born rate of 18.0% across the entire state of Hawaii.
Race distribution in Hilo
2000 2022
15,259 37.4% Asian alone 10,050 24.7% Two or more races 6,491 15.9% White alone 5,066 12.4% Native Hawaiian and Other 3,579 8.8% Hispanic 162 0.4% Black alone 91 0.2% American Indian alone 61 0.1% Other race alone
15,541 32.0% Two or more races 12,205 25.1% Asian alone 7,620 15.7% White alone 6,571 13.5% Hispanic 5,557 11.4% Native Hawaiian and Other 297 0.6% Black alone 96 0.2% Other race alone 40 0.08% American Indian alone
2000 2022
494,149 40.8% Asian alone 277,091 22.9% White alone 218,700 18.1% Two or more races 108,441 9.0% Native Hawaiian and Other 87,699 7.2% Hispanic 20,829 1.7% Black alone 2,089 0.2% Other race alone 2,539 0.2% American Indian alone
498,125 34.6% Asian alone 318,574 22.1% Two or more races 297,937 20.7% White alone 160,103 11.1% Hispanic 134,567 9.3% Native Hawaiian and Other 23,682 1.6% Black alone 5,378 0.4% Other race alone 1,830 0.1% American Indian alone
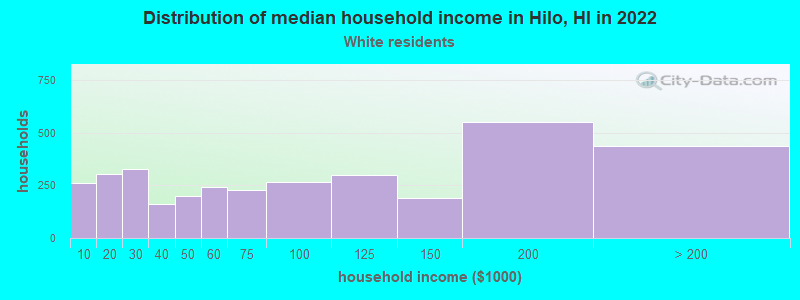
Income and house value in Hilo Median household income in 2022 $74,387 White non-Hispanic householders$3,287 Black householders$71,325 Asian householders$65,384 Native Hawaiian and other Pacific Islander householders$74,192 Some other race householders$64,236 Two or more races householders$69,625 Hispanic or Latino race householdersMedian 2022 house value $528,663 White Non-Hispanic householders$537,667 Black or African American householders$448,913 American Indian or Alaska Native householders $494,255 Asian householders$419,329 Native Hawaiian and other Pacific Islander householders$405,501 Some other race householders$485,573 Two or more races householders$464,349 Hispanic or Latino householders
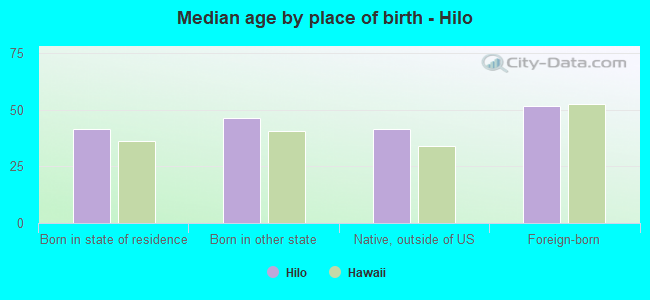
Median age by race in Hilo
53.6 Median age for White residents50.2 55.9 26.4 Median age for Black or African American residents27.2 51.7 45.7 Median age for American Indian / Alaska Native residents-1,082,456,139.3 44.3 63.3 Median age for Asian residents65.3 62.3 37.7 Median age for Native Hawaiian / Pacific Islander residents33.5 40.1 60.9 Median age for Other race residents73.7 66.8 30.4 Median age for Two or more races residents26.9 32.9 55.4 Median age for White alone residents52.3 58.6 21.8 Median age for Hispanic or Latino residents22.6 20.1
Owner/renter occupied households by race in Hilo
House owners and renters - White residents 2,243 66.7% Owner occupied1,119 33.3% Renter occupiedHouse owners and renters - Black or African American residents 53 13.3% Owner occupied346 86.7% Renter occupiedHouse owners and renters - American Indian / Alaska Native residents 1 13.2% Owner occupied9 86.8% Renter occupiedHouse owners and renters - Asian residents 4,771 82.1% Owner occupied1,044 17.9% Renter occupiedHouse owners and renters - Native Hawaiian / Pacific Islander residents 1,056 55.3% Owner occupied854 44.7% Renter occupiedHouse owners and renters - Other race residents 111 65.9% Owner occupied58 34.1% Renter occupiedHouse owners and renters - Two or more races residents 3,252 59.5% Owner occupied2,210 40.5% Renter occupiedHouse owners and renters - White alone residents 2,158 66.8% Owner occupied1,073 33.2% Renter occupiedHouse owners and renters - Hispanic or Latino residents 675 48.3% Owner occupied723 51.7% Renter occupied
Language usage in Hilo
English speakers - Total 80.8% of residents of Hilo speak English at home.
1.9% of residents speak Spanish at home 817 92.0% Speak English very well71 8.0% Speak English less than very well18.1% of residents speak other language at home 6,087 72.0% Speak English very well2,366 28.0% Speak English less than very well
English speakers - Born in the United States 85.2% of residents of Hilo speak English at home.
5.4% of residents speak Spanish at home 390 91.8% Speak English very well35 8.2% Speak English less than very well10.4% of residents speak other language at home 796 97.9% Speak English very well17 2.1% Speak English less than very well
English speakers - Native, born elsewhere 60.0% of residents of Hilo speak English at home.
1.5% of residents speak Spanish at home 7 100.0% Speak English very well45.9% of residents speak other language at home 215 100.0% Speak English very well
English speakers - Foreign-born 26.0% of residents of Hilo speak English at home.
3.0% of residents speak Spanish at home 94 76.4% Speak English very well29 23.6% Speak English less than very well71.6% of residents speak other language at home 1,283 43.5% Speak English very well1,664 56.5% Speak English less than very well
White (Caucasian) - Speak only English Native:
90.8% (6,478)Foreign-born:
48.6% (373)
White (Caucasian) - Speak another language Native:
8.5% (603)Foreign-born:
47.9% (368)
Asian - Speak only English Native:
95.7% (9,645)Foreign-born:
18.2% (399)
Asian - Speak another language Native:
8.0% (803)Foreign-born:
83.2% (1,826)
Native Hawaiian / Pacific Islander - Speak only English Native:
80.2% (4,402)Foreign-born:
21.5% (97)
Native Hawaiian / Pacific Islander - Speak another language Native:
21.6% (1,185)Foreign-born:
79.9% (359)
Other race - Speak only English Native:
89.6% (307)Foreign-born:
1.3% (1)
Other race - Speak another language Native:
16.6% (57)Foreign-born:
76.7% (76)
Two or more races - Speak only English Native:
81.9% (15,831)Foreign-born:
11.4% (30)
Two or more races - Speak another language Native:
18.2% (3,522)Foreign-born:
92.6% (247)
White alone - Speak only English Native:
91.9% (6,144)Foreign-born:
49.8% (375)
White alone - Speak another language Native:
8.0% (534)Foreign-born:
46.8% (352)
Hispanic or Latino - Speak only English Native:
83.2% (4,853)Foreign-born:
4.5% (7)
Hispanic or Latino - Speak another language Native:
17.3% (1,009)Foreign-born:
68.2% (112)
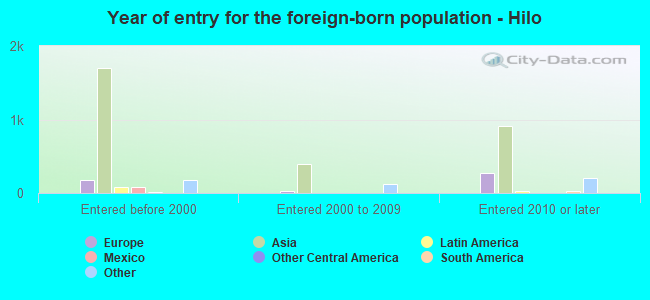
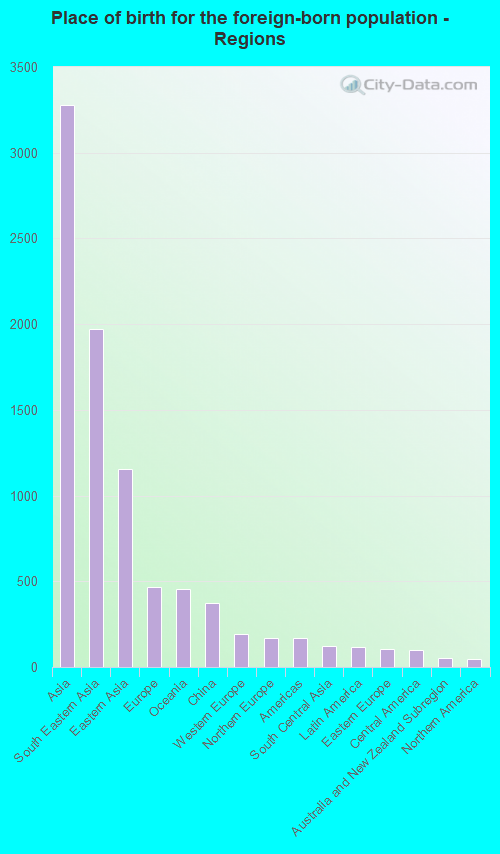
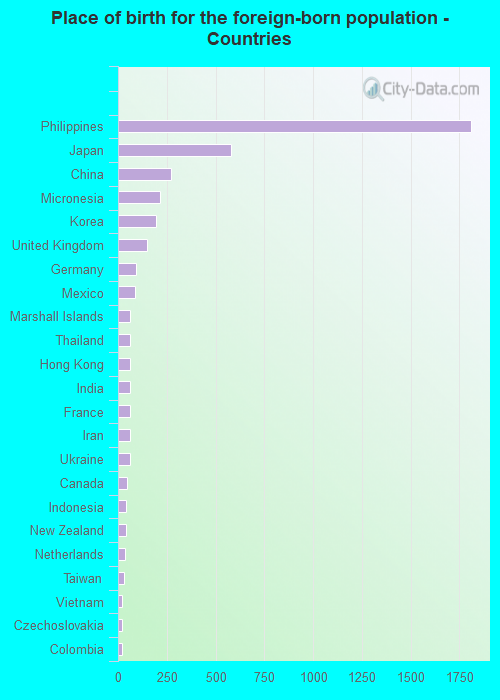
Foreign-born residents in Hilo 4,388 residents are foreign born (6.8% Asia , 1.0% Europe , 0.9% Oceania ).
This city:
9.0%Hawaii:
18.0%
Marital status for residents in Hilo Marital status - White (Caucasian) population 15 years and over
Males 34.1% Never married50.5% Now married1.5% Separated3.0% Widowed10.9% DivorcedFemales 30.2% Never married39.1% Now married1.2% Separated14.4% Widowed15.1% DivorcedWomen who gave birth in the past 12 months Now married:
0.0% (0)Unmarried:
100.0% (21)
Women who did not give birth in the past 12 months Now married:
33.1% (524)Unmarried:
66.9% (1,058)
Marital status - Black or African American population 15 years and over
Males 92.3% Never married3.1% Now married0.0% Separated0.0% Widowed4.6% DivorcedFemales 23.6% Never married24.4% Now married0.0% Separated10.2% Widowed41.7% DivorcedWomen who did not give birth in the past 12 months Now married:
50.0% (24)Unmarried:
50.0% (24)
Marital status - American Indian / Alaska Native population 15 years and over
Males 0.0% Never married100.0% Now married0.0% Separated0.0% Widowed0.0% DivorcedFemales 94.1% Never married0.0% Now married0.0% Separated5.9% Widowed0.0% DivorcedWomen who did not give birth in the past 12 months Now married:
0.0% (0)Unmarried:
100.0% (19)
Marital status - Asian population 15 years and over
Males 32.8% Never married56.2% Now married0.7% Separated2.9% Widowed7.4% DivorcedFemales 20.8% Never married51.4% Now married0.9% Separated17.3% Widowed9.5% DivorcedWomen who gave birth in the past 12 months Now married:
53.5% (59)Unmarried:
46.5% (51)
Women who did not give birth in the past 12 months Now married:
40.0% (767)Unmarried:
60.0% (1,152)
Marital status - Native Hawaiian / Pacific Islander population 15 years and over
Males 47.2% Never married42.9% Now married2.1% Separated2.7% Widowed5.1% DivorcedFemales 37.3% Never married39.5% Now married1.5% Separated6.0% Widowed15.7% DivorcedWomen who gave birth in the past 12 months Now married:
19.5% (17)Unmarried:
80.5% (70)
Women who did not give birth in the past 12 months Now married:
26.3% (382)Unmarried:
73.7% (1,071)
Marital status - Other race population 15 years and over
Males 11.4% Never married78.1% Now married0.0% Separated0.5% Widowed10.0% DivorcedFemales 27.3% Never married60.1% Now married0.0% Separated1.4% Widowed11.2% DivorcedWomen who did not give birth in the past 12 months Now married:
0.0% (0)Unmarried:
100.0% (66)
Marital status - Two or more races population 15 years and over
Males 52.4% Never married36.1% Now married2.9% Separated1.6% Widowed7.0% DivorcedFemales 47.6% Never married34.0% Now married2.6% Separated3.4% Widowed12.3% DivorcedWomen who gave birth in the past 12 months Now married:
38.6% (139)Unmarried:
61.4% (222)
Women who did not give birth in the past 12 months Now married:
32.3% (1,620)Unmarried:
67.7% (3,402)
Marital status - White alone, not Hispanic / Latino population 15 years and over
Males 31.9% Never married52.2% Now married1.6% Separated2.8% Widowed11.5% DivorcedFemales 26.8% Never married40.8% Now married1.1% Separated15.4% Widowed15.9% DivorcedWomen who gave birth in the past 12 months Now married:
0.0% (0)Unmarried:
100.0% (22)
Women who did not give birth in the past 12 months Now married:
35.2% (496)Unmarried:
64.8% (911)
Marital status - Hispanic or Latino population 15 years and over
Males 52.7% Never married36.4% Now married3.3% Separated2.2% Widowed5.4% DivorcedFemales 49.6% Never married29.3% Now married5.7% Separated1.6% Widowed13.9% DivorcedWomen who gave birth in the past 12 months Now married:
25.0% (25)Unmarried:
75.0% (76)
Women who did not give birth in the past 12 months Now married:
30.4% (458)Unmarried:
69.6% (1,052)
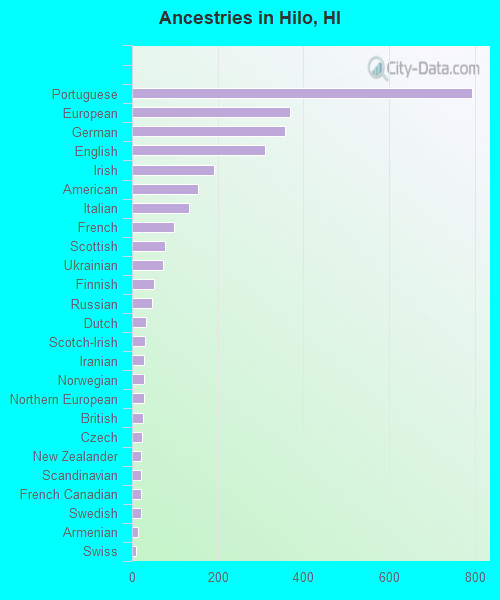
Ancestries in Hilo
794 3.5% Portuguese369 1.6% European357 1.6% German310 1.4% English192 0.8% Irish154 0.7% American133 0.6% Italian97 0.4% French76 0.3% Scottish73 0.3% Ukrainian51 0.2% Finnish47 0.2% Russian32 0.1% Dutch31 0.1% Scotch-Irish29 0.1% Iranian28 0.1% Norwegian27 0.1% Northern European26 0.1% British23 0.1% Czech22 0.10% New Zealander22 0.10% Scandinavian20 0.09% French Canadian20 0.09% Swedish14 0.06% Armenian10 0.04% Swiss10 0.04% Welsh9 0.04% Croatian9 0.04% Polish9 0.04% Slovak6 0.03% Austrian5 0.02% Jamaican3 0.01% Hungarian3 0.01% Slavic
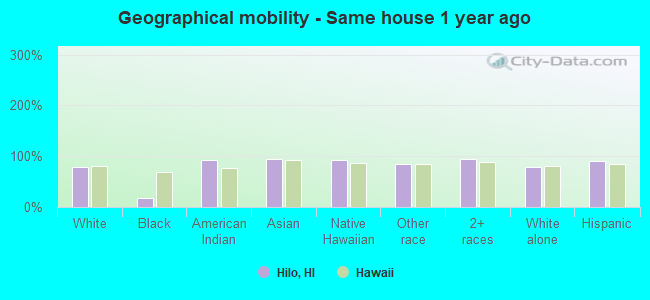
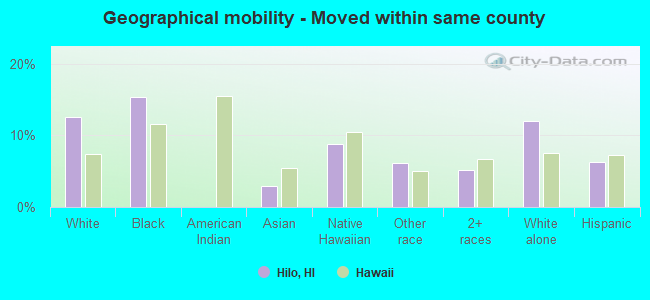
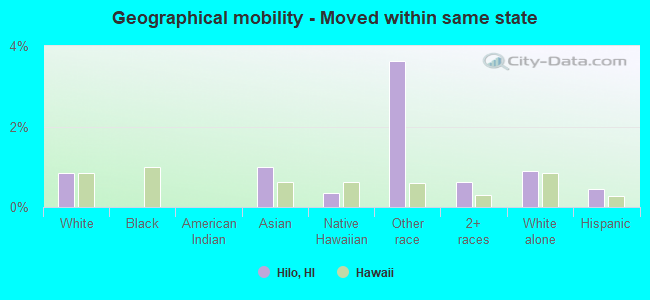
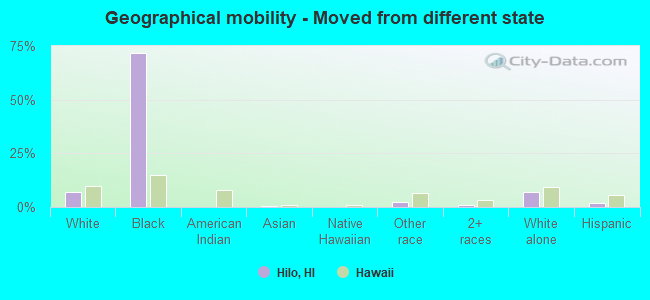
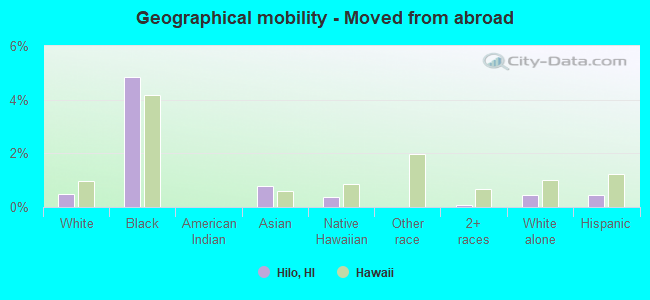
Geographical mobility in Hilo Same house 1 year ago 6,311 78.0% White (Caucasian)50 17.0% Black or African American21 93.1% American Indian / Alaska Native11,652 94.7% Asian5,744 92.3% Native Hawaiian / Pacific Islander353 84.6% Other race19,421 94.0% Two or more races6,031 79.0% White alone, not Hispanic / Latino5,680 91.1% Hispanic or LatinoMoved within same county 1,018 12.6% White / Caucasian45 15.4% Black or African American362 2.9% Asian548 8.8% Native Hawaiian / Pacific Islander26 6.2% Other race1,061 5.1% Two or more races921 12.1% White alone, not Hispanic / Latino390 6.3% Hispanic or LatinoMoved within same state 68 0.8% White / Caucasian122 1.0% Asian22 0.4% Native Hawaiian / Pacific Islander15 3.6% Other race129 0.6% Two or more races68 0.9% White alone, not Hispanic / Latino28 0.4% Hispanic or LatinoMoved from different state 552 6.8% White / Caucasian211 71.8% Black or African American81 0.7% Asian8 0.1% Native Hawaiian / Pacific Islander10 2.4% Other race197 1.0% Two or more races524 6.9% White alone, not Hispanic / Latino117 1.9% Hispanic or LatinoMoved from abroad 38 0.5% White14 4.9% Black or African American95 0.8% Asian23 0.4% Native Hawaiian / Pacific Islander17 0.1% Two or more races35 0.5% White alone, not Hispanic / Latino27 0.4% Hispanic or Latino
Children Nativity (place of birth) in Hilo
Children under 6 years - Living with two parents Both parents native 773 100.0% NativeBoth parents foreign-born 113 91.1% Native11 8.9% Foreign-bornOne native, one foreign-born parent 241 100.0% NativeChildren under 6 years - Living with one parent Native parent 816 100.0% NativeForeign-born parent 36 26.6% Native98 73.4% Foreign-bornChildren 6 to 17 years - Living with two parents Both parents native 3,457 99.7% Native11 0.3% Foreign-bornBoth parents foreign-born 345 79.2% Native90 20.8% Foreign-bornOne native, one foreign-born parent 64 64.9% Native35 35.1% Foreign-bornChildren 6 to 17 years - Living with one parent Native parent 2,977 98.5% Native46 1.5% Foreign-bornForeign-born parent 99 100.0% Native
Grandparents responsible for own grandchildren in Hilo
Grandparents (30 to 59 years) White / Caucasian 29 57.1% Responsible for grandchildren22 42.9% Not responsible for grandchildrenAsian 19 14.6% Responsible for grandchildren109 85.4% Not responsible for grandchildrenNative Hawaiian / Pacific Islander 16 20.3% Responsible for grandchildren64 79.7% Not responsible for grandchildrenTwo or more races 95 62.1% Responsible for grandchildren58 37.9% Not responsible for grandchildrenWhite alone, not Hispanic / Latino 27 56.5% Responsible for grandchildren21 43.5% Not responsible for grandchildrenHispanic or Latino 37 100.0% Responsible for grandchildrenGrandparents (60 years and over) White / Caucasian 10 5.6% Responsible for grandchildren165 94.4% Not responsible for grandchildrenAsian 62 17.5% Responsible for grandchildren295 82.5% Not responsible for grandchildrenNative Hawaiian / Pacific Islander 125 52.3% Responsible for grandchildren114 47.7% Not responsible for grandchildrenTwo or more races 54 21.8% Responsible for grandchildren192 78.2% Not responsible for grandchildrenWhite alone, not Hispanic / Latino 5 3.0% Responsible for grandchildren164 97.0% Not responsible for grandchildrenHispanic or Latino 1 6.1% Responsible for grandchildren10 93.9% Not responsible for grandchildren