Races in Hillsmere Shores, Maryland (MD) Detailed Stats
Ancestries, Foreign-born residents, place of birth

Recent posts about races in Hillsmere Shores, Maryland on our local forum with over 2,400,000 registered users:
 | advice for moving to Annapolis? (18 replies) |
| Help! Need Advice & Roommate (0 replies) |
4.2% of Hillsmere Shores, MD residents are foreign-born (1.8% born in Europe, 1.2% born in Asia, 0.9% born in Latin America), which is 284.1% less than the foreign-born rate of 16.0% across the entire state of Maryland.
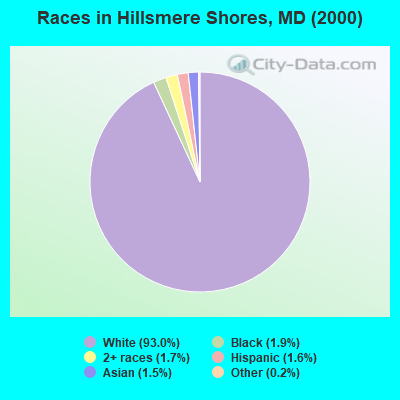
Race distribution in Hillsmere Shores

- 2,76893.0%White alone
- 571.9%Black alone
- 501.7%Two or more races
- 491.6%Hispanic
- 461.5%Asian alone
- 50.2%Other race alone
- 20.07%American Indian alone
2000
2022
-
- 3,286,54762.1%White alone
- 1,464,73527.7%Black alone
- 227,9164.3%Hispanic
- 209,7384.0%Asian alone
- 82,9461.6%Two or more races
- 13,3120.3%American Indian alone
- 9,3790.2%Other race alone
- 1,9130.04%Native Hawaiian and Other
Pacific Islander alone

-
- 2,906,49247.1%White alone
- 1,800,91429.2%Black alone
- 705,84211.4%Hispanic
- 401,8186.5%Asian alone
- 291,3174.7%Two or more races
- 46,9300.8%Other race alone
- 8,9300.1%American Indian alone
- 2,4170.04%Native Hawaiian and Other
Pacific Islander alone

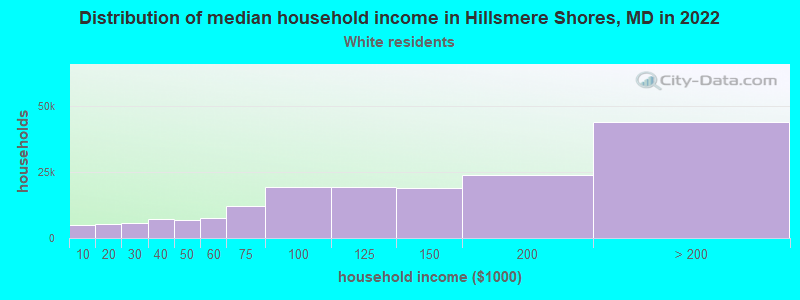
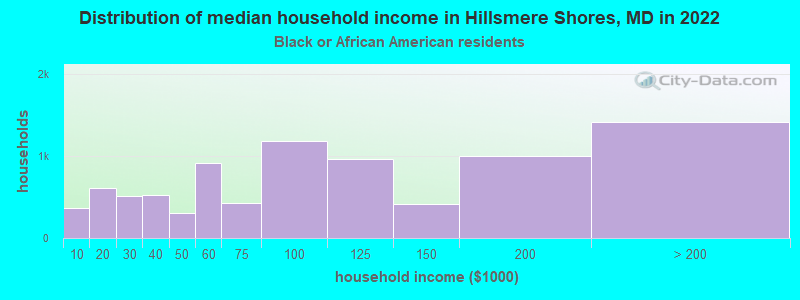
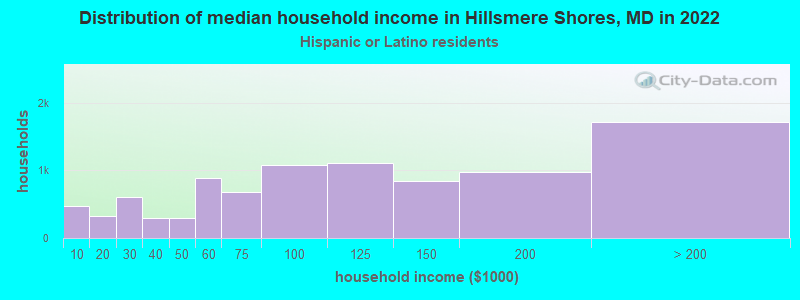
Income and house value in Hillsmere Shores
- Median household income in 2022
- $138,918White non-Hispanic householders
- $17,423Black householders
- $66,998Hispanic or Latino race householders
- Median 2022 house value
- $528,611White Non-Hispanic householders
- $503,384Black or African American householders
- $652,428Hispanic or Latino householders
Household income for White non-Hispanic householders
Household income for Black householders
Household income for Hispanic or Latino race householders
Foreign-born residents in Hillsmere Shores
124 residents are foreign born (1.8% Europe, 1.2% Asia, 0.9% Latin America).
| This city: | 4.2% |
| Maryland: | 9.8% |
Ancestries in Hillsmere Shores

- 60317.5%Irish
- 54315.7%German
- 53015.3%English
- 46413.4%Other
- 2858.3%Italian
- 1464.2%Polish
- 1333.9%United States
- 882.5%Greek
- 872.5%French
- 872.5%Scotch-Irish
- 772.2%Scottish
- 752.2%Danish
- 601.7%Norwegian
- 561.6%Dutch
- 401.2%Welsh
- 371.1%Russian
- 351.0%Czech
- 300.9%Swiss
- 220.6%Hungarian
- 190.6%Swedish
- 150.4%French Canadian
- 130.4%Ukrainian
- 80.2%Slovak

Zip codes: 21403.