Races in Hillside, Illinois (IL) Detailed Stats
Data:
Races - White alone (%)
Races - White alone (% change since 2000)
Races - Black alone (%)
Races - Black alone (% change since 2000)
Races - American Indian alone (%)
Races - American Indian alone (% change since 2000)
Races - Asian alone (%)
Races - Asian alone (% change since 2000)
Races - Hispanic (%)
Races - Hispanic (% change since 2000)
Races - Native Hawaiian and Other Pacific Islander alone (%)
Races - Native Hawaiian and Other Pacific Islander alone (% change since 2000)
Races - Two or more races(%)
Races - Two or more races(% change since 2000)
Races - Other race alone (%)
Races - Other race alone (% change since 2000)
Racial diversity
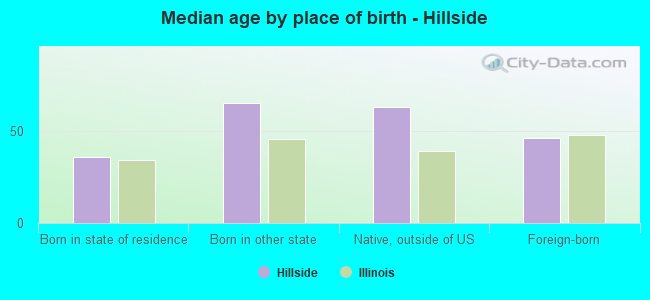
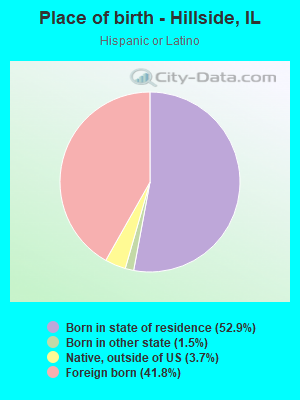
Place of birth - Born in state of residence (%)
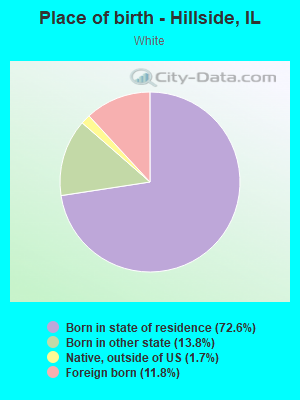
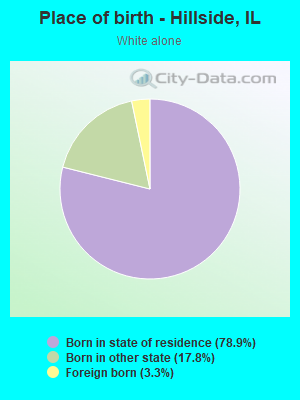
Place of birth - Born in state of residence (%) - White
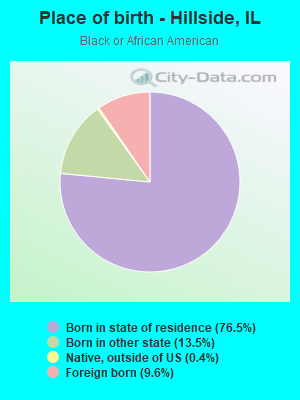
Place of birth - Born in state of residence (%) - Black or African American
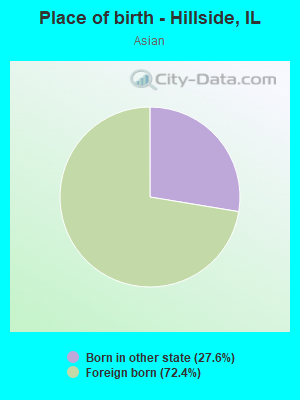
Place of birth - Born in state of residence (%) - Asian
Place of birth - Born in state of residence (%) - Hispanic or Latino
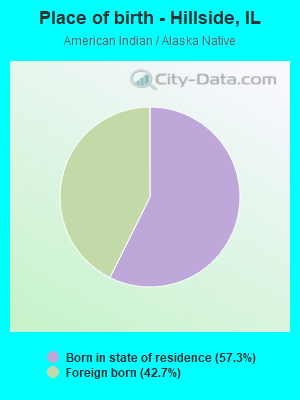
Place of birth - Born in state of residence (%) - American Indian and Alaska Native
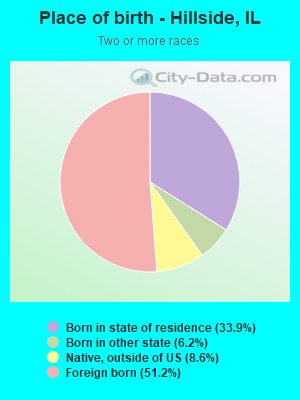
Place of birth - Born in state of residence (%) - Multirace
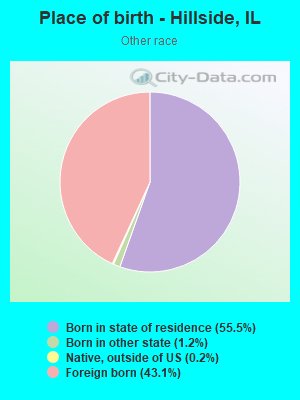
Place of birth - Born in state of residence (%) - Other Race
Place of birth - Born in other state (%)
Place of birth - Born in other state (%) - White
Place of birth - Born in other state (%) - Black or African American
Place of birth - Born in other state (%) - Asian
Place of birth - Born in other state (%) - Hispanic or Latino
Place of birth - Born in other state (%) - American Indian and Alaska Native
Place of birth - Born in other state (%) - Multirace
Place of birth - Born in other state (%) - Other Race
Place of birth - Native, outside of US (%)
Place of birth - Native, outside of US (%) - White
Place of birth - Native, outside of US (%) - Black or African American
Place of birth - Native, outside of US (%) - Asian
Place of birth - Native, outside of US (%) - Hispanic or Latino
Place of birth - Native, outside of US (%) - American Indian and Alaska Native
Place of birth - Native, outside of US (%) - Multirace
Place of birth - Native, outside of US (%) - Other Race
Place of birth - Foreign born (%)
Place of birth - Foreign born (%) - White
Place of birth - Foreign born (%) - Black or African American
Place of birth - Foreign born (%) - Asian
Place of birth - Foreign born (%) - Hispanic or Latino
Place of birth - Foreign born (%) - American Indian and Alaska Native
Place of birth - Foreign born (%) - Multirace
Place of birth - Foreign born (%) - Other Race
Residents speaking English at home (%)
Residents speaking English at home - Born in the United States (%)
Residents speaking English at home - Native, born elsewhere (%)
Residents speaking English at home - Foreign born (%)
Residents speaking Spanish at home (%)
Residents speaking Spanish at home - Born in the United States (%)
Residents speaking Spanish at home - Native, born elsewhere (%)
Residents speaking Spanish at home - Foreign born (%)
Residents speaking other language at home (%)
Residents speaking other language at home - Born in the United States (%)
Residents speaking other language at home - Native, born elsewhere (%)
Residents speaking other language at home - Foreign born (%)
Marital status - Never married (%)
Marital status - Now married (%)
Marital status - Separated (%)
Marital status - Widowed (%)
Marital status - Divorced (%)
Ancestries Reported - Arab (%)
Ancestries Reported - Czech (%)
Ancestries Reported - Danish (%)
Ancestries Reported - Dutch (%)
Ancestries Reported - English (%)
Ancestries Reported - French (%)
Ancestries Reported - French Canadian (%)
Ancestries Reported - German (%)
Ancestries Reported - Greek (%)
Ancestries Reported - Hungarian (%)
Ancestries Reported - Irish (%)
Ancestries Reported - Italian (%)
Ancestries Reported - Lithuanian (%)
Ancestries Reported - Norwegian (%)
Ancestries Reported - Polish (%)
Ancestries Reported - Portuguese (%)
Ancestries Reported - Russian (%)
Ancestries Reported - Scotch-Irish (%)
Ancestries Reported - Scottish (%)
Ancestries Reported - Slovak (%)
Ancestries Reported - Subsaharan African (%)
Ancestries Reported - Swedish (%)
Ancestries Reported - Swiss (%)
Ancestries Reported - Ukrainian (%)
Ancestries Reported - United States (%)
Ancestries Reported - Welsh (%)
Ancestries Reported - West Indian (%)
Ancestries Reported - Other (%)
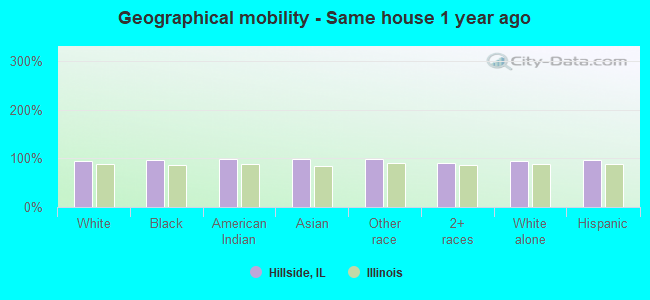
Geographical mobility - Same house 1 year ago (%)
Geographical mobility - Same house 1 year ago (%) - White
Geographical mobility - Same house 1 year ago (%) - Black or African American
Geographical mobility - Same house 1 year ago (%) - Asian
Geographical mobility - Same house 1 year ago (%) - Hispanic or Latino
Geographical mobility - Same house 1 year ago (%) - American Indian and Alaska Native
Geographical mobility - Same house 1 year ago (%) - Multirace
Geographical mobility - Same house 1 year ago (%) - Other Race
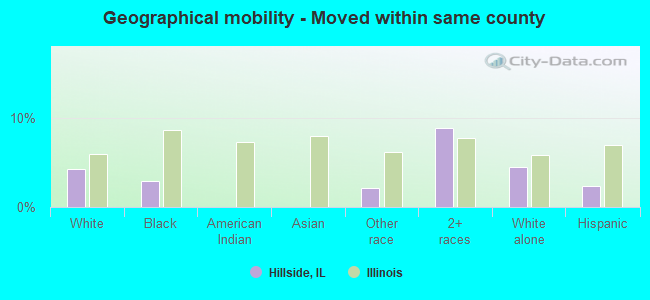
Geographical mobility - Moved within same county (%)
Geographical mobility - Moved within same county (%) - White
Geographical mobility - Moved within same county (%) - Black or African American
Geographical mobility - Moved within same county (%) - Asian
Geographical mobility - Moved within same county (%) - Hispanic or Latino
Geographical mobility - Moved within same county (%) - American Indian and Alaska Native
Geographical mobility - Moved within same county (%) - Multirace
Geographical mobility - Moved within same county (%) - Other Race
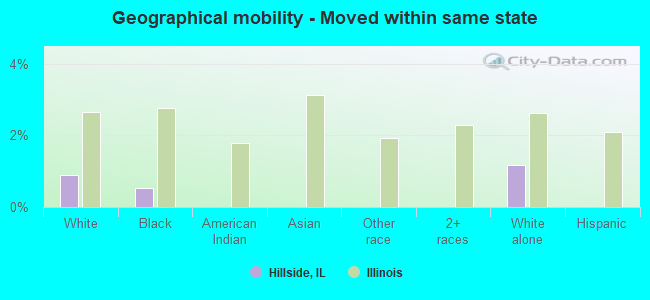
Geographical mobility - Moved from different county within same state (%)
Geographical mobility - Moved from different county within same state (%) - White
Geographical mobility - Moved from different county within same state (%) - Black or African American
Geographical mobility - Moved from different county within same state (%) - Asian
Geographical mobility - Moved from different county within same state (%) - Hispanic or Latino
Geographical mobility - Moved from different county within same state (%) - American Indian and Alaska Native
Geographical mobility - Moved from different county within same state (%) - Multirace
Geographical mobility - Moved from different county within same state (%) - Other Race
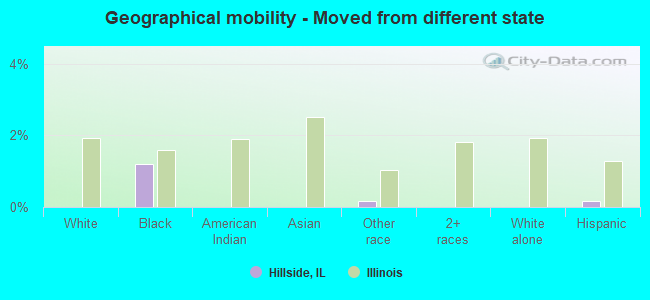
Geographical mobility - Moved from different state (%)
Geographical mobility - Moved from different state (%) - White
Geographical mobility - Moved from different state (%) - Black or African American
Geographical mobility - Moved from different state (%) - Asian
Geographical mobility - Moved from different state (%) - Hispanic or Latino
Geographical mobility - Moved from different state (%) - American Indian and Alaska Native
Geographical mobility - Moved from different state (%) - Multirace
Geographical mobility - Moved from different state (%) - Other Race
Geographical mobility - Moved from abroad (%)
Geographical mobility - Moved from abroad (%) - White
Geographical mobility - Moved from abroad (%) - Black or African American
Geographical mobility - Moved from abroad (%) - Asian
Geographical mobility - Moved from abroad (%) - Hispanic or Latino
Geographical mobility - Moved from abroad (%) - American Indian and Alaska Native
Geographical mobility - Moved from abroad (%) - Multirace
Geographical mobility - Moved from abroad (%) - Other Race
Place of birth for the foreign-born population - Ireland (%)
Place of birth for the foreign-born population - Denmark (%)
Place of birth for the foreign-born population - Norway (%)
Place of birth for the foreign-born population - Sweden (%)
Place of birth for the foreign-born population - United Kingdom (%)
Place of birth for the foreign-born population - England (%)
Place of birth for the foreign-born population - Scotland (%)
Place of birth for the foreign-born population - Other Northern Europe (%)
Place of birth for the foreign-born population - Austria (%)
Place of birth for the foreign-born population - Belgium (%)
Place of birth for the foreign-born population - France (%)
Place of birth for the foreign-born population - Germany (%)
Place of birth for the foreign-born population - Netherlands (%)
Place of birth for the foreign-born population - Switzerland (%)
Place of birth for the foreign-born population - Other Western Europe (%)
Place of birth for the foreign-born population - Greece (%)
Place of birth for the foreign-born population - Italy (%)
Place of birth for the foreign-born population - Portugal (%)
Place of birth for the foreign-born population - Spain (%)
Place of birth for the foreign-born population - Other Southern Europe (%)
Place of birth for the foreign-born population - Albania (%)
Place of birth for the foreign-born population - Belarus (%)
Place of birth for the foreign-born population - Bosnia and Herzegovina (%)
Place of birth for the foreign-born population - Bulgaria (%)
Place of birth for the foreign-born population - Croatia (%)
Place of birth for the foreign-born population - Czechoslovakia (%)
Place of birth for the foreign-born population - Hungary (%)
Place of birth for the foreign-born population - Latvia (%)
Place of birth for the foreign-born population - Lithuania (%)
Place of birth for the foreign-born population - North Macedonia (Macedonia) (%)
Place of birth for the foreign-born population - Moldova (%)
Place of birth for the foreign-born population - Poland (%)
Place of birth for the foreign-born population - Romania (%)
Place of birth for the foreign-born population - Russia (%)
Place of birth for the foreign-born population - Serbia (%)
Place of birth for the foreign-born population - Ukraine (%)
Place of birth for the foreign-born population - Other Eastern Europe (%)
Place of birth for the foreign-born population - China (%)
Place of birth for the foreign-born population - Hong Kong (%)
Place of birth for the foreign-born population - Taiwan (%)
Place of birth for the foreign-born population - Japan (%)
Place of birth for the foreign-born population - Korea (%)
Place of birth for the foreign-born population - Other Eastern Asia (%)
Place of birth for the foreign-born population - Afghanistan (%)
Place of birth for the foreign-born population - Bangladesh (%)
Place of birth for the foreign-born population - India (%)
Place of birth for the foreign-born population - Iran (%)
Place of birth for the foreign-born population - Kazakhstan (%)
Place of birth for the foreign-born population - Nepal (%)
Place of birth for the foreign-born population - Pakistan (%)
Place of birth for the foreign-born population - Sri Lanka (%)
Place of birth for the foreign-born population - Uzbekistan (%)
Place of birth for the foreign-born population - Other South Central Asia (%)
Place of birth for the foreign-born population - Burma (%)
Place of birth for the foreign-born population - Cambodia (%)
Place of birth for the foreign-born population - Indonesia (%)
Place of birth for the foreign-born population - Laos (%)
Place of birth for the foreign-born population - Malaysia (%)
Place of birth for the foreign-born population - Philippines (%)
Place of birth for the foreign-born population - Singapore (%)
Place of birth for the foreign-born population - Thailand (%)
Place of birth for the foreign-born population - Vietnam (%)
Place of birth for the foreign-born population - Other South Eastern Asia (%)
Place of birth for the foreign-born population - Armenia (%)
Place of birth for the foreign-born population - Iraq (%)
Place of birth for the foreign-born population - Israel (%)
Place of birth for the foreign-born population - Jordan (%)
Place of birth for the foreign-born population - Kuwait (%)
Place of birth for the foreign-born population - Lebanon (%)
Place of birth for the foreign-born population - Saudi Arabia (%)
Place of birth for the foreign-born population - Syria (%)
Place of birth for the foreign-born population - Turkey (%)
Place of birth for the foreign-born population - Yemen (%)
Place of birth for the foreign-born population - Other Western Asia (%)
Place of birth for the foreign-born population - Eritrea (%)
Place of birth for the foreign-born population - Ethiopia (%)
Place of birth for the foreign-born population - Kenya (%)
Place of birth for the foreign-born population - Somalia (%)
Place of birth for the foreign-born population - Uganda (%)
Place of birth for the foreign-born population - Zimbabwe (%)
Place of birth for the foreign-born population - Other Eastern Africa (%)
Place of birth for the foreign-born population - Cameroon (%)
Place of birth for the foreign-born population - Congo (%)
Place of birth for the foreign-born population - Democratic Republic of Congo (Zaire) (%)
Place of birth for the foreign-born population - Other Middle Africa (%)
Place of birth for the foreign-born population - Egypt (%)
Place of birth for the foreign-born population - Morocco (%)
Place of birth for the foreign-born population - Sudan (%)
Place of birth for the foreign-born population - Other Northern Africa (%)
Place of birth for the foreign-born population - South Africa (%)
Place of birth for the foreign-born population - Other Southern Africa (%)
Place of birth for the foreign-born population - Cabo Verde (%)
Place of birth for the foreign-born population - Ghana (%)
Place of birth for the foreign-born population - Liberia (%)
Place of birth for the foreign-born population - Nigeria (%)
Place of birth for the foreign-born population - Senegal (%)
Place of birth for the foreign-born population - Sierra Leone (%)
Place of birth for the foreign-born population - Other Western Africa (%)
Place of birth for the foreign-born population - Australia (%)
Place of birth for the foreign-born population - New Zealand (%)
Place of birth for the foreign-born population - Fiji (%)
Place of birth for the foreign-born population - Micronesia (%)
Place of birth for the foreign-born population - Bahamas (%)
Place of birth for the foreign-born population - Barbados (%)
Place of birth for the foreign-born population - Cuba (%)
Place of birth for the foreign-born population - Dominica (%)
Place of birth for the foreign-born population - Dominican Republic (%)
Place of birth for the foreign-born population - Grenada (%)
Place of birth for the foreign-born population - Haiti (%)
Place of birth for the foreign-born population - Jamaica (%)
Place of birth for the foreign-born population - St. Vincent and the Grenadines (%)
Place of birth for the foreign-born population - Trinidad and Tobago (%)
Place of birth for the foreign-born population - West Indies (%)
Place of birth for the foreign-born population - Other Caribbean (%)
Place of birth for the foreign-born population - Belize (%)
Place of birth for the foreign-born population - Costa Rica (%)
Place of birth for the foreign-born population - El Salvador (%)
Place of birth for the foreign-born population - Guatemala (%)
Place of birth for the foreign-born population - Honduras (%)
Place of birth for the foreign-born population - Mexico (%)
Place of birth for the foreign-born population - Nicaragua (%)
Place of birth for the foreign-born population - Panama (%)
Place of birth for the foreign-born population - Other Central America (%)
Place of birth for the foreign-born population - Argentina (%)
Place of birth for the foreign-born population - Bolivia (%)
Place of birth for the foreign-born population - Brazil (%)
Place of birth for the foreign-born population - Chile (%)
Place of birth for the foreign-born population - Colombia (%)
Place of birth for the foreign-born population - Ecuador (%)
Place of birth for the foreign-born population - Guyana (%)
Place of birth for the foreign-born population - Peru (%)
Place of birth for the foreign-born population - Uruguay (%)
Place of birth for the foreign-born population - Venezuela (%)
Place of birth for the foreign-born population - Other South America (%)
Place of birth for the foreign-born population - Canada (%)
Place of birth for the foreign-born population - Other Northern America (%)
Place of birth for the foreign-born population - Other (%)
Latest news about races in Hillside, IL collected exclusively by city-data.com from local newspapers, TV, and radio stations
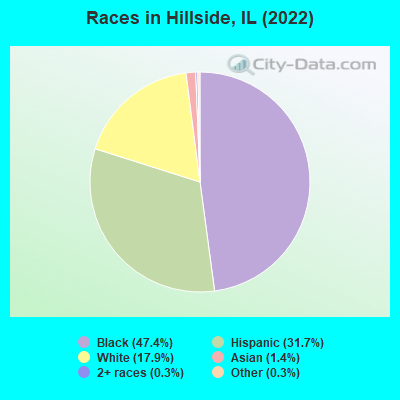
According to 2022 data, the most numerous races in Hillside, IL are White alone (1,435 residents), Hispanic (2,545 residents), and Black alone (3,810 residents). 62.7% of Hillside residents speak English at home. 19.8% of Hillside, IL residents are foreign-born (13.1% born in Latin America, 4.9% born in Africa), which is 29.2% greater than the foreign-born rate of 14.0% across the entire state of Illinois.
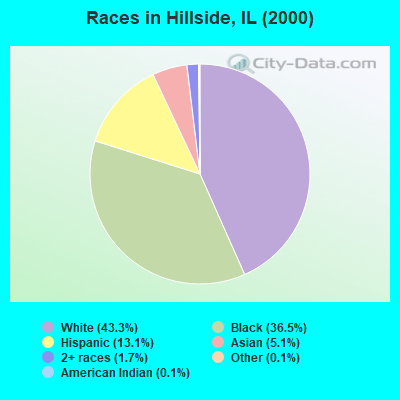
Race distribution in Hillside
2000 2022
8,424,140 67.8% White alone 1,856,152 14.9% Black alone 1,530,262 12.3% Hispanic 419,916 3.4% Asian alone 153,996 1.2% Two or more races 13,479 0.1% Other race alone 18,232 0.1% American Indian alone 3,116 0.03% Native Hawaiian and Other
7,356,301 58.5% White alone 2,299,726 18.3% Hispanic 1,660,423 13.2% Black alone 747,296 5.9% Asian alone 458,599 3.6% Two or more races 45,386 0.4% Other race alone 10,405 0.08% American Indian alone 3,896 0.03% Native Hawaiian and Other
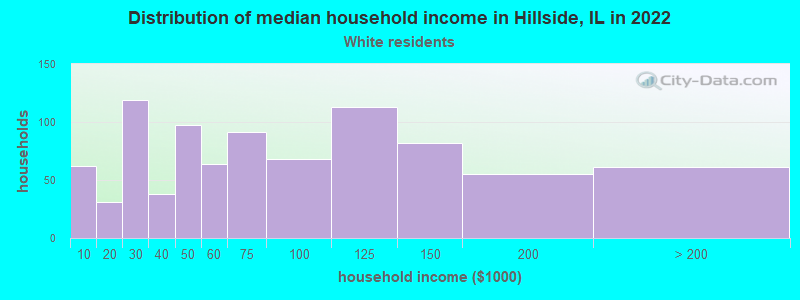
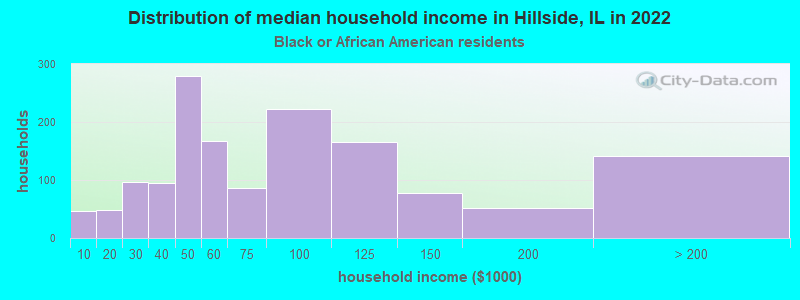
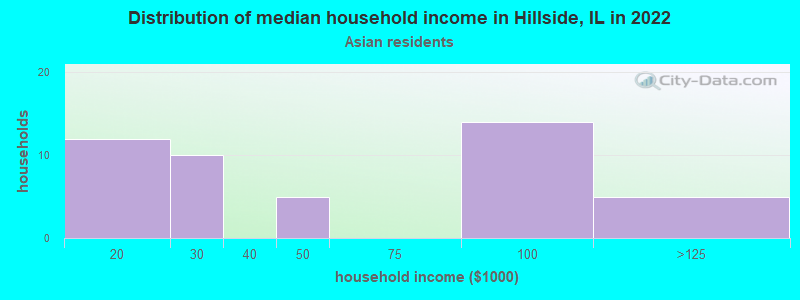
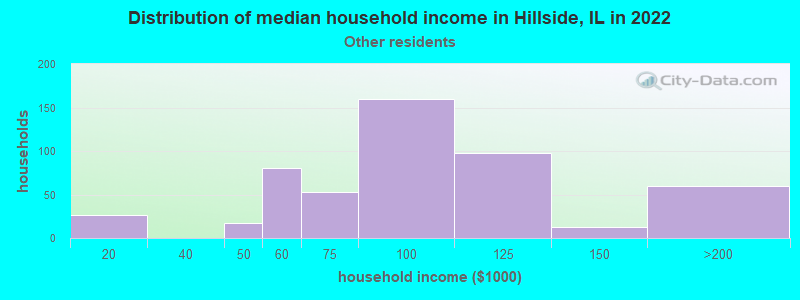
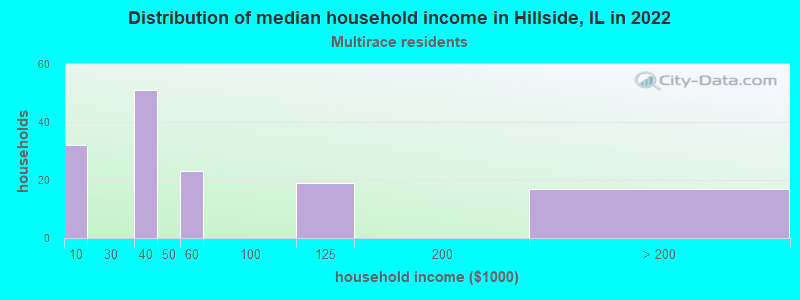
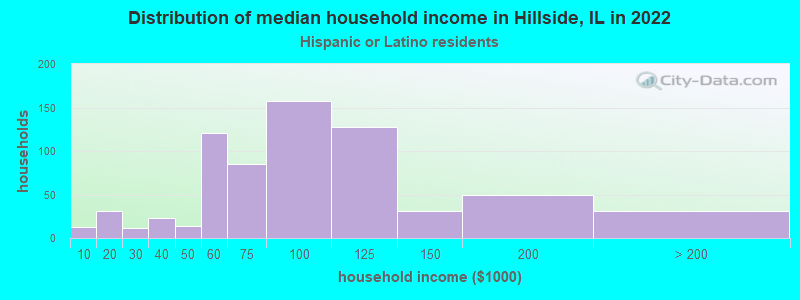
Income and house value in Hillside Median household income in 2022 $56,252 White non-Hispanic householders$64,075 Black householders$82,165 Some other race householders$80,737 Hispanic or Latino race householdersMedian 2022 house value $228,649 White Non-Hispanic householders$244,906 Black or African American householders $235,991 Asian householders$214,140 Some other race householders$257,842 Two or more races householders$229,523 Hispanic or Latino householders
Median age by race in Hillside
54.0 Median age for White residents49.2 61.1 37.8 Median age for Black or African American residents31.3 43.1 18.1 Median age for American Indian / Alaska Native residents-736,736,736.0 -641,399,416.3 30.2 Median age for Asian residents30.2 31.0 -687,999,999.3 Median age for Native Hawaiian / Pacific Islander residents-918,721,460.3 -610,229,276.3 36.2 Median age for Other race residents36.4 36.0 35.3 Median age for Two or more races residents29.0 42.2 62.9 Median age for White alone residents60.8 67.2 34.5 Median age for Hispanic or Latino residents32.4 34.8
Owner/renter occupied households by race in Hillside
House owners and renters - White residents 594 67.2% Owner occupied290 32.8% Renter occupiedHouse owners and renters - Black or African American residents 826 56.2% Owner occupied644 43.8% Renter occupiedHouse owners and renters - American Indian / Alaska Native residents 19 100.0% Owner occupiedHouse owners and renters - Asian residents 40 83.9% Owner occupied8 16.1% Renter occupiedHouse owners and renters - Other race residents 345 68.3% Owner occupied160 31.7% Renter occupiedHouse owners and renters - Two or more races residents 59 45.7% Owner occupied70 54.3% Renter occupiedHouse owners and renters - White alone residents 511 63.3% Owner occupied296 36.7% Renter occupiedHouse owners and renters - Hispanic or Latino residents 498 71.7% Owner occupied196 28.3% Renter occupied
Language usage in Hillside
English speakers - Total 62.7% of residents of Hillside speak English at home.
28.3% of residents speak Spanish at home 1,129 52.3% Speak English very well1,028 47.7% Speak English less than very well8.9% of residents speak other language at home 247 36.3% Speak English very well434 63.7% Speak English less than very well
English speakers - Born in the United States 89.9% of residents of Hillside speak English at home.
9.2% of residents speak Spanish at home 78 98.7% Speak English very well1 1.3% Speak English less than very well
English speakers - Native, born elsewhere 52.2% of residents of Hillside speak English at home.
44.4% of residents speak Spanish at home 3 7.5% Speak English very well37 92.5% Speak English less than very well
English speakers - Foreign-born 3.2% of residents of Hillside speak English at home.
65.3% of residents speak Spanish at home 285 27.5% Speak English very well752 72.5% Speak English less than very well32.1% of residents speak other language at home 91 17.9% Speak English very well418 82.1% Speak English less than very well
White (Caucasian) - Speak only English Native:
84.2% (1,311)Foreign-born:
1.9% (4)
White (Caucasian) - Speak another language Native:
14.5% (226)Foreign-born:
97.2% (208)
Black or African American - Speak only English Native:
95.3% (3,195)Foreign-born:
5.6% (21)
Black or African American - Speak another language Native:
4.7% (158)Foreign-born:
86.9% (326)
American Indian / Alaska Native - Speak another language Native:
100.0% (28)Foreign-born:
100.0% (38)
Other race - Speak only English Native:
13.0% (123)Foreign-born:
4.1% (32)
Other race - Speak another language Native:
85.9% (809)Foreign-born:
96.0% (758)
Two or more races - Speak another language Native:
77.0% (103)Foreign-born:
100.0% (179)
White alone - Speak only English Native:
94.4% (1,298)Foreign-born:
9.5% (4)
White alone - Speak another language Native:
5.3% (73)Foreign-born:
91.1% (43)
Hispanic or Latino - Speak only English Native:
19.6% (255)Foreign-born:
2.6% (28)
Hispanic or Latino - Speak another language Native:
79.6% (1,036)Foreign-born:
97.6% (1,038)
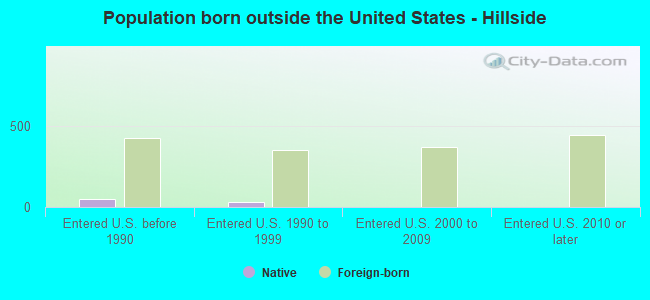
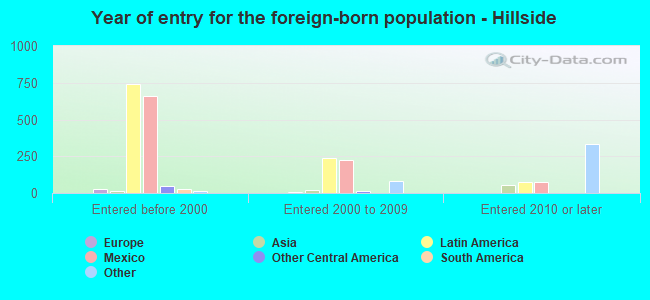
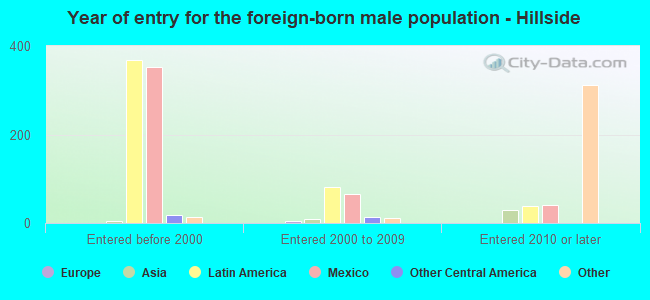
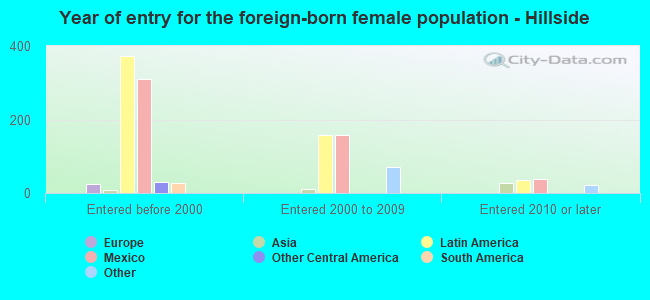
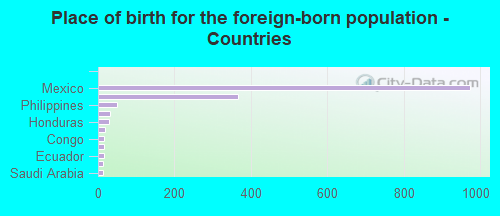
Foreign-born residents in Hillside 1,587 residents are foreign born (13.1% Latin America , 4.9% Africa ).
This city:
19.8%Illinois:
14.1%
Marital status for residents in Hillside Marital status - White (Caucasian) population 15 years and over
Males 39.8% Never married38.4% Now married4.1% Separated5.6% Widowed12.2% DivorcedFemales 39.9% Never married30.2% Now married1.0% Separated12.4% Widowed16.6% DivorcedWomen who gave birth in the past 12 months Now married:
100.0% (27)Unmarried:
0.0% (0)
Women who did not give birth in the past 12 months Now married:
23.8% (57)Unmarried:
76.2% (182)
Marital status - Black or African American population 15 years and over
Males 55.6% Never married31.5% Now married1.3% Separated2.9% Widowed8.7% DivorcedFemales 44.8% Never married32.3% Now married1.9% Separated3.5% Widowed17.5% DivorcedWomen who gave birth in the past 12 months Now married:
39.4% (35)Unmarried:
60.6% (54)
Women who did not give birth in the past 12 months Now married:
18.4% (135)Unmarried:
81.6% (598)
Marital status - American Indian / Alaska Native population 15 years and over
Males 0.0% Never married100.0% Now married0.0% Separated0.0% Widowed0.0% DivorcedFemales 58.6% Never married41.4% Now married0.0% Separated0.0% Widowed0.0% DivorcedWomen who did not give birth in the past 12 months Now married:
41.4% (22)Unmarried:
58.6% (31)
Marital status - Asian population 15 years and over
Males 0.0% Never married100.0% Now married0.0% Separated0.0% Widowed0.0% DivorcedFemales 11.6% Never married69.8% Now married0.0% Separated0.0% Widowed18.6% DivorcedWomen who gave birth in the past 12 months Now married:
100.0% (25)Unmarried:
0.0% (0)
Women who did not give birth in the past 12 months Now married:
38.5% (5)Unmarried:
61.5% (8)
Marital status - Other race population 15 years and over
Males 14.2% Never married66.3% Now married10.0% Separated0.0% Widowed9.5% DivorcedFemales 25.6% Never married61.0% Now married6.2% Separated0.0% Widowed7.2% DivorcedWomen who did not give birth in the past 12 months Now married:
45.6% (185)Unmarried:
54.4% (221)
Marital status - Two or more races population 15 years and over
Males 63.0% Never married37.0% Now married0.0% Separated0.0% Widowed0.0% DivorcedFemales 26.7% Never married73.3% Now married0.0% Separated0.0% Widowed0.0% DivorcedWomen who did not give birth in the past 12 months Now married:
73.0% (64)Unmarried:
27.0% (24)
Marital status - White alone, not Hispanic / Latino population 15 years and over
Males 43.3% Never married33.6% Now married3.9% Separated7.6% Widowed11.5% DivorcedFemales 35.8% Never married26.6% Now married1.2% Separated15.6% Widowed20.8% DivorcedWomen who did not give birth in the past 12 months Now married:
25.8% (40)Unmarried:
74.2% (115)
Marital status - Hispanic or Latino population 15 years and over
Males 23.5% Never married60.4% Now married7.0% Separated0.0% Widowed9.1% DivorcedFemales 32.2% Never married58.3% Now married4.4% Separated0.0% Widowed5.1% DivorcedWomen who gave birth in the past 12 months Now married:
100.0% (32)Unmarried:
0.0% (0)
Women who did not give birth in the past 12 months Now married:
43.6% (247)Unmarried:
56.4% (319)
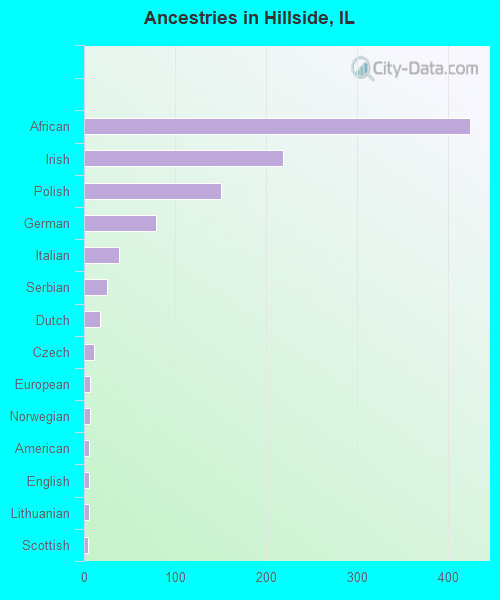
Ancestries in Hillside
424 7.4% African219 3.8% Irish151 2.6% Polish79 1.4% German38 0.7% Italian25 0.4% Serbian18 0.3% Dutch11 0.2% Czech7 0.1% European7 0.1% Norwegian6 0.1% American6 0.1% English6 0.1% Lithuanian4 0.07% Scottish
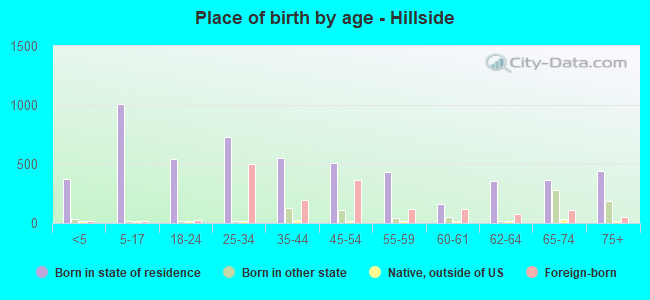
Children Nativity (place of birth) in Hillside
Children under 6 years - Living with two parents Both parents native 18 100.0% NativeBoth parents foreign-born 128 100.0% NativeOne native, one foreign-born parent 49 100.0% NativeChildren under 6 years - Living with one parent Native parent 146 100.0% NativeForeign-born parent 76 100.0% NativeChildren 6 to 17 years - Living with two parents Both parents native 295 100.0% NativeBoth parents foreign-born 197 100.0% NativeOne native, one foreign-born parent 99 100.0% NativeChildren 6 to 17 years - Living with one parent Native parent 324 100.0% NativeForeign-born parent 47 50.1% Native47 49.9% Foreign-born
Grandparents responsible for own grandchildren in Hillside
Grandparents (30 to 59 years) Black or African American 18 30.1% Responsible for grandchildren41 69.9% Not responsible for grandchildrenOther race 46 100.0% Not responsible for grandchildrenHispanic or Latino 38 100.0% Not responsible for grandchildrenGrandparents (60 years and over) Black or African American 46 29.0% Responsible for grandchildren114 71.0% Not responsible for grandchildrenOther race 114 100.0% Not responsible for grandchildrenHispanic or Latino 113 100.0% Not responsible for grandchildren