Races in Hiland Park, Florida (FL) Detailed Stats
Ancestries, Foreign-born residents, place of birth

Discuss Hiland Park, Florida races on our local forum with over 2,400,000 registered users
3.0% of Hiland Park, FL residents are foreign-born (2.3% born in Europe, 0.7% born in Asia), which is 599.3% less than the foreign-born rate of 21.0% across the entire state of Florida.
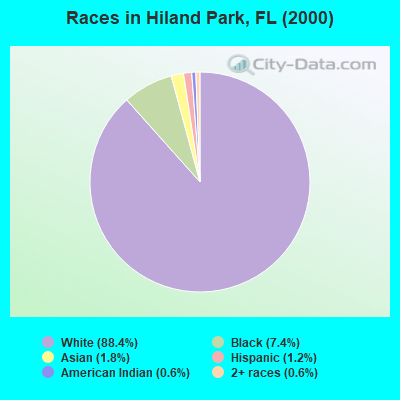
Race distribution in Hiland Park

- 88388.4%White alone
- 747.4%Black alone
- 181.8%Asian alone
- 121.2%Hispanic
- 60.6%Two or more races
- 60.6%American Indian alone
2000
2022
-
- 10,458,50965.4%White alone
- 2,682,71516.8%Hispanic
- 2,264,26814.2%Black alone
- 261,6931.6%Asian alone
- 236,9541.5%Two or more races
- 42,3580.3%American Indian alone
- 28,9940.2%Other race alone
- 6,8870.04%Native Hawaiian and Other
Pacific Islander alone

-
- 11,309,40350.8%White alone
- 6,025,03927.1%Hispanic
- 3,241,01514.6%Black alone
- 861,6303.9%Two or more races
- 623,6922.8%Asian alone
- 152,0540.7%Other race alone
- 22,5040.1%American Indian alone
- 9,4860.04%Native Hawaiian and Other
Pacific Islander alone

Income and house value in Hiland Park
- Median household income in 2022
- $73,618White non-Hispanic householders
- $14,653Black householders
- Median 2022 house value
- $324,758White Non-Hispanic householders
- $121,457Black or African American householders
Household income for White non-Hispanic householders

Household income for Black householders

Household income for American Indian and Alaska Native householders

Foreign-born residents in Hiland Park
30 residents are foreign born (2.3% Europe, 0.7% Asia).
| This city: | 3.0% |
| Florida: | 16.7% |
Ancestries in Hiland Park

- 18130.5%United States
- 14123.7%Other
- 6110.3%Irish
- 518.6%German
- 396.6%English
- 244.0%French Canadian
- 233.9%French
- 183.0%Italian
- 152.5%Scottish
- 101.7%Greek
- 101.7%Polish
- 81.3%Czech
- 81.3%Dutch
- 50.8%Scotch-Irish

Zip codes: 32405.