Races in Highwood, Illinois (IL) Detailed Stats
Data:
Races - White alone (%)
Races - White alone (% change since 2000)
Races - Black alone (%)
Races - Black alone (% change since 2000)
Races - American Indian alone (%)
Races - American Indian alone (% change since 2000)
Races - Asian alone (%)
Races - Asian alone (% change since 2000)
Races - Hispanic (%)
Races - Hispanic (% change since 2000)
Races - Native Hawaiian and Other Pacific Islander alone (%)
Races - Native Hawaiian and Other Pacific Islander alone (% change since 2000)
Races - Two or more races(%)
Races - Two or more races(% change since 2000)
Races - Other race alone (%)
Races - Other race alone (% change since 2000)
Racial diversity
Place of birth - Born in state of residence (%)
Place of birth - Born in state of residence (%) - White
Place of birth - Born in state of residence (%) - Black or African American
Place of birth - Born in state of residence (%) - Asian
Place of birth - Born in state of residence (%) - Hispanic or Latino
Place of birth - Born in state of residence (%) - American Indian and Alaska Native
Place of birth - Born in state of residence (%) - Multirace
Place of birth - Born in state of residence (%) - Other Race
Place of birth - Born in other state (%)
Place of birth - Born in other state (%) - White
Place of birth - Born in other state (%) - Black or African American
Place of birth - Born in other state (%) - Asian
Place of birth - Born in other state (%) - Hispanic or Latino
Place of birth - Born in other state (%) - American Indian and Alaska Native
Place of birth - Born in other state (%) - Multirace
Place of birth - Born in other state (%) - Other Race
Place of birth - Native, outside of US (%)
Place of birth - Native, outside of US (%) - White
Place of birth - Native, outside of US (%) - Black or African American
Place of birth - Native, outside of US (%) - Asian
Place of birth - Native, outside of US (%) - Hispanic or Latino
Place of birth - Native, outside of US (%) - American Indian and Alaska Native
Place of birth - Native, outside of US (%) - Multirace
Place of birth - Native, outside of US (%) - Other Race
Place of birth - Foreign born (%)
Place of birth - Foreign born (%) - White
Place of birth - Foreign born (%) - Black or African American
Place of birth - Foreign born (%) - Asian
Place of birth - Foreign born (%) - Hispanic or Latino
Place of birth - Foreign born (%) - American Indian and Alaska Native
Place of birth - Foreign born (%) - Multirace
Place of birth - Foreign born (%) - Other Race
Residents speaking English at home (%)
Residents speaking English at home - Born in the United States (%)
Residents speaking English at home - Native, born elsewhere (%)
Residents speaking English at home - Foreign born (%)
Residents speaking Spanish at home (%)
Residents speaking Spanish at home - Born in the United States (%)
Residents speaking Spanish at home - Native, born elsewhere (%)
Residents speaking Spanish at home - Foreign born (%)
Residents speaking other language at home (%)
Residents speaking other language at home - Born in the United States (%)
Residents speaking other language at home - Native, born elsewhere (%)
Residents speaking other language at home - Foreign born (%)
Marital status - Never married (%)
Marital status - Now married (%)
Marital status - Separated (%)
Marital status - Widowed (%)
Marital status - Divorced (%)
Ancestries Reported - Arab (%)
Ancestries Reported - Czech (%)
Ancestries Reported - Danish (%)
Ancestries Reported - Dutch (%)
Ancestries Reported - English (%)
Ancestries Reported - French (%)
Ancestries Reported - French Canadian (%)
Ancestries Reported - German (%)
Ancestries Reported - Greek (%)
Ancestries Reported - Hungarian (%)
Ancestries Reported - Irish (%)
Ancestries Reported - Italian (%)
Ancestries Reported - Lithuanian (%)
Ancestries Reported - Norwegian (%)
Ancestries Reported - Polish (%)
Ancestries Reported - Portuguese (%)
Ancestries Reported - Russian (%)
Ancestries Reported - Scotch-Irish (%)
Ancestries Reported - Scottish (%)
Ancestries Reported - Slovak (%)
Ancestries Reported - Subsaharan African (%)
Ancestries Reported - Swedish (%)
Ancestries Reported - Swiss (%)
Ancestries Reported - Ukrainian (%)
Ancestries Reported - United States (%)
Ancestries Reported - Welsh (%)
Ancestries Reported - West Indian (%)
Ancestries Reported - Other (%)
Geographical mobility - Same house 1 year ago (%)
Geographical mobility - Same house 1 year ago (%) - White
Geographical mobility - Same house 1 year ago (%) - Black or African American
Geographical mobility - Same house 1 year ago (%) - Asian
Geographical mobility - Same house 1 year ago (%) - Hispanic or Latino
Geographical mobility - Same house 1 year ago (%) - American Indian and Alaska Native
Geographical mobility - Same house 1 year ago (%) - Multirace
Geographical mobility - Same house 1 year ago (%) - Other Race
Geographical mobility - Moved within same county (%)
Geographical mobility - Moved within same county (%) - White
Geographical mobility - Moved within same county (%) - Black or African American
Geographical mobility - Moved within same county (%) - Asian
Geographical mobility - Moved within same county (%) - Hispanic or Latino
Geographical mobility - Moved within same county (%) - American Indian and Alaska Native
Geographical mobility - Moved within same county (%) - Multirace
Geographical mobility - Moved within same county (%) - Other Race
Geographical mobility - Moved from different county within same state (%)
Geographical mobility - Moved from different county within same state (%) - White
Geographical mobility - Moved from different county within same state (%) - Black or African American
Geographical mobility - Moved from different county within same state (%) - Asian
Geographical mobility - Moved from different county within same state (%) - Hispanic or Latino
Geographical mobility - Moved from different county within same state (%) - American Indian and Alaska Native
Geographical mobility - Moved from different county within same state (%) - Multirace
Geographical mobility - Moved from different county within same state (%) - Other Race
Geographical mobility - Moved from different state (%)
Geographical mobility - Moved from different state (%) - White
Geographical mobility - Moved from different state (%) - Black or African American
Geographical mobility - Moved from different state (%) - Asian
Geographical mobility - Moved from different state (%) - Hispanic or Latino
Geographical mobility - Moved from different state (%) - American Indian and Alaska Native
Geographical mobility - Moved from different state (%) - Multirace
Geographical mobility - Moved from different state (%) - Other Race
Geographical mobility - Moved from abroad (%)
Geographical mobility - Moved from abroad (%) - White
Geographical mobility - Moved from abroad (%) - Black or African American
Geographical mobility - Moved from abroad (%) - Asian
Geographical mobility - Moved from abroad (%) - Hispanic or Latino
Geographical mobility - Moved from abroad (%) - American Indian and Alaska Native
Geographical mobility - Moved from abroad (%) - Multirace
Geographical mobility - Moved from abroad (%) - Other Race
Place of birth for the foreign-born population - Ireland (%)
Place of birth for the foreign-born population - Denmark (%)
Place of birth for the foreign-born population - Norway (%)
Place of birth for the foreign-born population - Sweden (%)
Place of birth for the foreign-born population - United Kingdom (%)
Place of birth for the foreign-born population - England (%)
Place of birth for the foreign-born population - Scotland (%)
Place of birth for the foreign-born population - Other Northern Europe (%)
Place of birth for the foreign-born population - Austria (%)
Place of birth for the foreign-born population - Belgium (%)
Place of birth for the foreign-born population - France (%)
Place of birth for the foreign-born population - Germany (%)
Place of birth for the foreign-born population - Netherlands (%)
Place of birth for the foreign-born population - Switzerland (%)
Place of birth for the foreign-born population - Other Western Europe (%)
Place of birth for the foreign-born population - Greece (%)
Place of birth for the foreign-born population - Italy (%)
Place of birth for the foreign-born population - Portugal (%)
Place of birth for the foreign-born population - Spain (%)
Place of birth for the foreign-born population - Other Southern Europe (%)
Place of birth for the foreign-born population - Albania (%)
Place of birth for the foreign-born population - Belarus (%)
Place of birth for the foreign-born population - Bosnia and Herzegovina (%)
Place of birth for the foreign-born population - Bulgaria (%)
Place of birth for the foreign-born population - Croatia (%)
Place of birth for the foreign-born population - Czechoslovakia (%)
Place of birth for the foreign-born population - Hungary (%)
Place of birth for the foreign-born population - Latvia (%)
Place of birth for the foreign-born population - Lithuania (%)
Place of birth for the foreign-born population - North Macedonia (Macedonia) (%)
Place of birth for the foreign-born population - Moldova (%)
Place of birth for the foreign-born population - Poland (%)
Place of birth for the foreign-born population - Romania (%)
Place of birth for the foreign-born population - Russia (%)
Place of birth for the foreign-born population - Serbia (%)
Place of birth for the foreign-born population - Ukraine (%)
Place of birth for the foreign-born population - Other Eastern Europe (%)
Place of birth for the foreign-born population - China (%)
Place of birth for the foreign-born population - Hong Kong (%)
Place of birth for the foreign-born population - Taiwan (%)
Place of birth for the foreign-born population - Japan (%)
Place of birth for the foreign-born population - Korea (%)
Place of birth for the foreign-born population - Other Eastern Asia (%)
Place of birth for the foreign-born population - Afghanistan (%)
Place of birth for the foreign-born population - Bangladesh (%)
Place of birth for the foreign-born population - India (%)
Place of birth for the foreign-born population - Iran (%)
Place of birth for the foreign-born population - Kazakhstan (%)
Place of birth for the foreign-born population - Nepal (%)
Place of birth for the foreign-born population - Pakistan (%)
Place of birth for the foreign-born population - Sri Lanka (%)
Place of birth for the foreign-born population - Uzbekistan (%)
Place of birth for the foreign-born population - Other South Central Asia (%)
Place of birth for the foreign-born population - Burma (%)
Place of birth for the foreign-born population - Cambodia (%)
Place of birth for the foreign-born population - Indonesia (%)
Place of birth for the foreign-born population - Laos (%)
Place of birth for the foreign-born population - Malaysia (%)
Place of birth for the foreign-born population - Philippines (%)
Place of birth for the foreign-born population - Singapore (%)
Place of birth for the foreign-born population - Thailand (%)
Place of birth for the foreign-born population - Vietnam (%)
Place of birth for the foreign-born population - Other South Eastern Asia (%)
Place of birth for the foreign-born population - Armenia (%)
Place of birth for the foreign-born population - Iraq (%)
Place of birth for the foreign-born population - Israel (%)
Place of birth for the foreign-born population - Jordan (%)
Place of birth for the foreign-born population - Kuwait (%)
Place of birth for the foreign-born population - Lebanon (%)
Place of birth for the foreign-born population - Saudi Arabia (%)
Place of birth for the foreign-born population - Syria (%)
Place of birth for the foreign-born population - Turkey (%)
Place of birth for the foreign-born population - Yemen (%)
Place of birth for the foreign-born population - Other Western Asia (%)
Place of birth for the foreign-born population - Eritrea (%)
Place of birth for the foreign-born population - Ethiopia (%)
Place of birth for the foreign-born population - Kenya (%)
Place of birth for the foreign-born population - Somalia (%)
Place of birth for the foreign-born population - Uganda (%)
Place of birth for the foreign-born population - Zimbabwe (%)
Place of birth for the foreign-born population - Other Eastern Africa (%)
Place of birth for the foreign-born population - Cameroon (%)
Place of birth for the foreign-born population - Congo (%)
Place of birth for the foreign-born population - Democratic Republic of Congo (Zaire) (%)
Place of birth for the foreign-born population - Other Middle Africa (%)
Place of birth for the foreign-born population - Egypt (%)
Place of birth for the foreign-born population - Morocco (%)
Place of birth for the foreign-born population - Sudan (%)
Place of birth for the foreign-born population - Other Northern Africa (%)
Place of birth for the foreign-born population - South Africa (%)
Place of birth for the foreign-born population - Other Southern Africa (%)
Place of birth for the foreign-born population - Cabo Verde (%)
Place of birth for the foreign-born population - Ghana (%)
Place of birth for the foreign-born population - Liberia (%)
Place of birth for the foreign-born population - Nigeria (%)
Place of birth for the foreign-born population - Senegal (%)
Place of birth for the foreign-born population - Sierra Leone (%)
Place of birth for the foreign-born population - Other Western Africa (%)
Place of birth for the foreign-born population - Australia (%)
Place of birth for the foreign-born population - New Zealand (%)
Place of birth for the foreign-born population - Fiji (%)
Place of birth for the foreign-born population - Micronesia (%)
Place of birth for the foreign-born population - Bahamas (%)
Place of birth for the foreign-born population - Barbados (%)
Place of birth for the foreign-born population - Cuba (%)
Place of birth for the foreign-born population - Dominica (%)
Place of birth for the foreign-born population - Dominican Republic (%)
Place of birth for the foreign-born population - Grenada (%)
Place of birth for the foreign-born population - Haiti (%)
Place of birth for the foreign-born population - Jamaica (%)
Place of birth for the foreign-born population - St. Vincent and the Grenadines (%)
Place of birth for the foreign-born population - Trinidad and Tobago (%)
Place of birth for the foreign-born population - West Indies (%)
Place of birth for the foreign-born population - Other Caribbean (%)
Place of birth for the foreign-born population - Belize (%)
Place of birth for the foreign-born population - Costa Rica (%)
Place of birth for the foreign-born population - El Salvador (%)
Place of birth for the foreign-born population - Guatemala (%)
Place of birth for the foreign-born population - Honduras (%)
Place of birth for the foreign-born population - Mexico (%)
Place of birth for the foreign-born population - Nicaragua (%)
Place of birth for the foreign-born population - Panama (%)
Place of birth for the foreign-born population - Other Central America (%)
Place of birth for the foreign-born population - Argentina (%)
Place of birth for the foreign-born population - Bolivia (%)
Place of birth for the foreign-born population - Brazil (%)
Place of birth for the foreign-born population - Chile (%)
Place of birth for the foreign-born population - Colombia (%)
Place of birth for the foreign-born population - Ecuador (%)
Place of birth for the foreign-born population - Guyana (%)
Place of birth for the foreign-born population - Peru (%)
Place of birth for the foreign-born population - Uruguay (%)
Place of birth for the foreign-born population - Venezuela (%)
Place of birth for the foreign-born population - Other South America (%)
Place of birth for the foreign-born population - Canada (%)
Place of birth for the foreign-born population - Other Northern America (%)
Place of birth for the foreign-born population - Other (%)
Latest news about races in Highwood, IL collected exclusively by city-data.com from local newspapers, TV, and radio stations
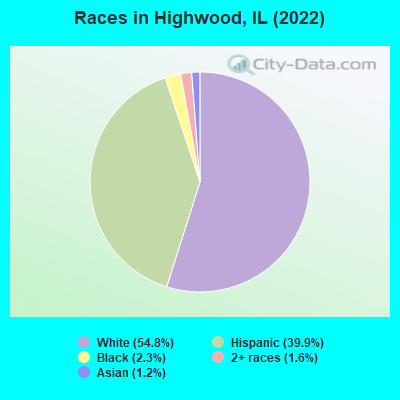
According to 2022 data, the most numerous races in Highwood, IL are White alone (2,848 residents), Hispanic (2,074 residents), and Black alone (122 residents). 59.0% of Highwood residents speak English at home. 23.1% of Highwood, IL residents are foreign-born (19.3% born in Latin America, 2.5% born in Europe), which is 39.3% greater than the foreign-born rate of 14.0% across the entire state of Illinois.
Race distribution in Highwood
2000 2022
8,424,140 67.8% White alone 1,856,152 14.9% Black alone 1,530,262 12.3% Hispanic 419,916 3.4% Asian alone 153,996 1.2% Two or more races 13,479 0.1% Other race alone 18,232 0.1% American Indian alone 3,116 0.03% Native Hawaiian and Other
7,356,301 58.5% White alone 2,299,726 18.3% Hispanic 1,660,423 13.2% Black alone 747,296 5.9% Asian alone 458,599 3.6% Two or more races 45,386 0.4% Other race alone 10,405 0.08% American Indian alone 3,896 0.03% Native Hawaiian and Other
Income and house value in Highwood Median household income in 2022 $117,507 White non-Hispanic householders$45,737 Black householders$64,185 Some other race householders$81,945 Two or more races householders$76,035 Hispanic or Latino race householdersMedian 2022 house value $535,990 White Non-Hispanic householders over $1,000,000 Asian householders$440,902 Some other race householders$438,600 Hispanic or Latino householders
Median age by race in Highwood
42.7 Median age for White residents38.2 55.7 26.5 Median age for Black or African American residents24.1 30.1 -657,243,815.6 Median age for American Indian / Alaska Native residents-671,532,846.0 -638,251,365.5 54.1 Median age for Asian residents-680,776,013.4 53.0 -593,236,714.4 Median age for Native Hawaiian / Pacific Islander residents-658,536,584.7 -576,015,108.0 29.3 Median age for Other race residents18.1 33.4 21.0 Median age for Two or more races residents20.5 21.5 48.7 Median age for White alone residents35.6 58.2 24.4 Median age for Hispanic or Latino residents21.3 28.8
Owner/renter occupied households by race in Highwood
House owners and renters - White residents 795 57.5% Owner occupied587 42.5% Renter occupiedHouse owners and renters - Black or African American residents 78 100.0% Renter occupiedHouse owners and renters - Asian residents 21 100.0% Owner occupiedHouse owners and renters - Other race residents 85 27.8% Owner occupied219 72.2% Renter occupiedHouse owners and renters - Two or more races residents 59 51.7% Owner occupied55 48.3% Renter occupiedHouse owners and renters - White alone residents 814 62.1% Owner occupied497 37.9% Renter occupiedHouse owners and renters - Hispanic or Latino residents 112 21.5% Owner occupied410 78.5% Renter occupied
Language usage in Highwood
English speakers - Total 59.0% of residents of Highwood speak English at home.
35.4% of residents speak Spanish at home 782 45.0% Speak English very well955 55.0% Speak English less than very well6.4% of residents speak other language at home 251 80.2% Speak English very well62 19.8% Speak English less than very well
English speakers - Born in the United States 98.2% of residents of Highwood speak English at home.
1.3% of residents speak Spanish at home 12 100.0% Speak English very well
English speakers - Native, born elsewhere 71.0% of residents of Highwood speak English at home.
25.8% of residents speak other language at home 8 100.0% Speak English very well
English speakers - Foreign-born 8.6% of residents of Highwood speak English at home.
79.8% of residents speak Spanish at home 181 18.1% Speak English very well817 81.9% Speak English less than very well13.4% of residents speak other language at home 106 63.1% Speak English very well62 36.9% Speak English less than very well
White (Caucasian) - Speak only English Native:
94.8% (2,420)Foreign-born:
3.5% (11)
White (Caucasian) - Speak another language Native:
5.5% (141)Foreign-born:
88.2% (271)
Asian - Speak only English Native:
75.7% (5)Foreign-born:
23.3% (13)
Other race - Speak only English Native:
13.5% (89)Foreign-born:
3.8% (24)
Other race - Speak another language Native:
83.2% (550)Foreign-born:
92.7% (594)
Two or more races - Speak only English Native:
37.6% (135)Foreign-born:
33.0% (90)
Two or more races - Speak another language Native:
65.1% (234)Foreign-born:
62.3% (170)
White alone - Speak only English Native:
93.8% (2,360)Foreign-born:
6.5% (10)
White alone - Speak another language Native:
6.0% (151)Foreign-born:
92.1% (138)
Hispanic or Latino - Speak only English Native:
22.6% (209)Foreign-born:
10.8% (114)
Hispanic or Latino - Speak another language Native:
76.5% (710)Foreign-born:
90.2% (953)
Foreign-born residents in Highwood 1,199 residents are foreign born (19.3% Latin America , 2.5% Europe ).
This city:
23.1%Illinois:
14.1%
Marital status for residents in Highwood Marital status - White (Caucasian) population 15 years and over
Males 41.3% Never married53.0% Now married0.0% Separated1.1% Widowed4.6% DivorcedFemales 14.6% Never married61.1% Now married0.0% Separated12.7% Widowed11.6% DivorcedWomen who gave birth in the past 12 months Now married:
100.0% (10)Unmarried:
0.0% (0)
Women who did not give birth in the past 12 months Now married:
69.0% (329)Unmarried:
31.0% (148)
Marital status - Black or African American population 15 years and over
Males 100.0% Never married0.0% Now married0.0% Separated0.0% Widowed0.0% DivorcedFemales 88.2% Never married8.8% Now married0.0% Separated0.0% Widowed2.9% DivorcedWomen who did not give birth in the past 12 months Now married:
0.0% (0)Unmarried:
100.0% (82)
Marital status - Asian population 15 years and over
Males 0.0% Never married100.0% Now married0.0% Separated0.0% Widowed0.0% DivorcedFemales 38.9% Never married61.1% Now married0.0% Separated0.0% Widowed0.0% DivorcedWomen who did not give birth in the past 12 months Now married:
0.0% (0)Unmarried:
100.0% (14)
Marital status - Other race population 15 years and over
Males 46.0% Never married49.7% Now married0.0% Separated0.0% Widowed4.4% DivorcedFemales 41.2% Never married43.9% Now married0.0% Separated0.0% Widowed14.9% DivorcedWomen who did not give birth in the past 12 months Now married:
41.9% (141)Unmarried:
58.1% (196)
Marital status - Two or more races population 15 years and over
Males 40.4% Never married48.2% Now married0.0% Separated0.0% Widowed11.4% DivorcedFemales 55.9% Never married30.7% Now married0.0% Separated0.0% Widowed13.4% DivorcedWomen who did not give birth in the past 12 months Now married:
20.0% (32)Unmarried:
80.0% (129)
Marital status - White alone, not Hispanic / Latino population 15 years and over
Males 36.0% Never married57.2% Now married0.0% Separated1.3% Widowed5.5% DivorcedFemales 13.3% Never married60.8% Now married0.0% Separated13.9% Widowed12.0% DivorcedWomen who gave birth in the past 12 months Now married:
100.0% (10)Unmarried:
0.0% (0)
Women who did not give birth in the past 12 months Now married:
70.5% (282)Unmarried:
29.5% (118)
Marital status - Hispanic or Latino population 15 years and over
Males 53.6% Never married42.4% Now married0.0% Separated0.0% Widowed4.0% DivorcedFemales 40.0% Never married46.2% Now married0.0% Separated0.0% Widowed13.8% DivorcedWomen who did not give birth in the past 12 months Now married:
43.6% (241)Unmarried:
56.4% (312)
Ancestries in Highwood
312 11.9% Italian225 8.6% German171 6.5% Polish98 3.7% Irish82 3.1% American53 2.0% Russian43 1.6% European35 1.3% Swiss30 1.1% Romanian19 0.7% Swedish17 0.6% Lebanese16 0.6% English7 0.3% Hungarian7 0.3% Yugoslavian6 0.2% Scotch-Irish6 0.2% Scottish4 0.2% British
Children Nativity (place of birth) in Highwood
Children under 6 years - Living with two parents Both parents native 216 100.0% NativeBoth parents foreign-born 123 100.0% NativeOne native, one foreign-born parent 21 100.0% NativeChildren under 6 years - Living with one parent Native parent 1 100.0% NativeForeign-born parent 55 100.0% NativeChildren 6 to 17 years - Living with two parents Both parents native 234 100.0% NativeBoth parents foreign-born 344 89.5% Native41 10.5% Foreign-bornChildren 6 to 17 years - Living with one parent Native parent 90 100.0% NativeForeign-born parent 92 58.1% Native67 41.9% Foreign-born
Grandparents responsible for own grandchildren in Highwood
Grandparents (30 to 59 years) White / Caucasian 19 100.0% Responsible for grandchildrenOther race 73 100.0% Not responsible for grandchildrenWhite alone, not Hispanic / Latino 24 100.0% Responsible for grandchildrenHispanic or Latino 71 100.0% Not responsible for grandchildren
Grandparents (60 years and over) White / Caucasian 17 100.0% Responsible for grandchildrenWhite alone, not Hispanic / Latino 21 100.0% Responsible for grandchildren