Races in Highland, Utah (UT) Detailed Stats
Data:
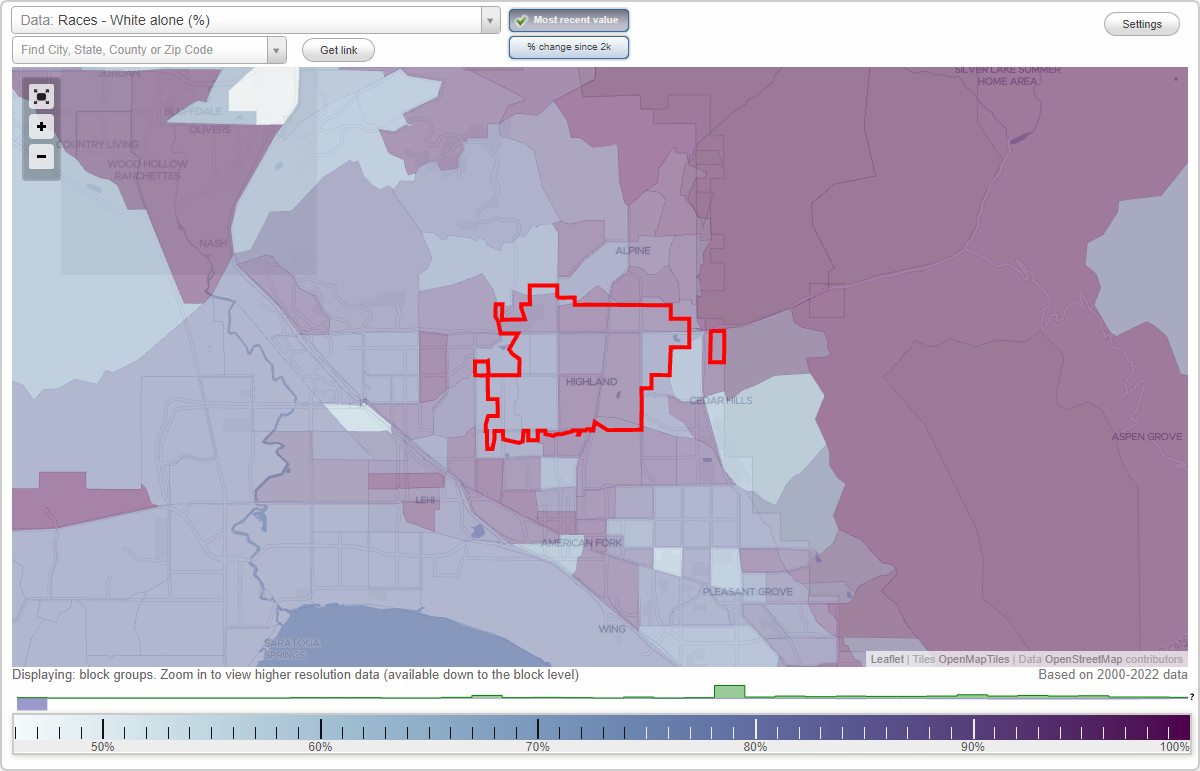
Races - White alone (%)
Races - White alone (% change since 2000)
Races - Black alone (%)
Races - Black alone (% change since 2000)
Races - American Indian alone (%)
Races - American Indian alone (% change since 2000)
Races - Asian alone (%)
Races - Asian alone (% change since 2000)
Races - Hispanic (%)
Races - Hispanic (% change since 2000)
Races - Native Hawaiian and Other Pacific Islander alone (%)
Races - Native Hawaiian and Other Pacific Islander alone (% change since 2000)
Races - Two or more races(%)
Races - Two or more races(% change since 2000)
Races - Other race alone (%)
Races - Other race alone (% change since 2000)
Racial diversity
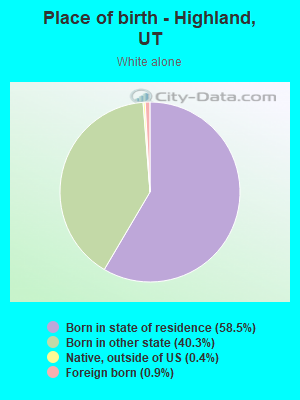
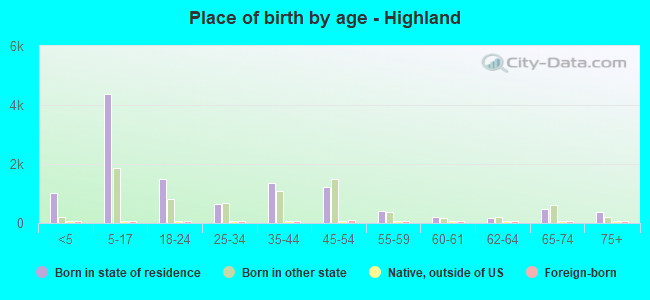
Place of birth - Born in state of residence (%)
Place of birth - Born in state of residence (%) - White
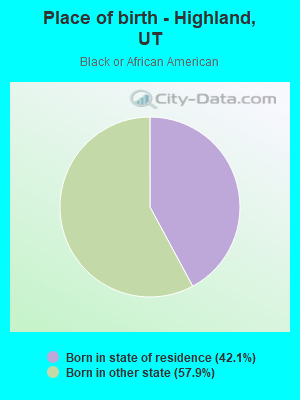
Place of birth - Born in state of residence (%) - Black or African American
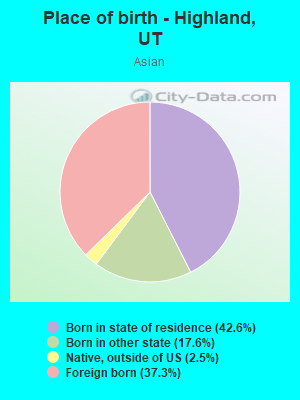
Place of birth - Born in state of residence (%) - Asian
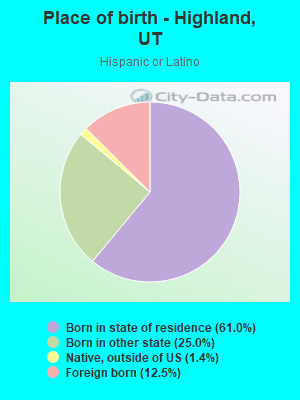
Place of birth - Born in state of residence (%) - Hispanic or Latino
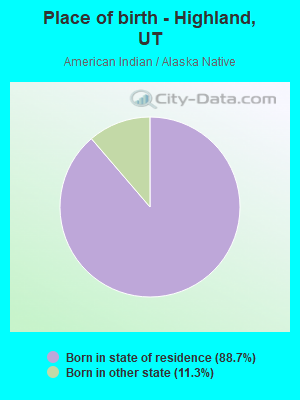
Place of birth - Born in state of residence (%) - American Indian and Alaska Native
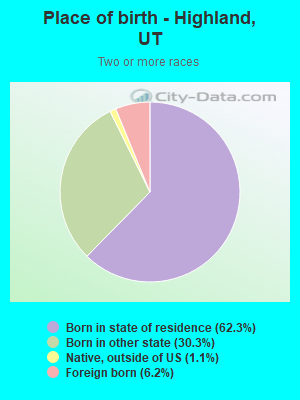
Place of birth - Born in state of residence (%) - Multirace
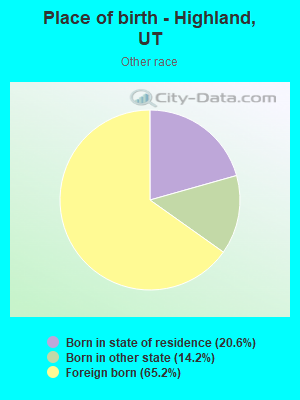
Place of birth - Born in state of residence (%) - Other Race
Place of birth - Born in other state (%)
Place of birth - Born in other state (%) - White
Place of birth - Born in other state (%) - Black or African American
Place of birth - Born in other state (%) - Asian
Place of birth - Born in other state (%) - Hispanic or Latino
Place of birth - Born in other state (%) - American Indian and Alaska Native
Place of birth - Born in other state (%) - Multirace
Place of birth - Born in other state (%) - Other Race
Place of birth - Native, outside of US (%)
Place of birth - Native, outside of US (%) - White
Place of birth - Native, outside of US (%) - Black or African American
Place of birth - Native, outside of US (%) - Asian
Place of birth - Native, outside of US (%) - Hispanic or Latino
Place of birth - Native, outside of US (%) - American Indian and Alaska Native
Place of birth - Native, outside of US (%) - Multirace
Place of birth - Native, outside of US (%) - Other Race
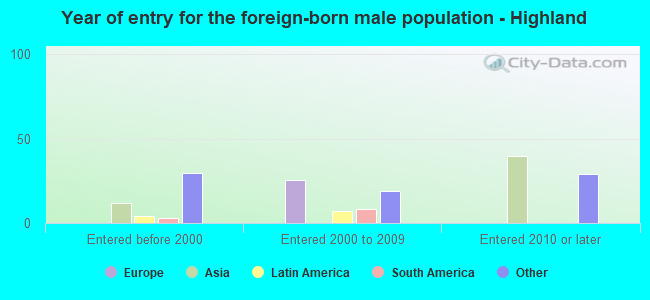
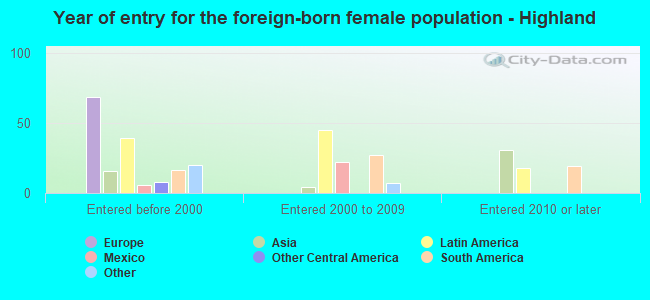
Place of birth - Foreign born (%)
Place of birth - Foreign born (%) - White
Place of birth - Foreign born (%) - Black or African American
Place of birth - Foreign born (%) - Asian
Place of birth - Foreign born (%) - Hispanic or Latino
Place of birth - Foreign born (%) - American Indian and Alaska Native
Place of birth - Foreign born (%) - Multirace
Place of birth - Foreign born (%) - Other Race
Residents speaking English at home (%)
Residents speaking English at home - Born in the United States (%)
Residents speaking English at home - Native, born elsewhere (%)
Residents speaking English at home - Foreign born (%)
Residents speaking Spanish at home (%)
Residents speaking Spanish at home - Born in the United States (%)
Residents speaking Spanish at home - Native, born elsewhere (%)
Residents speaking Spanish at home - Foreign born (%)
Residents speaking other language at home (%)
Residents speaking other language at home - Born in the United States (%)
Residents speaking other language at home - Native, born elsewhere (%)
Residents speaking other language at home - Foreign born (%)
Marital status - Never married (%)
Marital status - Now married (%)
Marital status - Separated (%)
Marital status - Widowed (%)
Marital status - Divorced (%)
Ancestries Reported - Arab (%)
Ancestries Reported - Czech (%)
Ancestries Reported - Danish (%)
Ancestries Reported - Dutch (%)
Ancestries Reported - English (%)
Ancestries Reported - French (%)
Ancestries Reported - French Canadian (%)
Ancestries Reported - German (%)
Ancestries Reported - Greek (%)
Ancestries Reported - Hungarian (%)
Ancestries Reported - Irish (%)
Ancestries Reported - Italian (%)
Ancestries Reported - Lithuanian (%)
Ancestries Reported - Norwegian (%)
Ancestries Reported - Polish (%)
Ancestries Reported - Portuguese (%)
Ancestries Reported - Russian (%)
Ancestries Reported - Scotch-Irish (%)
Ancestries Reported - Scottish (%)
Ancestries Reported - Slovak (%)
Ancestries Reported - Subsaharan African (%)
Ancestries Reported - Swedish (%)
Ancestries Reported - Swiss (%)
Ancestries Reported - Ukrainian (%)
Ancestries Reported - United States (%)
Ancestries Reported - Welsh (%)
Ancestries Reported - West Indian (%)
Ancestries Reported - Other (%)
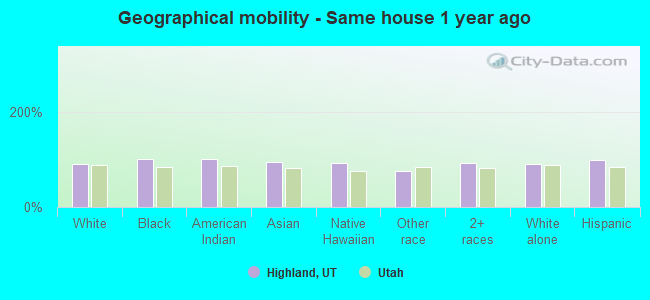
Geographical mobility - Same house 1 year ago (%)
Geographical mobility - Same house 1 year ago (%) - White
Geographical mobility - Same house 1 year ago (%) - Black or African American
Geographical mobility - Same house 1 year ago (%) - Asian
Geographical mobility - Same house 1 year ago (%) - Hispanic or Latino
Geographical mobility - Same house 1 year ago (%) - American Indian and Alaska Native
Geographical mobility - Same house 1 year ago (%) - Multirace
Geographical mobility - Same house 1 year ago (%) - Other Race
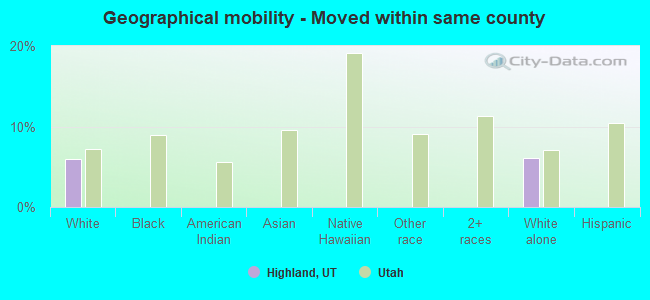
Geographical mobility - Moved within same county (%)
Geographical mobility - Moved within same county (%) - White
Geographical mobility - Moved within same county (%) - Black or African American
Geographical mobility - Moved within same county (%) - Asian
Geographical mobility - Moved within same county (%) - Hispanic or Latino
Geographical mobility - Moved within same county (%) - American Indian and Alaska Native
Geographical mobility - Moved within same county (%) - Multirace
Geographical mobility - Moved within same county (%) - Other Race
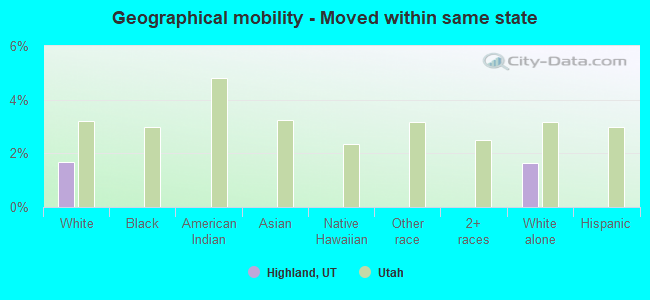
Geographical mobility - Moved from different county within same state (%)
Geographical mobility - Moved from different county within same state (%) - White
Geographical mobility - Moved from different county within same state (%) - Black or African American
Geographical mobility - Moved from different county within same state (%) - Asian
Geographical mobility - Moved from different county within same state (%) - Hispanic or Latino
Geographical mobility - Moved from different county within same state (%) - American Indian and Alaska Native
Geographical mobility - Moved from different county within same state (%) - Multirace
Geographical mobility - Moved from different county within same state (%) - Other Race
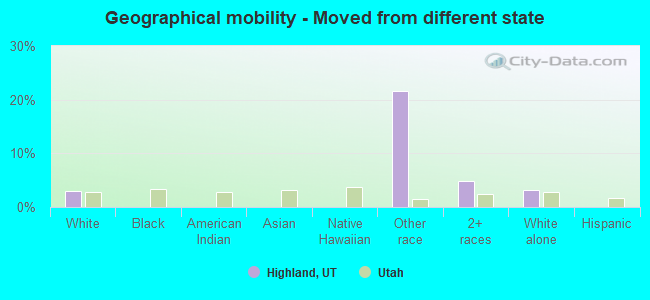
Geographical mobility - Moved from different state (%)
Geographical mobility - Moved from different state (%) - White
Geographical mobility - Moved from different state (%) - Black or African American
Geographical mobility - Moved from different state (%) - Asian
Geographical mobility - Moved from different state (%) - Hispanic or Latino
Geographical mobility - Moved from different state (%) - American Indian and Alaska Native
Geographical mobility - Moved from different state (%) - Multirace
Geographical mobility - Moved from different state (%) - Other Race
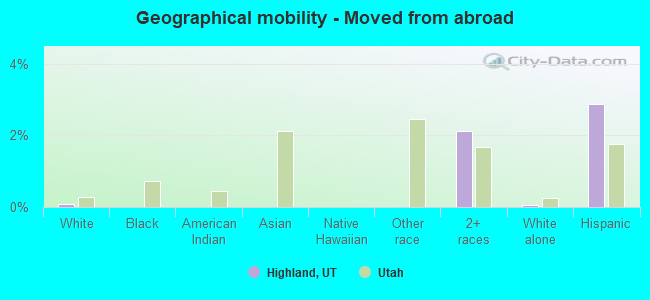
Geographical mobility - Moved from abroad (%)
Geographical mobility - Moved from abroad (%) - White
Geographical mobility - Moved from abroad (%) - Black or African American
Geographical mobility - Moved from abroad (%) - Asian
Geographical mobility - Moved from abroad (%) - Hispanic or Latino
Geographical mobility - Moved from abroad (%) - American Indian and Alaska Native
Geographical mobility - Moved from abroad (%) - Multirace
Geographical mobility - Moved from abroad (%) - Other Race
Place of birth for the foreign-born population - Ireland (%)
Place of birth for the foreign-born population - Denmark (%)
Place of birth for the foreign-born population - Norway (%)
Place of birth for the foreign-born population - Sweden (%)
Place of birth for the foreign-born population - United Kingdom (%)
Place of birth for the foreign-born population - England (%)
Place of birth for the foreign-born population - Scotland (%)
Place of birth for the foreign-born population - Other Northern Europe (%)
Place of birth for the foreign-born population - Austria (%)
Place of birth for the foreign-born population - Belgium (%)
Place of birth for the foreign-born population - France (%)
Place of birth for the foreign-born population - Germany (%)
Place of birth for the foreign-born population - Netherlands (%)
Place of birth for the foreign-born population - Switzerland (%)
Place of birth for the foreign-born population - Other Western Europe (%)
Place of birth for the foreign-born population - Greece (%)
Place of birth for the foreign-born population - Italy (%)
Place of birth for the foreign-born population - Portugal (%)
Place of birth for the foreign-born population - Spain (%)
Place of birth for the foreign-born population - Other Southern Europe (%)
Place of birth for the foreign-born population - Albania (%)
Place of birth for the foreign-born population - Belarus (%)
Place of birth for the foreign-born population - Bosnia and Herzegovina (%)
Place of birth for the foreign-born population - Bulgaria (%)
Place of birth for the foreign-born population - Croatia (%)
Place of birth for the foreign-born population - Czechoslovakia (%)
Place of birth for the foreign-born population - Hungary (%)
Place of birth for the foreign-born population - Latvia (%)
Place of birth for the foreign-born population - Lithuania (%)
Place of birth for the foreign-born population - North Macedonia (Macedonia) (%)
Place of birth for the foreign-born population - Moldova (%)
Place of birth for the foreign-born population - Poland (%)
Place of birth for the foreign-born population - Romania (%)
Place of birth for the foreign-born population - Russia (%)
Place of birth for the foreign-born population - Serbia (%)
Place of birth for the foreign-born population - Ukraine (%)
Place of birth for the foreign-born population - Other Eastern Europe (%)
Place of birth for the foreign-born population - China (%)
Place of birth for the foreign-born population - Hong Kong (%)
Place of birth for the foreign-born population - Taiwan (%)
Place of birth for the foreign-born population - Japan (%)
Place of birth for the foreign-born population - Korea (%)
Place of birth for the foreign-born population - Other Eastern Asia (%)
Place of birth for the foreign-born population - Afghanistan (%)
Place of birth for the foreign-born population - Bangladesh (%)
Place of birth for the foreign-born population - India (%)
Place of birth for the foreign-born population - Iran (%)
Place of birth for the foreign-born population - Kazakhstan (%)
Place of birth for the foreign-born population - Nepal (%)
Place of birth for the foreign-born population - Pakistan (%)
Place of birth for the foreign-born population - Sri Lanka (%)
Place of birth for the foreign-born population - Uzbekistan (%)
Place of birth for the foreign-born population - Other South Central Asia (%)
Place of birth for the foreign-born population - Burma (%)
Place of birth for the foreign-born population - Cambodia (%)
Place of birth for the foreign-born population - Indonesia (%)
Place of birth for the foreign-born population - Laos (%)
Place of birth for the foreign-born population - Malaysia (%)
Place of birth for the foreign-born population - Philippines (%)
Place of birth for the foreign-born population - Singapore (%)
Place of birth for the foreign-born population - Thailand (%)
Place of birth for the foreign-born population - Vietnam (%)
Place of birth for the foreign-born population - Other South Eastern Asia (%)
Place of birth for the foreign-born population - Armenia (%)
Place of birth for the foreign-born population - Iraq (%)
Place of birth for the foreign-born population - Israel (%)
Place of birth for the foreign-born population - Jordan (%)
Place of birth for the foreign-born population - Kuwait (%)
Place of birth for the foreign-born population - Lebanon (%)
Place of birth for the foreign-born population - Saudi Arabia (%)
Place of birth for the foreign-born population - Syria (%)
Place of birth for the foreign-born population - Turkey (%)
Place of birth for the foreign-born population - Yemen (%)
Place of birth for the foreign-born population - Other Western Asia (%)
Place of birth for the foreign-born population - Eritrea (%)
Place of birth for the foreign-born population - Ethiopia (%)
Place of birth for the foreign-born population - Kenya (%)
Place of birth for the foreign-born population - Somalia (%)
Place of birth for the foreign-born population - Uganda (%)
Place of birth for the foreign-born population - Zimbabwe (%)
Place of birth for the foreign-born population - Other Eastern Africa (%)
Place of birth for the foreign-born population - Cameroon (%)
Place of birth for the foreign-born population - Congo (%)
Place of birth for the foreign-born population - Democratic Republic of Congo (Zaire) (%)
Place of birth for the foreign-born population - Other Middle Africa (%)
Place of birth for the foreign-born population - Egypt (%)
Place of birth for the foreign-born population - Morocco (%)
Place of birth for the foreign-born population - Sudan (%)
Place of birth for the foreign-born population - Other Northern Africa (%)
Place of birth for the foreign-born population - South Africa (%)
Place of birth for the foreign-born population - Other Southern Africa (%)
Place of birth for the foreign-born population - Cabo Verde (%)
Place of birth for the foreign-born population - Ghana (%)
Place of birth for the foreign-born population - Liberia (%)
Place of birth for the foreign-born population - Nigeria (%)
Place of birth for the foreign-born population - Senegal (%)
Place of birth for the foreign-born population - Sierra Leone (%)
Place of birth for the foreign-born population - Other Western Africa (%)
Place of birth for the foreign-born population - Australia (%)
Place of birth for the foreign-born population - New Zealand (%)
Place of birth for the foreign-born population - Fiji (%)
Place of birth for the foreign-born population - Micronesia (%)
Place of birth for the foreign-born population - Bahamas (%)
Place of birth for the foreign-born population - Barbados (%)
Place of birth for the foreign-born population - Cuba (%)
Place of birth for the foreign-born population - Dominica (%)
Place of birth for the foreign-born population - Dominican Republic (%)
Place of birth for the foreign-born population - Grenada (%)
Place of birth for the foreign-born population - Haiti (%)
Place of birth for the foreign-born population - Jamaica (%)
Place of birth for the foreign-born population - St. Vincent and the Grenadines (%)
Place of birth for the foreign-born population - Trinidad and Tobago (%)
Place of birth for the foreign-born population - West Indies (%)
Place of birth for the foreign-born population - Other Caribbean (%)
Place of birth for the foreign-born population - Belize (%)
Place of birth for the foreign-born population - Costa Rica (%)
Place of birth for the foreign-born population - El Salvador (%)
Place of birth for the foreign-born population - Guatemala (%)
Place of birth for the foreign-born population - Honduras (%)
Place of birth for the foreign-born population - Mexico (%)
Place of birth for the foreign-born population - Nicaragua (%)
Place of birth for the foreign-born population - Panama (%)
Place of birth for the foreign-born population - Other Central America (%)
Place of birth for the foreign-born population - Argentina (%)
Place of birth for the foreign-born population - Bolivia (%)
Place of birth for the foreign-born population - Brazil (%)
Place of birth for the foreign-born population - Chile (%)
Place of birth for the foreign-born population - Colombia (%)
Place of birth for the foreign-born population - Ecuador (%)
Place of birth for the foreign-born population - Guyana (%)
Place of birth for the foreign-born population - Peru (%)
Place of birth for the foreign-born population - Uruguay (%)
Place of birth for the foreign-born population - Venezuela (%)
Place of birth for the foreign-born population - Other South America (%)
Place of birth for the foreign-born population - Canada (%)
Place of birth for the foreign-born population - Other Northern America (%)
Place of birth for the foreign-born population - Other (%)
Latest news about races in Highland, UT collected exclusively by city-data.com from local newspapers, TV, and radio stations
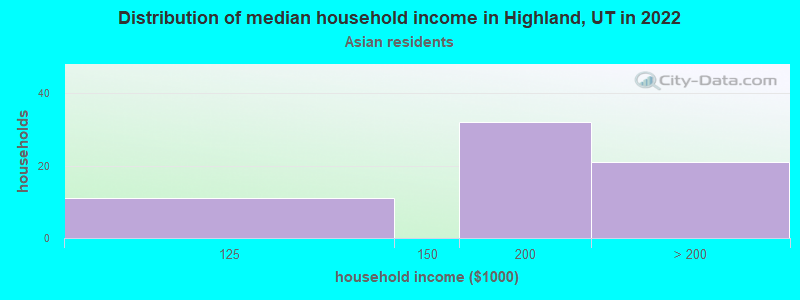
According to 2022 data, the most numerous races in Highland, UT are White alone (17,948 residents), Hispanic (595 residents), and Two or more races (487 residents). 95.1% of Highland residents speak English at home. 2.0% of Highland, UT residents are foreign-born , which is 307.4% less than the foreign-born rate of 8.0% across the entire state of Utah.
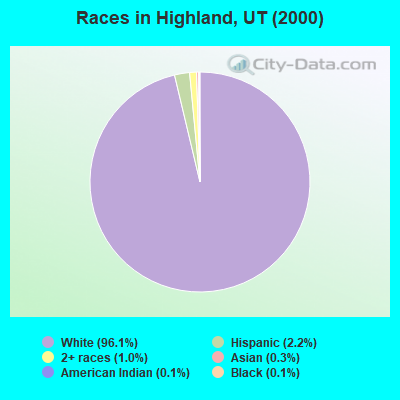
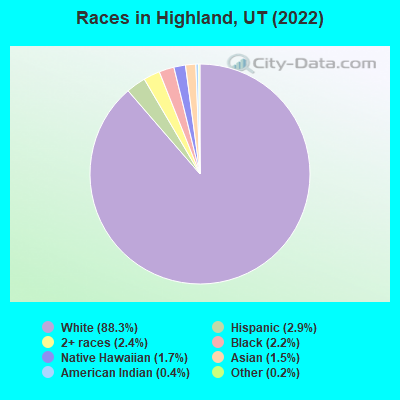
Race distribution in Highland
2000 2022
1,904,265 85.3% White alone 201,559 9.0% Hispanic 36,483 1.6% Asian alone 31,308 1.4% Two or more races 26,663 1.2% American Indian alone 14,806 0.7% Native Hawaiian and Other 16,137 0.7% Black alone 1,948 0.09% Other race alone
2,557,466 75.6% White alone 512,086 15.1% Hispanic 119,308 3.5% Two or more races 82,388 2.4% Asian alone 36,978 1.1% Native Hawaiian and Other 34,873 1.0% Black alone 22,803 0.7% American Indian alone 14,898 0.4% Other race alone
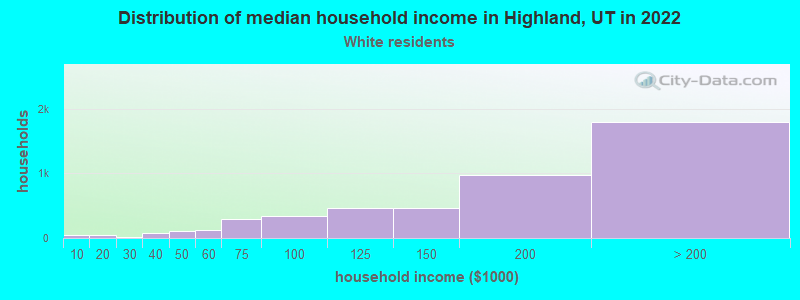
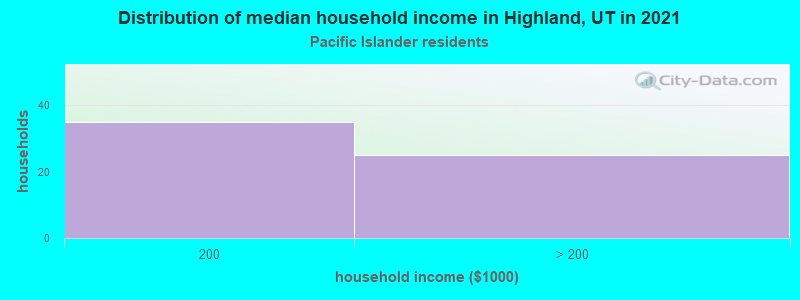
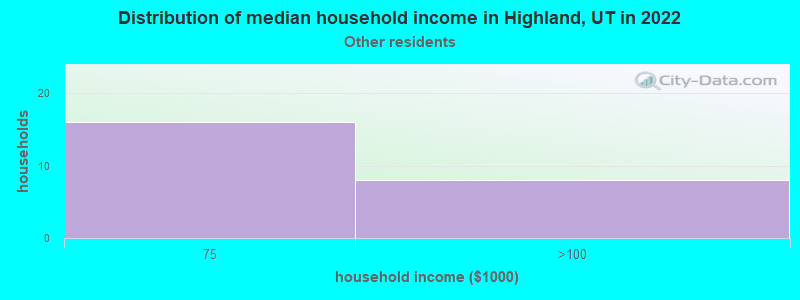
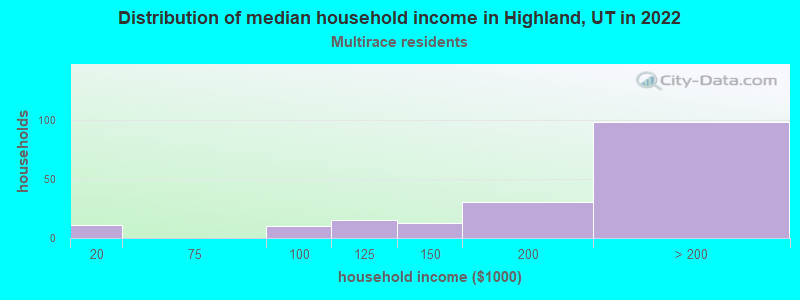
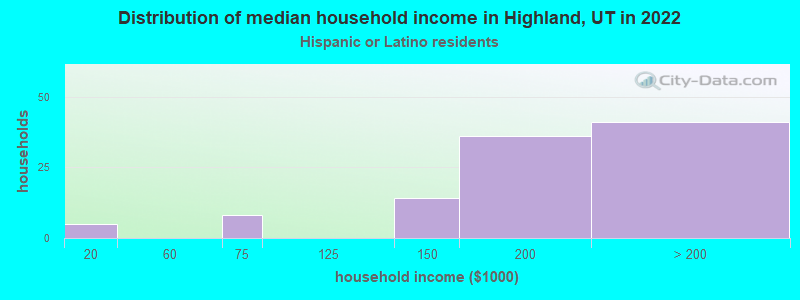
Income and house value in Highland Median household income in 2022 $172,208 White non-Hispanic householdersover $200,000 Asian householdersover $200,000 Two or more races householders$198,957 Hispanic or Latino race householdersMedian 2022 house value $915,577 White Non-Hispanic householders$602,109 American Indian or Alaska Native householders$509,477 Some other race householders$977,826 Two or more races householders$538,008 Hispanic or Latino householders
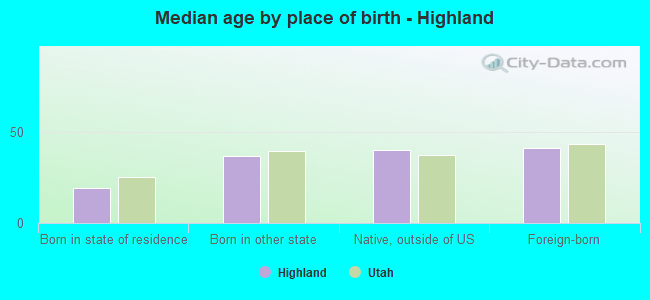
Median age by race in Highland
27.5 Median age for White residents27.0 28.9 16.8 Median age for Black or African American residents16.3 12.7 16.3 Median age for American Indian / Alaska Native residents15.6 -706,192,357.7 21.1 Median age for Asian residents17.3 37.9 30.9 Median age for Native Hawaiian / Pacific Islander residents39.0 19.9 40.8 Median age for Other race residents-650,349,649.7 45.3 15.2 Median age for Two or more races residents14.0 17.8 27.5 Median age for White alone residents27.1 28.7 15.6 Median age for Hispanic or Latino residents14.2 25.5
Owner/renter occupied households by race in Highland
House owners and renters - White residents 4,263 92.6% Owner occupied339 7.4% Renter occupiedHouse owners and renters - Asian residents 52 83.8% Owner occupied10 16.2% Renter occupiedHouse owners and renters - Native Hawaiian / Pacific Islander residents 46 100.0% Renter occupiedHouse owners and renters - Other race residents 24 100.0% Owner occupiedHouse owners and renters - Two or more races residents 155 91.7% Owner occupied14 8.3% Renter occupiedHouse owners and renters - White alone residents 4,334 92.5% Owner occupied352 7.5% Renter occupiedHouse owners and renters - Hispanic or Latino residents 73 75.9% Owner occupied23 24.1% Renter occupied
Language usage in Highland
English speakers - Total 95.1% of residents of Highland speak English at home.
2.0% of residents speak Spanish at home 295 78.7% Speak English very well80 21.3% Speak English less than very well2.4% of residents speak other language at home 397 85.9% Speak English very well65 14.1% Speak English less than very well
English speakers - Born in the United States 96.4% of residents of Highland speak English at home.
2.2% of residents speak Spanish at home 173 100.0% Speak English very well1.2% of residents speak other language at home 92 100.0% Speak English very well
English speakers - Native, born elsewhere 69.3% of residents of Highland speak English at home.
30.0% of residents speak other language at home 42 100.0% Speak English very well
English speakers - Foreign-born 36.9% of residents of Highland speak English at home.
19.4% of residents speak Spanish at home 40 48.2% Speak English very well43 51.8% Speak English less than very well41.6% of residents speak other language at home 131 73.6% Speak English very well47 26.4% Speak English less than very well
White (Caucasian) - Speak only English Native:
99.1% (16,522)Foreign-born:
100.0% (98)
White (Caucasian) - Speak another language Native:
1.9% (310)Foreign-born:
28.4% (28)
Asian - Speak another language Native:
22.4% (51)Foreign-born:
95.0% (125)
Native Hawaiian / Pacific Islander - Speak only English Native:
76.4% (266)Foreign-born:
100.0% (16)
Two or more races - Speak another language Native:
12.1% (85)Foreign-born:
100.0% (63)
White alone - Speak only English Native:
97.8% (16,501)Foreign-born:
72.9% (112)
White alone - Speak another language Native:
2.2% (375)Foreign-born:
30.2% (46)
Hispanic or Latino - Speak only English Native:
92.2% (304)Foreign-born:
12.2% (9)
Hispanic or Latino - Speak another language Native:
8.5% (28)Foreign-born:
82.1% (61)
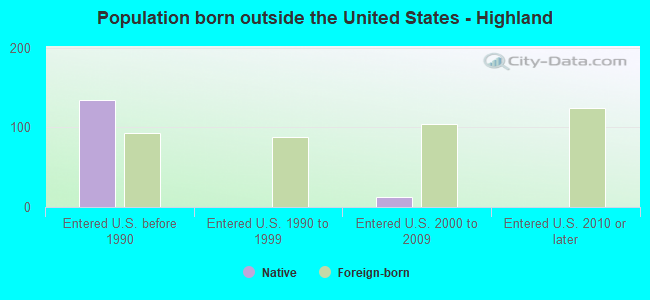
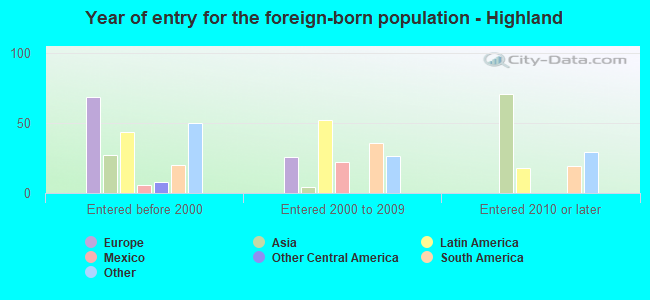
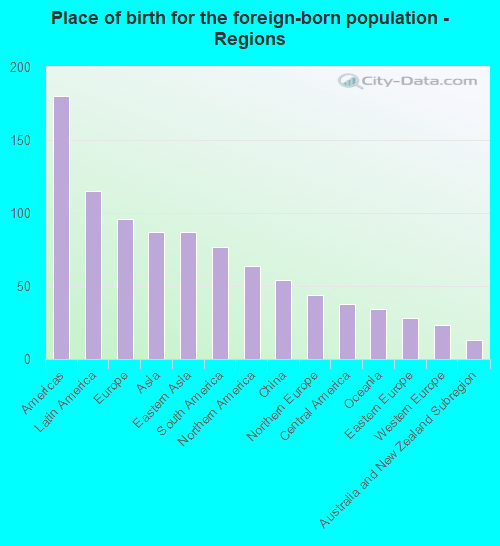
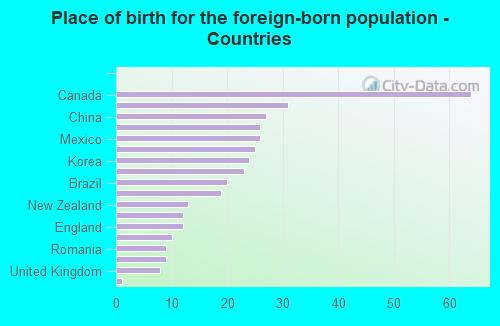
Foreign-born residents in Highland 399 residents are foreign born
Marital status for residents in Highland Marital status - White (Caucasian) population 15 years and over
Males 31.6% Never married63.2% Now married0.1% Separated0.9% Widowed4.2% DivorcedFemales 25.4% Never married66.8% Now married0.4% Separated2.7% Widowed4.7% DivorcedWomen who gave birth in the past 12 months Now married:
89.6% (210)Unmarried:
10.4% (24)
Women who did not give birth in the past 12 months Now married:
58.3% (2,204)Unmarried:
41.7% (1,575)
Marital status - Black or African American population 15 years and over
Males 100.0% Never married0.0% Now married0.0% Separated0.0% Widowed0.0% DivorcedFemales 100.0% Never married0.0% Now married0.0% Separated0.0% Widowed0.0% DivorcedWomen who did not give birth in the past 12 months Now married:
0.0% (0)Unmarried:
100.0% (60)
Marital status - Asian population 15 years and over
Males 64.0% Never married36.0% Now married0.0% Separated0.0% Widowed0.0% DivorcedFemales 27.4% Never married72.6% Now married0.0% Separated0.0% Widowed0.0% DivorcedWomen who gave birth in the past 12 months Now married:
100.0% (6)Unmarried:
0.0% (0)
Women who did not give birth in the past 12 months Now married:
64.9% (56)Unmarried:
35.1% (31)
Marital status - Native Hawaiian / Pacific Islander population 15 years and over
Males 33.6% Never married66.4% Now married0.0% Separated0.0% Widowed0.0% DivorcedFemales 62.3% Never married37.7% Now married0.0% Separated0.0% Widowed0.0% DivorcedWomen who did not give birth in the past 12 months Now married:
37.7% (76)Unmarried:
62.3% (125)
Marital status - Other race population 15 years and over
Males 0.0% Never married100.0% Now married0.0% Separated0.0% Widowed0.0% DivorcedFemales 30.3% Never married45.5% Now married0.0% Separated0.0% Widowed24.2% DivorcedWomen who did not give birth in the past 12 months Now married:
65.2% (24)Unmarried:
34.8% (13)
Marital status - Two or more races population 15 years and over
Males 38.2% Never married61.8% Now married0.0% Separated0.0% Widowed0.0% DivorcedFemales 37.6% Never married62.4% Now married0.0% Separated0.0% Widowed0.0% DivorcedWomen who gave birth in the past 12 months Now married:
100.0% (36)Unmarried:
0.0% (0)
Women who did not give birth in the past 12 months Now married:
49.3% (128)Unmarried:
50.7% (132)
Marital status - White alone, not Hispanic / Latino population 15 years and over
Males 31.4% Never married63.4% Now married0.1% Separated0.9% Widowed4.2% DivorcedFemales 25.6% Never married66.6% Now married0.4% Separated2.7% Widowed4.7% DivorcedWomen who gave birth in the past 12 months Now married:
89.6% (217)Unmarried:
10.4% (25)
Women who did not give birth in the past 12 months Now married:
58.0% (2,242)Unmarried:
42.0% (1,624)
Marital status - Hispanic or Latino population 15 years and over
Males 53.8% Never married46.2% Now married0.0% Separated0.0% Widowed0.0% DivorcedFemales 22.9% Never married72.9% Now married0.0% Separated0.0% Widowed4.2% DivorcedWomen who gave birth in the past 12 months Now married:
100.0% (31)Unmarried:
0.0% (0)
Women who did not give birth in the past 12 months Now married:
64.4% (84)Unmarried:
35.6% (46)
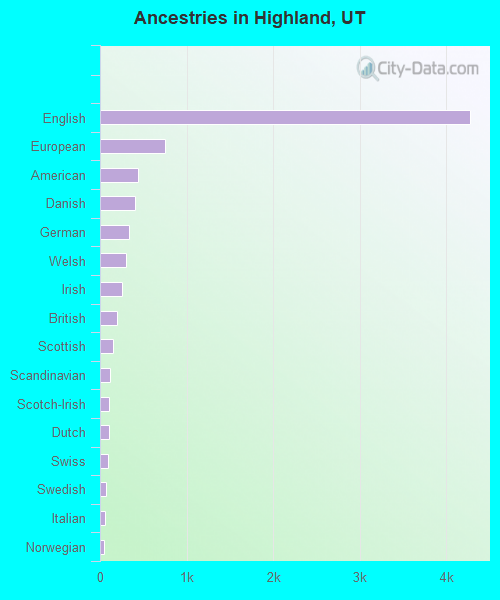
Ancestries in Highland
4,280 47.1% English751 8.3% European441 4.9% American407 4.5% Danish335 3.7% German295 3.2% Welsh250 2.8% Irish202 2.2% British151 1.7% Scottish113 1.2% Scandinavian103 1.1% Scotch-Irish101 1.1% Dutch96 1.1% Swiss74 0.8% Swedish59 0.6% Italian49 0.5% Norwegian33 0.4% Northern European23 0.3% Pennsylvania German16 0.2% Ukrainian11 0.1% French10 0.1% Finnish9 0.10% Slovak7 0.08% Romanian6 0.07% Brazilian4 0.04% Czechoslovakian
Children Nativity (place of birth) in Highland
Children under 6 years - Living with two parents Both parents native 1,414 100.0% NativeOne native, one foreign-born parent 74 100.0% NativeChildren under 6 years - Living with one parent Native parent 232 100.0% NativeChildren 6 to 17 years - Living with two parents Both parents native 4,908 99.4% Native28 0.6% Foreign-bornBoth parents foreign-born 21 35.0% Native39 65.0% Foreign-bornOne native, one foreign-born parent 215 100.0% NativeChildren 6 to 17 years - Living with one parent Native parent 573 100.0% NativeForeign-born parent 22 49.5% Native22 50.5% Foreign-born
Grandparents responsible for own grandchildren in Highland
Grandparents (30 to 59 years) White / Caucasian 33 17.0% Responsible for grandchildren161 83.0% Not responsible for grandchildrenTwo or more races 7 100.0% Not responsible for grandchildrenWhite alone, not Hispanic / Latino 36 16.1% Responsible for grandchildren186 83.9% Not responsible for grandchildrenHispanic or Latino 5 100.0% Not responsible for grandchildrenGrandparents (60 years and over) White / Caucasian 103 31.6% Responsible for grandchildren224 68.4% Not responsible for grandchildrenWhite alone, not Hispanic / Latino 106 30.9% Responsible for grandchildren237 69.1% Not responsible for grandchildren