Races in Hicksville, New York (NY) Detailed Stats
Data:
Races - White alone (%)
Races - White alone (% change since 2000)
Races - Black alone (%)
Races - Black alone (% change since 2000)
Races - American Indian alone (%)
Races - American Indian alone (% change since 2000)
Races - Asian alone (%)
Races - Asian alone (% change since 2000)
Races - Hispanic (%)
Races - Hispanic (% change since 2000)
Races - Native Hawaiian and Other Pacific Islander alone (%)
Races - Native Hawaiian and Other Pacific Islander alone (% change since 2000)
Races - Two or more races(%)
Races - Two or more races(% change since 2000)
Races - Other race alone (%)
Races - Other race alone (% change since 2000)
Racial diversity
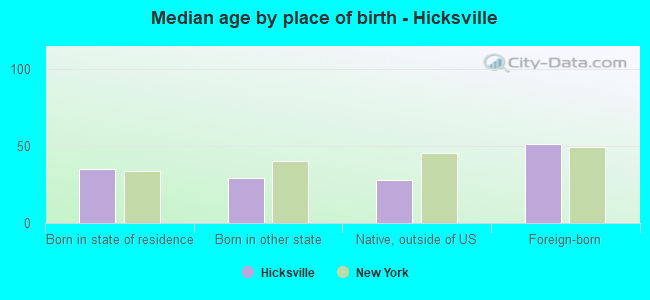
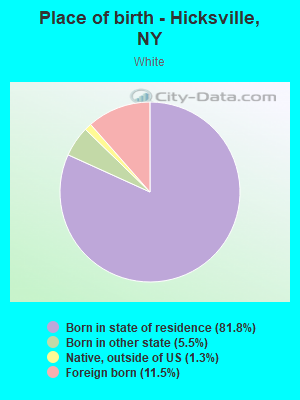
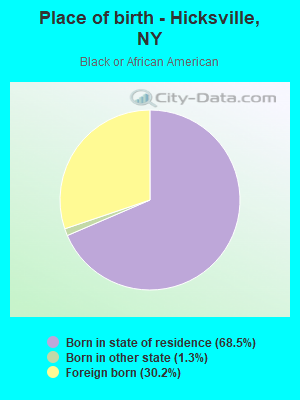
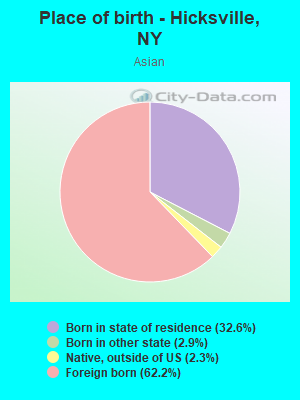
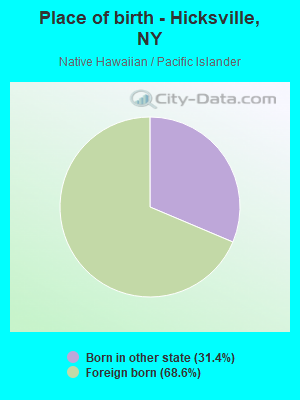
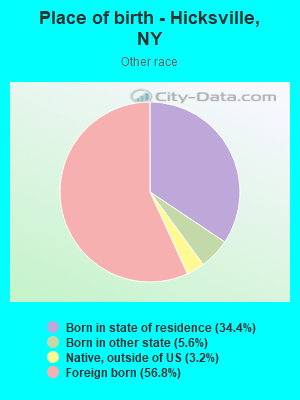
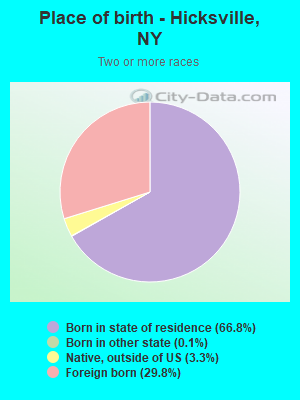
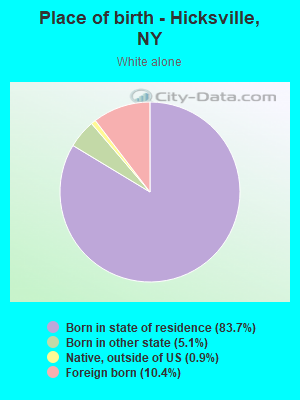
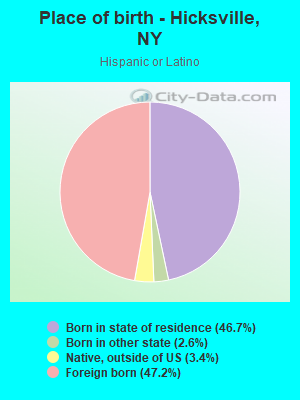
Place of birth - Born in state of residence (%)
Place of birth - Born in state of residence (%) - White
Place of birth - Born in state of residence (%) - Black or African American
Place of birth - Born in state of residence (%) - Asian
Place of birth - Born in state of residence (%) - Hispanic or Latino
Place of birth - Born in state of residence (%) - American Indian and Alaska Native
Place of birth - Born in state of residence (%) - Multirace
Place of birth - Born in state of residence (%) - Other Race
Place of birth - Born in other state (%)
Place of birth - Born in other state (%) - White
Place of birth - Born in other state (%) - Black or African American
Place of birth - Born in other state (%) - Asian
Place of birth - Born in other state (%) - Hispanic or Latino
Place of birth - Born in other state (%) - American Indian and Alaska Native
Place of birth - Born in other state (%) - Multirace
Place of birth - Born in other state (%) - Other Race
Place of birth - Native, outside of US (%)
Place of birth - Native, outside of US (%) - White
Place of birth - Native, outside of US (%) - Black or African American
Place of birth - Native, outside of US (%) - Asian
Place of birth - Native, outside of US (%) - Hispanic or Latino
Place of birth - Native, outside of US (%) - American Indian and Alaska Native
Place of birth - Native, outside of US (%) - Multirace
Place of birth - Native, outside of US (%) - Other Race
Place of birth - Foreign born (%)
Place of birth - Foreign born (%) - White
Place of birth - Foreign born (%) - Black or African American
Place of birth - Foreign born (%) - Asian
Place of birth - Foreign born (%) - Hispanic or Latino
Place of birth - Foreign born (%) - American Indian and Alaska Native
Place of birth - Foreign born (%) - Multirace
Place of birth - Foreign born (%) - Other Race
Residents speaking English at home (%)
Residents speaking English at home - Born in the United States (%)
Residents speaking English at home - Native, born elsewhere (%)
Residents speaking English at home - Foreign born (%)
Residents speaking Spanish at home (%)
Residents speaking Spanish at home - Born in the United States (%)
Residents speaking Spanish at home - Native, born elsewhere (%)
Residents speaking Spanish at home - Foreign born (%)
Residents speaking other language at home (%)
Residents speaking other language at home - Born in the United States (%)
Residents speaking other language at home - Native, born elsewhere (%)
Residents speaking other language at home - Foreign born (%)
Marital status - Never married (%)
Marital status - Now married (%)
Marital status - Separated (%)
Marital status - Widowed (%)
Marital status - Divorced (%)
Ancestries Reported - Arab (%)
Ancestries Reported - Czech (%)
Ancestries Reported - Danish (%)
Ancestries Reported - Dutch (%)
Ancestries Reported - English (%)
Ancestries Reported - French (%)
Ancestries Reported - French Canadian (%)
Ancestries Reported - German (%)
Ancestries Reported - Greek (%)
Ancestries Reported - Hungarian (%)
Ancestries Reported - Irish (%)
Ancestries Reported - Italian (%)
Ancestries Reported - Lithuanian (%)
Ancestries Reported - Norwegian (%)
Ancestries Reported - Polish (%)
Ancestries Reported - Portuguese (%)
Ancestries Reported - Russian (%)
Ancestries Reported - Scotch-Irish (%)
Ancestries Reported - Scottish (%)
Ancestries Reported - Slovak (%)
Ancestries Reported - Subsaharan African (%)
Ancestries Reported - Swedish (%)
Ancestries Reported - Swiss (%)
Ancestries Reported - Ukrainian (%)
Ancestries Reported - United States (%)
Ancestries Reported - Welsh (%)
Ancestries Reported - West Indian (%)
Ancestries Reported - Other (%)
Geographical mobility - Same house 1 year ago (%)
Geographical mobility - Same house 1 year ago (%) - White
Geographical mobility - Same house 1 year ago (%) - Black or African American
Geographical mobility - Same house 1 year ago (%) - Asian
Geographical mobility - Same house 1 year ago (%) - Hispanic or Latino
Geographical mobility - Same house 1 year ago (%) - American Indian and Alaska Native
Geographical mobility - Same house 1 year ago (%) - Multirace
Geographical mobility - Same house 1 year ago (%) - Other Race
Geographical mobility - Moved within same county (%)
Geographical mobility - Moved within same county (%) - White
Geographical mobility - Moved within same county (%) - Black or African American
Geographical mobility - Moved within same county (%) - Asian
Geographical mobility - Moved within same county (%) - Hispanic or Latino
Geographical mobility - Moved within same county (%) - American Indian and Alaska Native
Geographical mobility - Moved within same county (%) - Multirace
Geographical mobility - Moved within same county (%) - Other Race
Geographical mobility - Moved from different county within same state (%)
Geographical mobility - Moved from different county within same state (%) - White
Geographical mobility - Moved from different county within same state (%) - Black or African American
Geographical mobility - Moved from different county within same state (%) - Asian
Geographical mobility - Moved from different county within same state (%) - Hispanic or Latino
Geographical mobility - Moved from different county within same state (%) - American Indian and Alaska Native
Geographical mobility - Moved from different county within same state (%) - Multirace
Geographical mobility - Moved from different county within same state (%) - Other Race
Geographical mobility - Moved from different state (%)
Geographical mobility - Moved from different state (%) - White
Geographical mobility - Moved from different state (%) - Black or African American
Geographical mobility - Moved from different state (%) - Asian
Geographical mobility - Moved from different state (%) - Hispanic or Latino
Geographical mobility - Moved from different state (%) - American Indian and Alaska Native
Geographical mobility - Moved from different state (%) - Multirace
Geographical mobility - Moved from different state (%) - Other Race
Geographical mobility - Moved from abroad (%)
Geographical mobility - Moved from abroad (%) - White
Geographical mobility - Moved from abroad (%) - Black or African American
Geographical mobility - Moved from abroad (%) - Asian
Geographical mobility - Moved from abroad (%) - Hispanic or Latino
Geographical mobility - Moved from abroad (%) - American Indian and Alaska Native
Geographical mobility - Moved from abroad (%) - Multirace
Geographical mobility - Moved from abroad (%) - Other Race
Place of birth for the foreign-born population - Ireland (%)
Place of birth for the foreign-born population - Denmark (%)
Place of birth for the foreign-born population - Norway (%)
Place of birth for the foreign-born population - Sweden (%)
Place of birth for the foreign-born population - United Kingdom (%)
Place of birth for the foreign-born population - England (%)
Place of birth for the foreign-born population - Scotland (%)
Place of birth for the foreign-born population - Other Northern Europe (%)
Place of birth for the foreign-born population - Austria (%)
Place of birth for the foreign-born population - Belgium (%)
Place of birth for the foreign-born population - France (%)
Place of birth for the foreign-born population - Germany (%)
Place of birth for the foreign-born population - Netherlands (%)
Place of birth for the foreign-born population - Switzerland (%)
Place of birth for the foreign-born population - Other Western Europe (%)
Place of birth for the foreign-born population - Greece (%)
Place of birth for the foreign-born population - Italy (%)
Place of birth for the foreign-born population - Portugal (%)
Place of birth for the foreign-born population - Spain (%)
Place of birth for the foreign-born population - Other Southern Europe (%)
Place of birth for the foreign-born population - Albania (%)
Place of birth for the foreign-born population - Belarus (%)
Place of birth for the foreign-born population - Bosnia and Herzegovina (%)
Place of birth for the foreign-born population - Bulgaria (%)
Place of birth for the foreign-born population - Croatia (%)
Place of birth for the foreign-born population - Czechoslovakia (%)
Place of birth for the foreign-born population - Hungary (%)
Place of birth for the foreign-born population - Latvia (%)
Place of birth for the foreign-born population - Lithuania (%)
Place of birth for the foreign-born population - North Macedonia (Macedonia) (%)
Place of birth for the foreign-born population - Moldova (%)
Place of birth for the foreign-born population - Poland (%)
Place of birth for the foreign-born population - Romania (%)
Place of birth for the foreign-born population - Russia (%)
Place of birth for the foreign-born population - Serbia (%)
Place of birth for the foreign-born population - Ukraine (%)
Place of birth for the foreign-born population - Other Eastern Europe (%)
Place of birth for the foreign-born population - China (%)
Place of birth for the foreign-born population - Hong Kong (%)
Place of birth for the foreign-born population - Taiwan (%)
Place of birth for the foreign-born population - Japan (%)
Place of birth for the foreign-born population - Korea (%)
Place of birth for the foreign-born population - Other Eastern Asia (%)
Place of birth for the foreign-born population - Afghanistan (%)
Place of birth for the foreign-born population - Bangladesh (%)
Place of birth for the foreign-born population - India (%)
Place of birth for the foreign-born population - Iran (%)
Place of birth for the foreign-born population - Kazakhstan (%)
Place of birth for the foreign-born population - Nepal (%)
Place of birth for the foreign-born population - Pakistan (%)
Place of birth for the foreign-born population - Sri Lanka (%)
Place of birth for the foreign-born population - Uzbekistan (%)
Place of birth for the foreign-born population - Other South Central Asia (%)
Place of birth for the foreign-born population - Burma (%)
Place of birth for the foreign-born population - Cambodia (%)
Place of birth for the foreign-born population - Indonesia (%)
Place of birth for the foreign-born population - Laos (%)
Place of birth for the foreign-born population - Malaysia (%)
Place of birth for the foreign-born population - Philippines (%)
Place of birth for the foreign-born population - Singapore (%)
Place of birth for the foreign-born population - Thailand (%)
Place of birth for the foreign-born population - Vietnam (%)
Place of birth for the foreign-born population - Other South Eastern Asia (%)
Place of birth for the foreign-born population - Armenia (%)
Place of birth for the foreign-born population - Iraq (%)
Place of birth for the foreign-born population - Israel (%)
Place of birth for the foreign-born population - Jordan (%)
Place of birth for the foreign-born population - Kuwait (%)
Place of birth for the foreign-born population - Lebanon (%)
Place of birth for the foreign-born population - Saudi Arabia (%)
Place of birth for the foreign-born population - Syria (%)
Place of birth for the foreign-born population - Turkey (%)
Place of birth for the foreign-born population - Yemen (%)
Place of birth for the foreign-born population - Other Western Asia (%)
Place of birth for the foreign-born population - Eritrea (%)
Place of birth for the foreign-born population - Ethiopia (%)
Place of birth for the foreign-born population - Kenya (%)
Place of birth for the foreign-born population - Somalia (%)
Place of birth for the foreign-born population - Uganda (%)
Place of birth for the foreign-born population - Zimbabwe (%)
Place of birth for the foreign-born population - Other Eastern Africa (%)
Place of birth for the foreign-born population - Cameroon (%)
Place of birth for the foreign-born population - Congo (%)
Place of birth for the foreign-born population - Democratic Republic of Congo (Zaire) (%)
Place of birth for the foreign-born population - Other Middle Africa (%)
Place of birth for the foreign-born population - Egypt (%)
Place of birth for the foreign-born population - Morocco (%)
Place of birth for the foreign-born population - Sudan (%)
Place of birth for the foreign-born population - Other Northern Africa (%)
Place of birth for the foreign-born population - South Africa (%)
Place of birth for the foreign-born population - Other Southern Africa (%)
Place of birth for the foreign-born population - Cabo Verde (%)
Place of birth for the foreign-born population - Ghana (%)
Place of birth for the foreign-born population - Liberia (%)
Place of birth for the foreign-born population - Nigeria (%)
Place of birth for the foreign-born population - Senegal (%)
Place of birth for the foreign-born population - Sierra Leone (%)
Place of birth for the foreign-born population - Other Western Africa (%)
Place of birth for the foreign-born population - Australia (%)
Place of birth for the foreign-born population - New Zealand (%)
Place of birth for the foreign-born population - Fiji (%)
Place of birth for the foreign-born population - Micronesia (%)
Place of birth for the foreign-born population - Bahamas (%)
Place of birth for the foreign-born population - Barbados (%)
Place of birth for the foreign-born population - Cuba (%)
Place of birth for the foreign-born population - Dominica (%)
Place of birth for the foreign-born population - Dominican Republic (%)
Place of birth for the foreign-born population - Grenada (%)
Place of birth for the foreign-born population - Haiti (%)
Place of birth for the foreign-born population - Jamaica (%)
Place of birth for the foreign-born population - St. Vincent and the Grenadines (%)
Place of birth for the foreign-born population - Trinidad and Tobago (%)
Place of birth for the foreign-born population - West Indies (%)
Place of birth for the foreign-born population - Other Caribbean (%)
Place of birth for the foreign-born population - Belize (%)
Place of birth for the foreign-born population - Costa Rica (%)
Place of birth for the foreign-born population - El Salvador (%)
Place of birth for the foreign-born population - Guatemala (%)
Place of birth for the foreign-born population - Honduras (%)
Place of birth for the foreign-born population - Mexico (%)
Place of birth for the foreign-born population - Nicaragua (%)
Place of birth for the foreign-born population - Panama (%)
Place of birth for the foreign-born population - Other Central America (%)
Place of birth for the foreign-born population - Argentina (%)
Place of birth for the foreign-born population - Bolivia (%)
Place of birth for the foreign-born population - Brazil (%)
Place of birth for the foreign-born population - Chile (%)
Place of birth for the foreign-born population - Colombia (%)
Place of birth for the foreign-born population - Ecuador (%)
Place of birth for the foreign-born population - Guyana (%)
Place of birth for the foreign-born population - Peru (%)
Place of birth for the foreign-born population - Uruguay (%)
Place of birth for the foreign-born population - Venezuela (%)
Place of birth for the foreign-born population - Other South America (%)
Place of birth for the foreign-born population - Canada (%)
Place of birth for the foreign-born population - Other Northern America (%)
Place of birth for the foreign-born population - Other (%)
Latest news about races in Hicksville, NY collected exclusively by city-data.com from local newspapers, TV, and radio stations
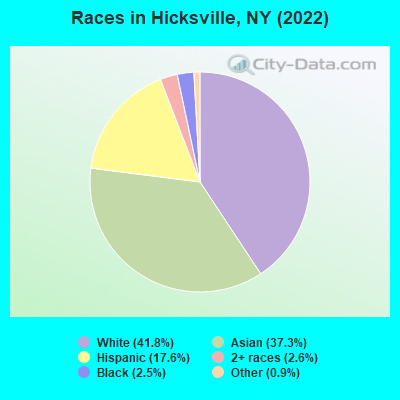
According to 2022 data, the most numerous races in Hicksville, NY are White alone (18,374 residents), Hispanic (7,712 residents), and Black alone (1,094 residents). 53.3% of Hicksville residents speak English at home. 34.0% of Hicksville, NY residents are foreign-born (20.3% born in Asia, 10.2% born in Latin America), which is 35.2% greater than the foreign-born rate of 22.0% across the entire state of New York.
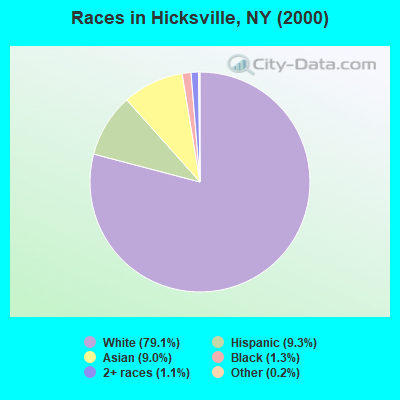
Race distribution in Hicksville
2000 2022
11,760,981 62.0% White alone 2,867,583 15.1% Hispanic 2,812,623 14.8% Black alone 1,035,926 5.5% Asian alone 366,116 1.9% Two or more races 75,499 0.4% Other race alone 52,499 0.3% American Indian alone 5,230 0.03% Native Hawaiian and Other
10,408,933 52.9% White alone 3,867,299 19.7% Hispanic 2,633,840 13.4% Black alone 1,776,286 9.0% Asian alone 732,670 3.7% Two or more races 216,110 1.1% Other race alone 35,082 0.2% American Indian alone 6,931 0.04% Native Hawaiian and Other
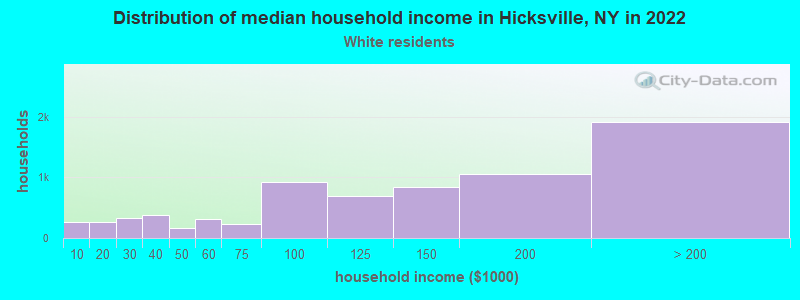
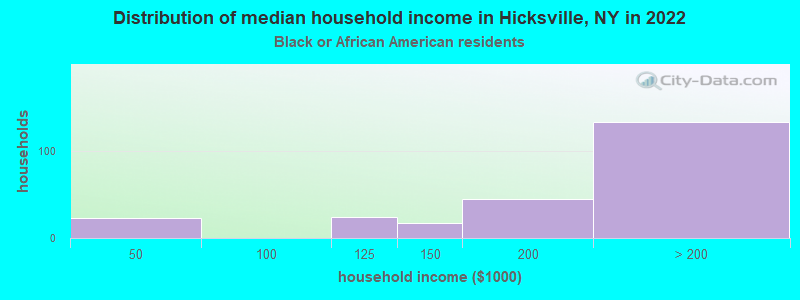
Income and house value in Hicksville Median household income in 2022 $133,450 White non-Hispanic householdersover $200,000 Black householders$143,886 Asian householders$106,458 Some other race householdersover $200,000 Two or more races householders$136,714 Hispanic or Latino race householdersMedian 2022 house value $605,911 White Non-Hispanic householders$651,840 Black or African American householders$552,032 American Indian or Alaska Native householders $681,871 Asian householders$522,591 Some other race householders$733,099 Two or more races householders$622,104 Hispanic or Latino householders
Median age by race in Hicksville
53.6 Median age for White residents51.5 56.0 40.5 Median age for Black or African American residents39.9 43.0 29.4 Median age for American Indian / Alaska Native residents-607,543,322.5 -837,121,211.3 37.0 Median age for Asian residents36.2 37.4 -487,992,314.6 Median age for Native Hawaiian / Pacific Islander residents-477,502,295.2 -497,387,669.3 39.3 Median age for Other race residents35.5 47.9 29.6 Median age for Two or more races residents28.8 32.3 53.4 Median age for White alone residents51.9 55.5 33.1 Median age for Hispanic or Latino residents31.1 40.1
Owner/renter occupied households by race in Hicksville
House owners and renters - White residents 6,539 88.7% Owner occupied832 11.3% Renter occupiedHouse owners and renters - Black or African American residents 204 84.7% Owner occupied37 15.3% Renter occupiedHouse owners and renters - American Indian / Alaska Native residents 94 100.0% Renter occupiedHouse owners and renters - Asian residents 3,890 90.0% Owner occupied433 10.0% Renter occupiedHouse owners and renters - Native Hawaiian / Pacific Islander residents 30 100.0% Owner occupiedHouse owners and renters - Other race residents 765 81.3% Owner occupied177 18.7% Renter occupiedHouse owners and renters - Two or more races residents 670 67.6% Owner occupied322 32.4% Renter occupiedHouse owners and renters - White alone residents 6,445 90.3% Owner occupied694 9.7% Renter occupiedHouse owners and renters - Hispanic or Latino residents 1,186 66.4% Owner occupied601 33.6% Renter occupied
Language usage in Hicksville
English speakers - Total 53.3% of residents of Hicksville speak English at home.
12.0% of residents speak Spanish at home 2,878 56.6% Speak English very well2,204 43.4% Speak English less than very well35.9% of residents speak other language at home 9,379 61.9% Speak English very well5,775 38.1% Speak English less than very well
English speakers - Born in the United States 77.3% of residents of Hicksville speak English at home.
6.5% of residents speak Spanish at home 90 82.6% Speak English very well19 17.4% Speak English less than very well15.1% of residents speak other language at home 227 89.0% Speak English very well28 11.0% Speak English less than very well
English speakers - Native, born elsewhere 44.9% of residents of Hicksville speak English at home.
14.1% of residents speak Spanish at home 135 100.0% Speak English very well42.7% of residents speak other language at home 357 87.5% Speak English very well51 12.5% Speak English less than very well
English speakers - Foreign-born 11.6% of residents of Hicksville speak English at home.
20.6% of residents speak Spanish at home 1,185 37.4% Speak English very well1,981 62.6% Speak English less than very well70.0% of residents speak other language at home 5,557 51.6% Speak English very well5,209 48.4% Speak English less than very well
White (Caucasian) - Speak only English Native:
94.6% (15,233)Foreign-born:
31.9% (688)
White (Caucasian) - Speak another language Native:
5.6% (901)Foreign-born:
68.6% (1,479)
Black or African American - Speak only English Native:
72.7% (534)Foreign-born:
36.2% (118)
Black or African American - Speak another language Native:
28.8% (212)Foreign-born:
64.3% (209)
Asian - Speak only English Native:
38.9% (2,177)Foreign-born:
6.5% (662)
Asian - Speak another language Native:
60.4% (3,384)Foreign-born:
94.9% (9,667)
Other race - Speak only English Native:
62.4% (863)Foreign-born:
9.9% (190)
Other race - Speak another language Native:
41.1% (569)Foreign-born:
89.3% (1,714)
Two or more races - Speak only English Native:
61.3% (2,248)Foreign-born:
5.0% (88)
Two or more races - Speak another language Native:
39.8% (1,462)Foreign-born:
97.0% (1,695)
White alone - Speak only English Native:
95.0% (15,083)Foreign-born:
29.5% (562)
White alone - Speak another language Native:
5.0% (796)Foreign-born:
70.6% (1,347)
Hispanic or Latino - Speak only English Native:
54.7% (2,030)Foreign-born:
11.1% (399)
Hispanic or Latino - Speak another language Native:
45.1% (1,674)Foreign-born:
88.9% (3,186)
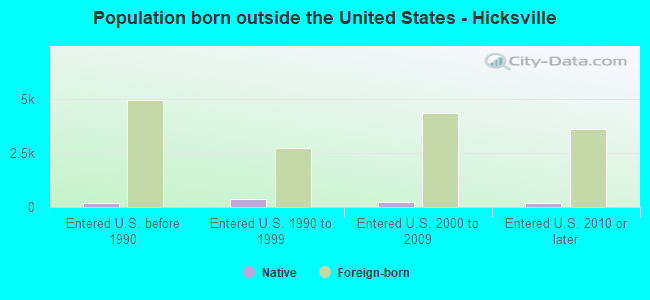
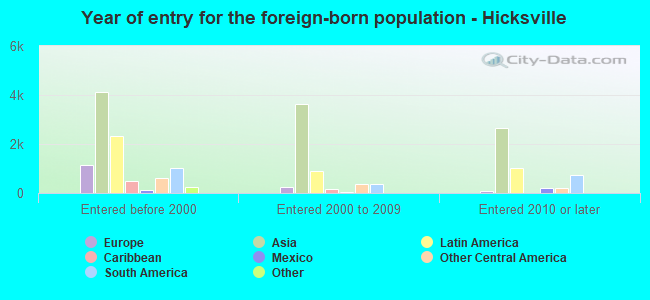
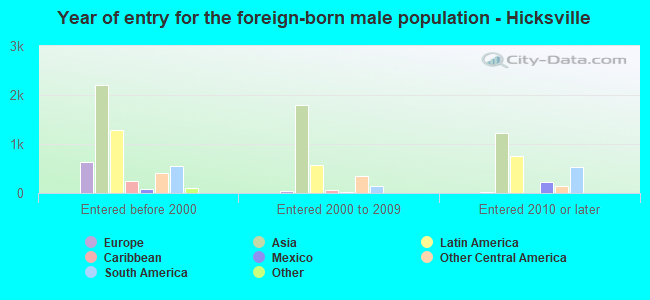
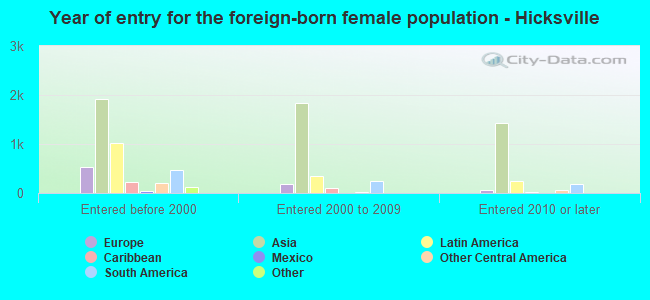
Foreign-born residents in Hicksville 14,915 residents are foreign born (20.3% Asia , 10.2% Latin America ).
This city:
34.0%New York:
22.6%
Marital status for residents in Hicksville Marital status - White (Caucasian) population 15 years and over
Males 33.4% Never married56.7% Now married0.7% Separated3.3% Widowed5.9% DivorcedFemales 25.9% Never married49.5% Now married0.8% Separated15.0% Widowed8.8% DivorcedWomen who gave birth in the past 12 months Now married:
100.0% (82)Unmarried:
0.0% (0)
Women who did not give birth in the past 12 months Now married:
37.2% (1,211)Unmarried:
62.8% (2,048)
Marital status - Black or African American population 15 years and over
Males 37.5% Never married56.4% Now married0.0% Separated0.0% Widowed6.0% DivorcedFemales 33.3% Never married57.3% Now married0.0% Separated3.9% Widowed5.5% DivorcedWomen who did not give birth in the past 12 months Now married:
57.7% (138)Unmarried:
42.3% (101)
Marital status - American Indian / Alaska Native population 15 years and over
Males 100.0% Never married0.0% Now married0.0% Separated0.0% Widowed0.0% DivorcedFemales 100.0% Never married0.0% Now married0.0% Separated0.0% Widowed0.0% DivorcedWomen who did not give birth in the past 12 months Now married:
0.0% (0)Unmarried:
100.0% (102)
Marital status - Asian population 15 years and over
Males 34.8% Never married58.6% Now married0.3% Separated2.9% Widowed3.4% DivorcedFemales 29.8% Never married60.5% Now married0.3% Separated5.3% Widowed4.0% DivorcedWomen who gave birth in the past 12 months Now married:
73.4% (103)Unmarried:
26.6% (37)
Women who did not give birth in the past 12 months Now married:
53.2% (2,075)Unmarried:
46.8% (1,825)
Marital status - Other race population 15 years and over
Males 43.9% Never married52.1% Now married0.0% Separated2.8% Widowed1.1% DivorcedFemales 24.7% Never married57.1% Now married1.6% Separated6.7% Widowed9.9% DivorcedWomen who gave birth in the past 12 months Now married:
100.0% (139)Unmarried:
0.0% (0)
Women who did not give birth in the past 12 months Now married:
59.9% (383)Unmarried:
40.1% (257)
Marital status - Two or more races population 15 years and over
Males 44.2% Never married41.9% Now married0.0% Separated5.4% Widowed8.4% DivorcedFemales 35.9% Never married49.6% Now married0.8% Separated8.4% Widowed5.4% DivorcedWomen who did not give birth in the past 12 months Now married:
37.4% (337)Unmarried:
62.6% (565)
Marital status - White alone, not Hispanic / Latino population 15 years and over
Males 32.2% Never married57.1% Now married0.6% Separated3.7% Widowed6.4% DivorcedFemales 25.8% Never married49.1% Now married0.8% Separated15.7% Widowed8.6% DivorcedWomen who gave birth in the past 12 months Now married:
100.0% (88)Unmarried:
0.0% (0)
Women who did not give birth in the past 12 months Now married:
36.7% (1,203)Unmarried:
63.3% (2,072)
Marital status - Hispanic or Latino population 15 years and over
Males 46.2% Never married46.3% Now married0.3% Separated3.7% Widowed3.4% DivorcedFemales 31.5% Never married54.9% Now married1.1% Separated3.7% Widowed8.8% DivorcedWomen who gave birth in the past 12 months Now married:
100.0% (82)Unmarried:
0.0% (0)
Women who did not give birth in the past 12 months Now married:
44.9% (577)Unmarried:
55.1% (709)
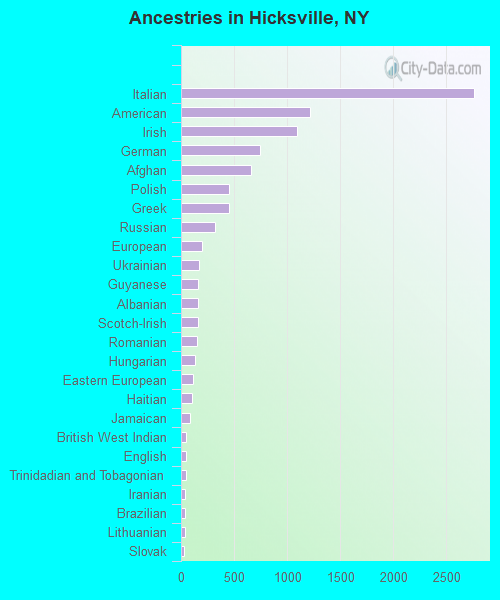
Ancestries in Hicksville
2,765 11.6% Italian1,219 5.1% American1,090 4.6% Irish749 3.1% German660 2.8% Afghan457 1.9% Polish452 1.9% Greek321 1.3% Russian202 0.8% European171 0.7% Ukrainian163 0.7% Guyanese157 0.7% Albanian156 0.7% Scotch-Irish154 0.6% Romanian130 0.5% Hungarian110 0.5% Eastern European108 0.5% Haitian83 0.3% Jamaican51 0.2% British West Indian50 0.2% English50 0.2% Trinidadian and Tobagonian40 0.2% Iranian37 0.2% Brazilian34 0.1% Lithuanian28 0.1% Slovak26 0.1% African24 0.1% Portuguese23 0.10% Egyptian20 0.08% Turkish19 0.08% British14 0.06% Czech14 0.06% Israeli14 0.06% Swiss13 0.05% West Indian12 0.05% Austrian11 0.05% Scottish10 0.04% Armenian10 0.04% Northern European8 0.03% French7 0.03% Welsh6 0.03% Yugoslavian5 0.02% Czechoslovakian
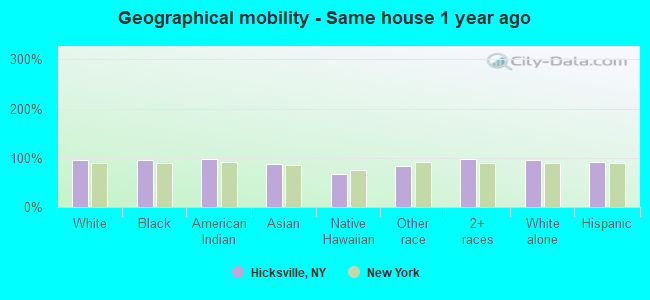
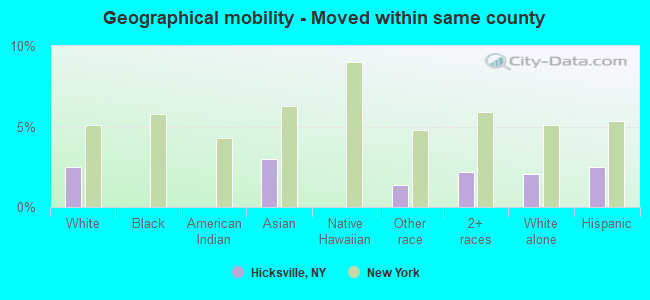
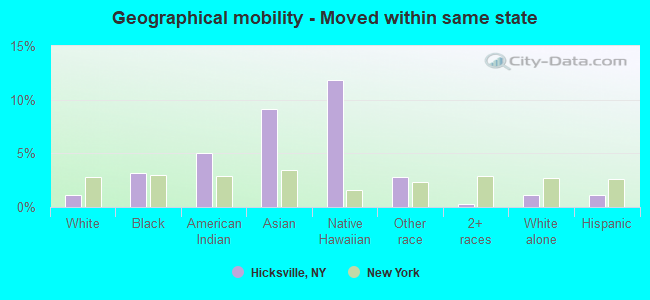
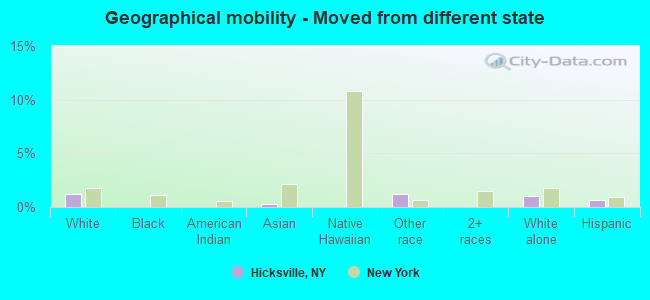
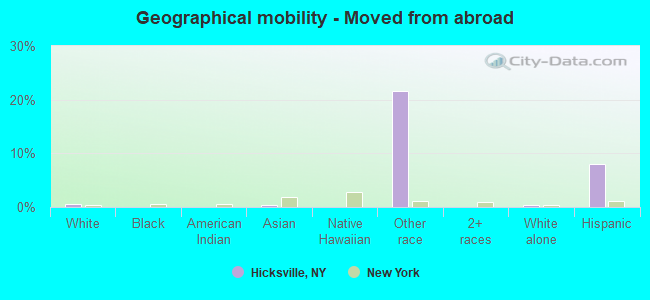
Geographical mobility in Hicksville Same house 1 year ago 17,864 94.6% White (Caucasian)1,042 96.1% Black or African American193 97.9% American Indian / Alaska Native14,396 87.9% Asian19 67.3% Native Hawaiian / Pacific Islander2,829 82.4% Other race5,596 97.0% Two or more races17,441 95.2% White alone, not Hispanic / Latino6,965 90.8% Hispanic or LatinoMoved within same county 474 2.5% White / Caucasian492 3.0% Asian47 1.4% Other race125 2.2% Two or more races373 2.0% White alone, not Hispanic / Latino191 2.5% Hispanic or LatinoMoved within same state 207 1.1% White / Caucasian34 3.2% Black or African American10 5.0% American Indian / Alaska Native1,498 9.1% Asian3 11.9% Native Hawaiian / Pacific Islander97 2.8% Other race16 0.3% Two or more races212 1.2% White alone, not Hispanic / Latino83 1.1% Hispanic or LatinoMoved from different state 224 1.2% White / Caucasian50 0.3% Asian41 1.2% Other race196 1.1% White alone, not Hispanic / Latino51 0.7% Hispanic or LatinoMoved from abroad 92 0.5% White73 0.4% Asian743 21.6% Other race79 0.4% White alone, not Hispanic / Latino609 7.9% Hispanic or Latino
Children Nativity (place of birth) in Hicksville
Children under 6 years - Living with two parents Both parents native 1,056 100.0% NativeBoth parents foreign-born 682 100.0% NativeOne native, one foreign-born parent 381 100.0% NativeChildren under 6 years - Living with one parent Native parent 220 100.0% NativeForeign-born parent 90 100.0% NativeChildren 6 to 17 years - Living with two parents Both parents native 1,214 100.0% NativeBoth parents foreign-born 1,617 90.3% Native173 9.7% Foreign-bornOne native, one foreign-born parent 866 100.0% NativeChildren 6 to 17 years - Living with one parent Native parent 594 100.0% NativeForeign-born parent 538 60.5% Native352 39.5% Foreign-born
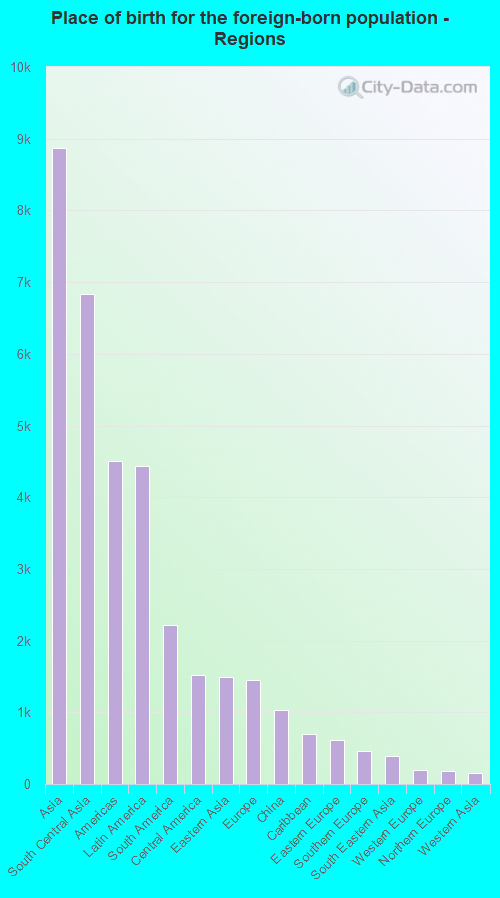
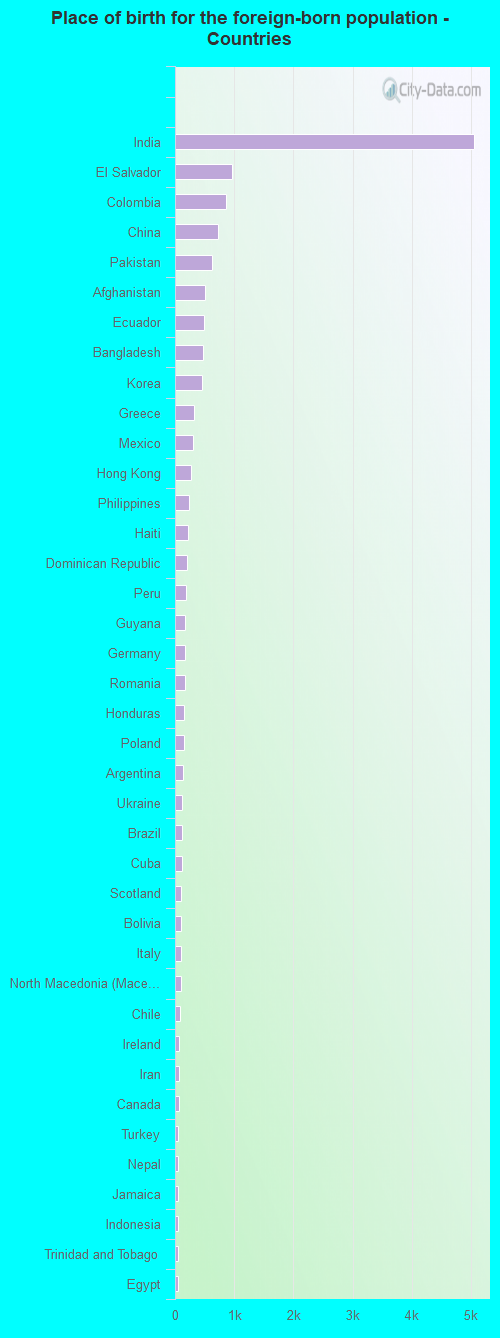
Place of birth for residents in Hicksville 8,865 Asia6,828 South Central Asia4,507 Americas4,437 Latin America2,218 South America1,516 Central America1,497 Eastern Asia1,451 Europe1,037 China702 Caribbean612 Eastern Europe460 Southern Europe384 South Eastern Asia197 Western Europe180 Northern Europe154 Western Asia76 Africa70 Northern America48 Northern Africa27 Eastern Africa15 Oceania15 Australia and New Zealand Subregion5,054 India962 El Salvador865 Colombia734 China626 Pakistan508 Afghanistan488 Ecuador481 Bangladesh449 Korea323 Greece309 Mexico269 Hong Kong244 Philippines225 Haiti199 Dominican Republic193 Peru177 Guyana173 Germany166 Romania158 Honduras147 Poland128 Argentina123 Ukraine121 Brazil120 Cuba103 Scotland103 Bolivia96 Italy94 North Macedonia (Macedonia)90 Chile76 Ireland76 Iran70 Canada56 Turkey53 Nepal50 Jamaica50 Indonesia49 Trinidad and Tobago48 Egypt45 Burma (Myanmar)45 Costa Rica40 Guatemala36 Grenada33 Taiwan32 Albania32 Israel30 Portugal28 Sri Lanka27 Russia27 Tanzania25 Vietnam24 Uruguay23 Venezuela21 United Arab Emirates19 Barbados18 Malaysia15 Australia15 France10 Japan9 Croatia9 Spain8 Austria5 Hungary3 Czechoslovakia
Grandparents responsible for own grandchildren in Hicksville
Grandparents (30 to 59 years) White / Caucasian 44 43.8% Responsible for grandchildren56 56.2% Not responsible for grandchildrenAsian 19 100.0% Not responsible for grandchildrenTwo or more races 190 100.0% Not responsible for grandchildrenWhite alone, not Hispanic / Latino 46 56.8% Responsible for grandchildren35 43.2% Not responsible for grandchildrenHispanic or Latino 151 100.0% Not responsible for grandchildrenGrandparents (60 years and over) White / Caucasian 105 18.4% Responsible for grandchildren464 81.6% Not responsible for grandchildrenAsian 18 3.6% Responsible for grandchildren496 96.4% Not responsible for grandchildrenTwo or more races 273 100.0% Not responsible for grandchildrenWhite alone, not Hispanic / Latino 98 17.5% Responsible for grandchildren464 82.5% Not responsible for grandchildrenHispanic or Latino 37 16.5% Responsible for grandchildren188 83.5% Not responsible for grandchildren