Races in Hibbing, Minnesota (MN) Detailed Stats
Data:
Races - White alone (%)
Races - White alone (% change since 2000)
Races - Black alone (%)
Races - Black alone (% change since 2000)
Races - American Indian alone (%)
Races - American Indian alone (% change since 2000)
Races - Asian alone (%)
Races - Asian alone (% change since 2000)
Races - Hispanic (%)
Races - Hispanic (% change since 2000)
Races - Native Hawaiian and Other Pacific Islander alone (%)
Races - Native Hawaiian and Other Pacific Islander alone (% change since 2000)
Races - Two or more races(%)
Races - Two or more races(% change since 2000)
Races - Other race alone (%)
Races - Other race alone (% change since 2000)
Racial diversity
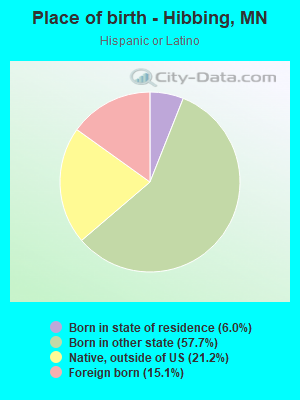
Place of birth - Born in state of residence (%)
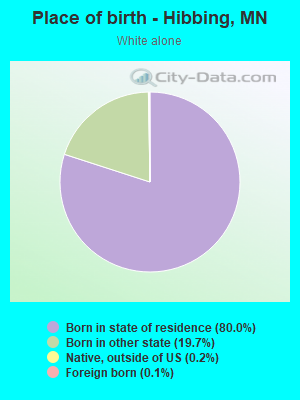
Place of birth - Born in state of residence (%) - White
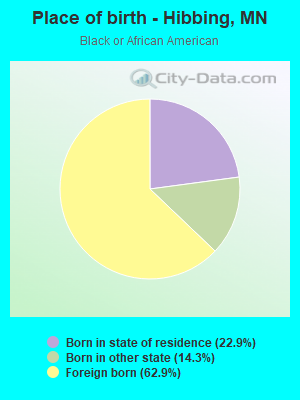
Place of birth - Born in state of residence (%) - Black or African American
Place of birth - Born in state of residence (%) - Asian
Place of birth - Born in state of residence (%) - Hispanic or Latino
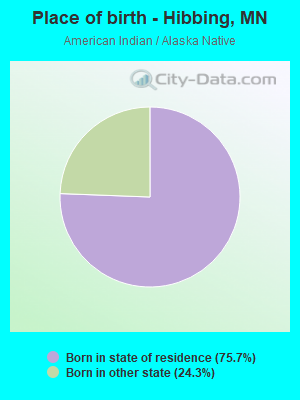
Place of birth - Born in state of residence (%) - American Indian and Alaska Native
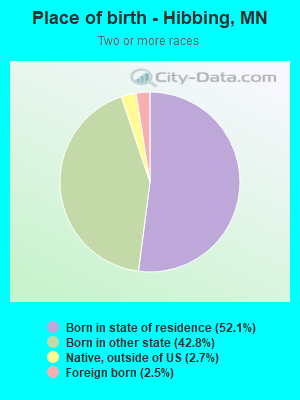
Place of birth - Born in state of residence (%) - Multirace
Place of birth - Born in state of residence (%) - Other Race
Place of birth - Born in other state (%)
Place of birth - Born in other state (%) - White
Place of birth - Born in other state (%) - Black or African American
Place of birth - Born in other state (%) - Asian
Place of birth - Born in other state (%) - Hispanic or Latino
Place of birth - Born in other state (%) - American Indian and Alaska Native
Place of birth - Born in other state (%) - Multirace
Place of birth - Born in other state (%) - Other Race
Place of birth - Native, outside of US (%)
Place of birth - Native, outside of US (%) - White
Place of birth - Native, outside of US (%) - Black or African American
Place of birth - Native, outside of US (%) - Asian
Place of birth - Native, outside of US (%) - Hispanic or Latino
Place of birth - Native, outside of US (%) - American Indian and Alaska Native
Place of birth - Native, outside of US (%) - Multirace
Place of birth - Native, outside of US (%) - Other Race
Place of birth - Foreign born (%)
Place of birth - Foreign born (%) - White
Place of birth - Foreign born (%) - Black or African American
Place of birth - Foreign born (%) - Asian
Place of birth - Foreign born (%) - Hispanic or Latino
Place of birth - Foreign born (%) - American Indian and Alaska Native
Place of birth - Foreign born (%) - Multirace
Place of birth - Foreign born (%) - Other Race
Residents speaking English at home (%)
Residents speaking English at home - Born in the United States (%)
Residents speaking English at home - Native, born elsewhere (%)
Residents speaking English at home - Foreign born (%)
Residents speaking Spanish at home (%)
Residents speaking Spanish at home - Born in the United States (%)
Residents speaking Spanish at home - Native, born elsewhere (%)
Residents speaking Spanish at home - Foreign born (%)
Residents speaking other language at home (%)
Residents speaking other language at home - Born in the United States (%)
Residents speaking other language at home - Native, born elsewhere (%)
Residents speaking other language at home - Foreign born (%)
Marital status - Never married (%)
Marital status - Now married (%)
Marital status - Separated (%)
Marital status - Widowed (%)
Marital status - Divorced (%)
Ancestries Reported - Arab (%)
Ancestries Reported - Czech (%)
Ancestries Reported - Danish (%)
Ancestries Reported - Dutch (%)
Ancestries Reported - English (%)
Ancestries Reported - French (%)
Ancestries Reported - French Canadian (%)
Ancestries Reported - German (%)
Ancestries Reported - Greek (%)
Ancestries Reported - Hungarian (%)
Ancestries Reported - Irish (%)
Ancestries Reported - Italian (%)
Ancestries Reported - Lithuanian (%)
Ancestries Reported - Norwegian (%)
Ancestries Reported - Polish (%)
Ancestries Reported - Portuguese (%)
Ancestries Reported - Russian (%)
Ancestries Reported - Scotch-Irish (%)
Ancestries Reported - Scottish (%)
Ancestries Reported - Slovak (%)
Ancestries Reported - Subsaharan African (%)
Ancestries Reported - Swedish (%)
Ancestries Reported - Swiss (%)
Ancestries Reported - Ukrainian (%)
Ancestries Reported - United States (%)
Ancestries Reported - Welsh (%)
Ancestries Reported - West Indian (%)
Ancestries Reported - Other (%)
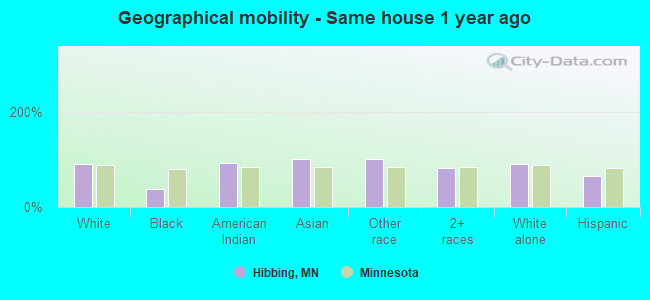
Geographical mobility - Same house 1 year ago (%)
Geographical mobility - Same house 1 year ago (%) - White
Geographical mobility - Same house 1 year ago (%) - Black or African American
Geographical mobility - Same house 1 year ago (%) - Asian
Geographical mobility - Same house 1 year ago (%) - Hispanic or Latino
Geographical mobility - Same house 1 year ago (%) - American Indian and Alaska Native
Geographical mobility - Same house 1 year ago (%) - Multirace
Geographical mobility - Same house 1 year ago (%) - Other Race
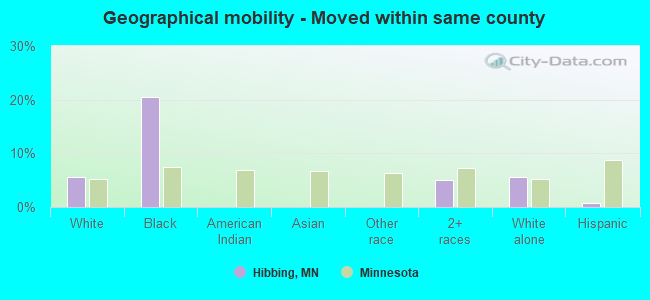
Geographical mobility - Moved within same county (%)
Geographical mobility - Moved within same county (%) - White
Geographical mobility - Moved within same county (%) - Black or African American
Geographical mobility - Moved within same county (%) - Asian
Geographical mobility - Moved within same county (%) - Hispanic or Latino
Geographical mobility - Moved within same county (%) - American Indian and Alaska Native
Geographical mobility - Moved within same county (%) - Multirace
Geographical mobility - Moved within same county (%) - Other Race
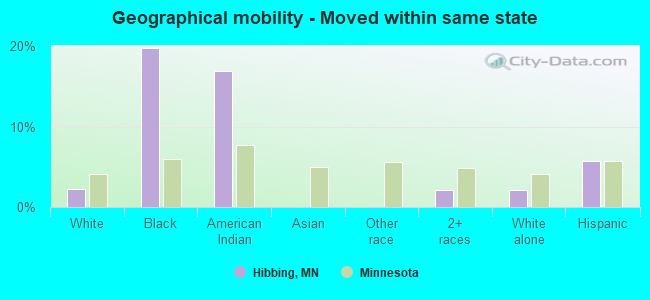
Geographical mobility - Moved from different county within same state (%)
Geographical mobility - Moved from different county within same state (%) - White
Geographical mobility - Moved from different county within same state (%) - Black or African American
Geographical mobility - Moved from different county within same state (%) - Asian
Geographical mobility - Moved from different county within same state (%) - Hispanic or Latino
Geographical mobility - Moved from different county within same state (%) - American Indian and Alaska Native
Geographical mobility - Moved from different county within same state (%) - Multirace
Geographical mobility - Moved from different county within same state (%) - Other Race
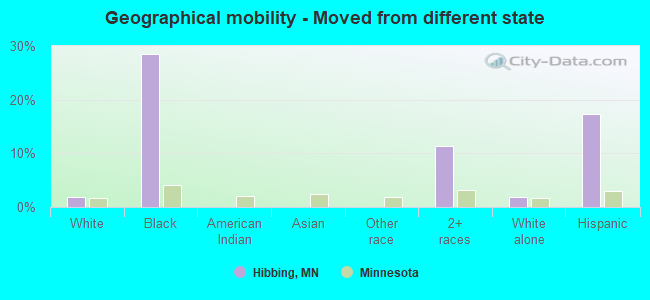
Geographical mobility - Moved from different state (%)
Geographical mobility - Moved from different state (%) - White
Geographical mobility - Moved from different state (%) - Black or African American
Geographical mobility - Moved from different state (%) - Asian
Geographical mobility - Moved from different state (%) - Hispanic or Latino
Geographical mobility - Moved from different state (%) - American Indian and Alaska Native
Geographical mobility - Moved from different state (%) - Multirace
Geographical mobility - Moved from different state (%) - Other Race
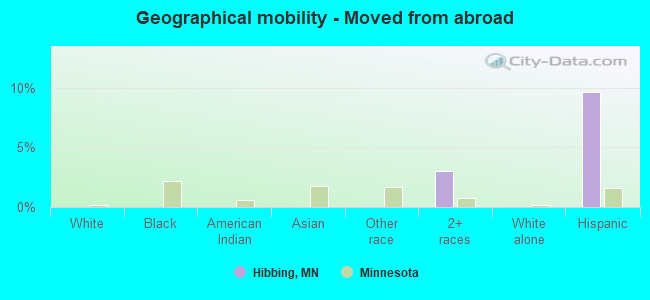
Geographical mobility - Moved from abroad (%)
Geographical mobility - Moved from abroad (%) - White
Geographical mobility - Moved from abroad (%) - Black or African American
Geographical mobility - Moved from abroad (%) - Asian
Geographical mobility - Moved from abroad (%) - Hispanic or Latino
Geographical mobility - Moved from abroad (%) - American Indian and Alaska Native
Geographical mobility - Moved from abroad (%) - Multirace
Geographical mobility - Moved from abroad (%) - Other Race
Place of birth for the foreign-born population - Ireland (%)
Place of birth for the foreign-born population - Denmark (%)
Place of birth for the foreign-born population - Norway (%)
Place of birth for the foreign-born population - Sweden (%)
Place of birth for the foreign-born population - United Kingdom (%)
Place of birth for the foreign-born population - England (%)
Place of birth for the foreign-born population - Scotland (%)
Place of birth for the foreign-born population - Other Northern Europe (%)
Place of birth for the foreign-born population - Austria (%)
Place of birth for the foreign-born population - Belgium (%)
Place of birth for the foreign-born population - France (%)
Place of birth for the foreign-born population - Germany (%)
Place of birth for the foreign-born population - Netherlands (%)
Place of birth for the foreign-born population - Switzerland (%)
Place of birth for the foreign-born population - Other Western Europe (%)
Place of birth for the foreign-born population - Greece (%)
Place of birth for the foreign-born population - Italy (%)
Place of birth for the foreign-born population - Portugal (%)
Place of birth for the foreign-born population - Spain (%)
Place of birth for the foreign-born population - Other Southern Europe (%)
Place of birth for the foreign-born population - Albania (%)
Place of birth for the foreign-born population - Belarus (%)
Place of birth for the foreign-born population - Bosnia and Herzegovina (%)
Place of birth for the foreign-born population - Bulgaria (%)
Place of birth for the foreign-born population - Croatia (%)
Place of birth for the foreign-born population - Czechoslovakia (%)
Place of birth for the foreign-born population - Hungary (%)
Place of birth for the foreign-born population - Latvia (%)
Place of birth for the foreign-born population - Lithuania (%)
Place of birth for the foreign-born population - North Macedonia (Macedonia) (%)
Place of birth for the foreign-born population - Moldova (%)
Place of birth for the foreign-born population - Poland (%)
Place of birth for the foreign-born population - Romania (%)
Place of birth for the foreign-born population - Russia (%)
Place of birth for the foreign-born population - Serbia (%)
Place of birth for the foreign-born population - Ukraine (%)
Place of birth for the foreign-born population - Other Eastern Europe (%)
Place of birth for the foreign-born population - China (%)
Place of birth for the foreign-born population - Hong Kong (%)
Place of birth for the foreign-born population - Taiwan (%)
Place of birth for the foreign-born population - Japan (%)
Place of birth for the foreign-born population - Korea (%)
Place of birth for the foreign-born population - Other Eastern Asia (%)
Place of birth for the foreign-born population - Afghanistan (%)
Place of birth for the foreign-born population - Bangladesh (%)
Place of birth for the foreign-born population - India (%)
Place of birth for the foreign-born population - Iran (%)
Place of birth for the foreign-born population - Kazakhstan (%)
Place of birth for the foreign-born population - Nepal (%)
Place of birth for the foreign-born population - Pakistan (%)
Place of birth for the foreign-born population - Sri Lanka (%)
Place of birth for the foreign-born population - Uzbekistan (%)
Place of birth for the foreign-born population - Other South Central Asia (%)
Place of birth for the foreign-born population - Burma (%)
Place of birth for the foreign-born population - Cambodia (%)
Place of birth for the foreign-born population - Indonesia (%)
Place of birth for the foreign-born population - Laos (%)
Place of birth for the foreign-born population - Malaysia (%)
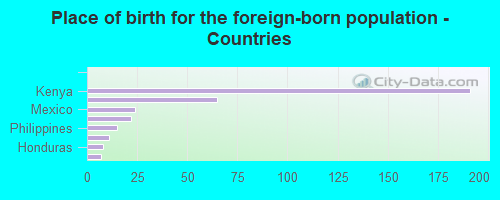
Place of birth for the foreign-born population - Philippines (%)
Place of birth for the foreign-born population - Singapore (%)
Place of birth for the foreign-born population - Thailand (%)
Place of birth for the foreign-born population - Vietnam (%)
Place of birth for the foreign-born population - Other South Eastern Asia (%)
Place of birth for the foreign-born population - Armenia (%)
Place of birth for the foreign-born population - Iraq (%)
Place of birth for the foreign-born population - Israel (%)
Place of birth for the foreign-born population - Jordan (%)
Place of birth for the foreign-born population - Kuwait (%)
Place of birth for the foreign-born population - Lebanon (%)
Place of birth for the foreign-born population - Saudi Arabia (%)
Place of birth for the foreign-born population - Syria (%)
Place of birth for the foreign-born population - Turkey (%)
Place of birth for the foreign-born population - Yemen (%)
Place of birth for the foreign-born population - Other Western Asia (%)
Place of birth for the foreign-born population - Eritrea (%)
Place of birth for the foreign-born population - Ethiopia (%)
Place of birth for the foreign-born population - Kenya (%)
Place of birth for the foreign-born population - Somalia (%)
Place of birth for the foreign-born population - Uganda (%)
Place of birth for the foreign-born population - Zimbabwe (%)
Place of birth for the foreign-born population - Other Eastern Africa (%)
Place of birth for the foreign-born population - Cameroon (%)
Place of birth for the foreign-born population - Congo (%)
Place of birth for the foreign-born population - Democratic Republic of Congo (Zaire) (%)
Place of birth for the foreign-born population - Other Middle Africa (%)
Place of birth for the foreign-born population - Egypt (%)
Place of birth for the foreign-born population - Morocco (%)
Place of birth for the foreign-born population - Sudan (%)
Place of birth for the foreign-born population - Other Northern Africa (%)
Place of birth for the foreign-born population - South Africa (%)
Place of birth for the foreign-born population - Other Southern Africa (%)
Place of birth for the foreign-born population - Cabo Verde (%)
Place of birth for the foreign-born population - Ghana (%)
Place of birth for the foreign-born population - Liberia (%)
Place of birth for the foreign-born population - Nigeria (%)
Place of birth for the foreign-born population - Senegal (%)
Place of birth for the foreign-born population - Sierra Leone (%)
Place of birth for the foreign-born population - Other Western Africa (%)
Place of birth for the foreign-born population - Australia (%)
Place of birth for the foreign-born population - New Zealand (%)
Place of birth for the foreign-born population - Fiji (%)
Place of birth for the foreign-born population - Micronesia (%)
Place of birth for the foreign-born population - Bahamas (%)
Place of birth for the foreign-born population - Barbados (%)
Place of birth for the foreign-born population - Cuba (%)
Place of birth for the foreign-born population - Dominica (%)
Place of birth for the foreign-born population - Dominican Republic (%)
Place of birth for the foreign-born population - Grenada (%)
Place of birth for the foreign-born population - Haiti (%)
Place of birth for the foreign-born population - Jamaica (%)
Place of birth for the foreign-born population - St. Vincent and the Grenadines (%)
Place of birth for the foreign-born population - Trinidad and Tobago (%)
Place of birth for the foreign-born population - West Indies (%)
Place of birth for the foreign-born population - Other Caribbean (%)
Place of birth for the foreign-born population - Belize (%)
Place of birth for the foreign-born population - Costa Rica (%)
Place of birth for the foreign-born population - El Salvador (%)
Place of birth for the foreign-born population - Guatemala (%)
Place of birth for the foreign-born population - Honduras (%)
Place of birth for the foreign-born population - Mexico (%)
Place of birth for the foreign-born population - Nicaragua (%)
Place of birth for the foreign-born population - Panama (%)
Place of birth for the foreign-born population - Other Central America (%)
Place of birth for the foreign-born population - Argentina (%)
Place of birth for the foreign-born population - Bolivia (%)
Place of birth for the foreign-born population - Brazil (%)
Place of birth for the foreign-born population - Chile (%)
Place of birth for the foreign-born population - Colombia (%)
Place of birth for the foreign-born population - Ecuador (%)
Place of birth for the foreign-born population - Guyana (%)
Place of birth for the foreign-born population - Peru (%)
Place of birth for the foreign-born population - Uruguay (%)
Place of birth for the foreign-born population - Venezuela (%)
Place of birth for the foreign-born population - Other South America (%)
Place of birth for the foreign-born population - Canada (%)
Place of birth for the foreign-born population - Other Northern America (%)
Place of birth for the foreign-born population - Other (%)
Latest news about races in Hibbing, MN collected exclusively by city-data.com from local newspapers, TV, and radio stations
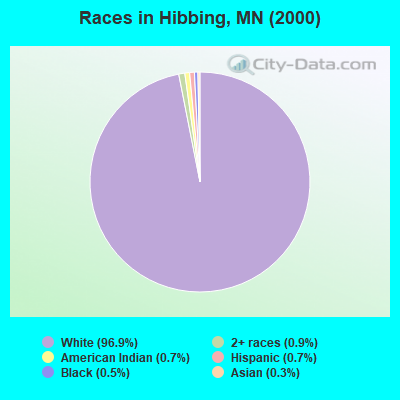
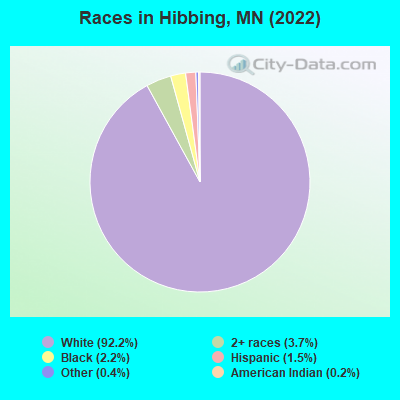
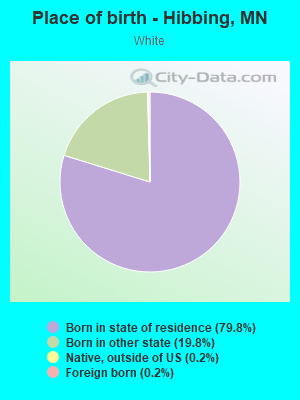
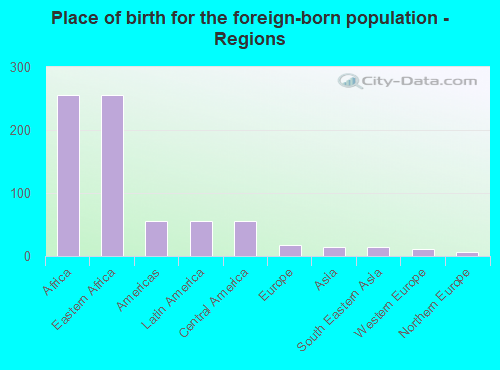
According to 2022 data, the most numerous races in Hibbing, MN are White alone (14,858 residents), Black alone (352 residents), and Hispanic (246 residents). 97.6% of Hibbing residents speak English at home. 2.1% of Hibbing, MN residents are foreign-born (1.5% born in Africa, 0.3% born in Latin America), which is 272.7% less than the foreign-born rate of 8.0% across the entire state of Minnesota.
Race distribution in Hibbing
2000 2022
4,337,143 88.2% White alone 168,813 3.4% Black alone 143,382 2.9% Hispanic 141,083 2.9% Asian alone 70,304 1.4% Two or more races 52,009 1.1% American Indian alone 5,031 0.1% Other race alone 1,714 0.03% Native Hawaiian and Other
4,356,347 76.2% White alone 395,179 6.9% Black alone 333,830 5.8% Hispanic 294,800 5.2% Asian alone 259,649 4.5% Two or more races 42,125 0.7% American Indian alone 32,976 0.6% Other race alone 2,278 0.04% Native Hawaiian and Other
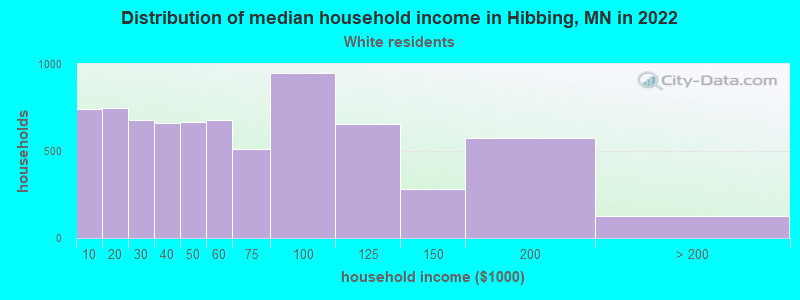
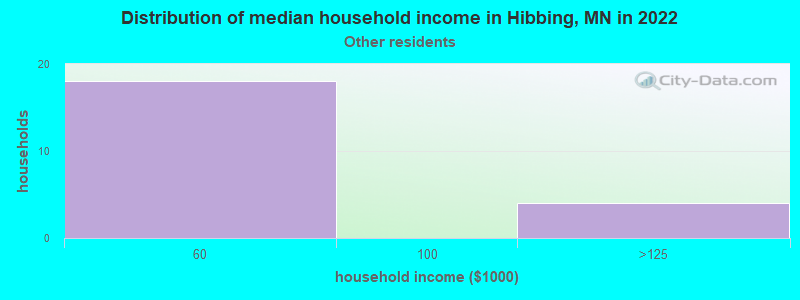
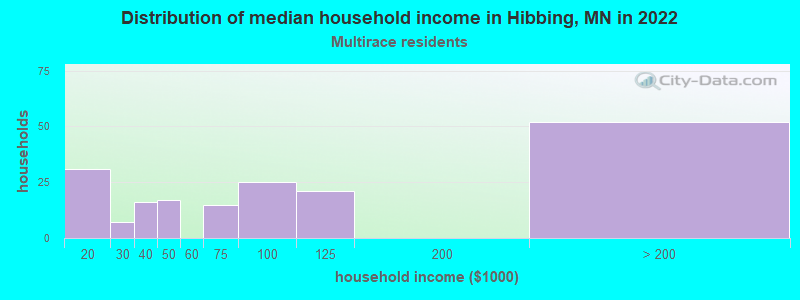
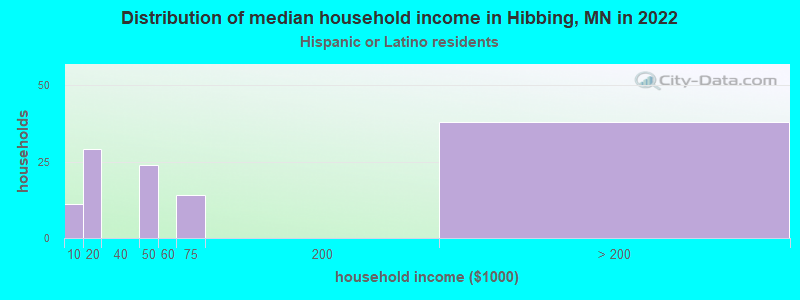
Income and house value in Hibbing Median household income in 2022 $50,449 White non-Hispanic householders$74,343 Two or more races householdersMedian 2022 house value $136,114 White Non-Hispanic householders$411,441 Black or African American householders$179,715 American Indian or Alaska Native householders$64,184 Some other race householders$32,534 Two or more races householders$239,694 Hispanic or Latino householders
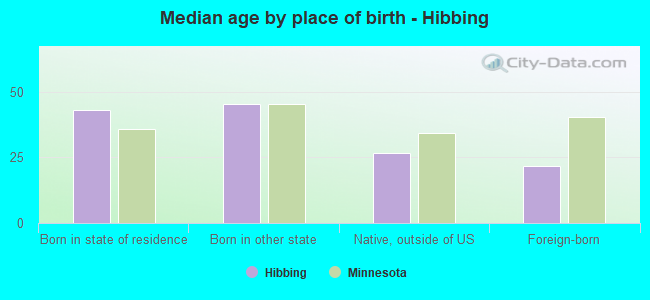
Median age by race in Hibbing
46.0 Median age for White residents41.9 50.5 14.7 Median age for Black or African American residents11.9 20.7 23.0 Median age for American Indian / Alaska Native residents39.3 -533,783,783.2 -914,089,346.2 Median age for Asian residents-821,029,082.0 -992,805,754.4 -744,336,568.8 Median age for Native Hawaiian / Pacific Islander residents-856,799,036.4 -534,959,349.1 34.6 Median age for Other race residents27.1 14.4 20.4 Median age for Two or more races residents18.3 30.8 45.9 Median age for White alone residents42.0 50.2 26.4 Median age for Hispanic or Latino residents26.0 48.8
Owner/renter occupied households by race in Hibbing
House owners and renters - White residents 5,290 73.5% Owner occupied1,911 26.5% Renter occupiedHouse owners and renters - Black or African American residents 62 100.0% Renter occupiedHouse owners and renters - American Indian / Alaska Native residents 18 100.0% Renter occupiedHouse owners and renters - Other race residents 21 100.0% Owner occupiedHouse owners and renters - Two or more races residents 121 56.7% Owner occupied93 43.3% Renter occupiedHouse owners and renters - White alone residents 5,285 73.8% Owner occupied1,876 26.2% Renter occupiedHouse owners and renters - Hispanic or Latino residents 62 46.8% Owner occupied71 53.2% Renter occupied
Language usage in Hibbing
English speakers - Total 97.6% of residents of Hibbing speak English at home.
0.9% of residents speak Spanish at home 52 37.1% Speak English very well88 62.9% Speak English less than very well1.5% of residents speak other language at home 200 88.5% Speak English very well26 11.5% Speak English less than very well
English speakers - Born in the United States 99.4% of residents of Hibbing speak English at home.
1.3% of residents speak Spanish at home 27 67.5% Speak English very well13 32.5% Speak English less than very well0.1% of residents speak other language at home 3 100.0% Speak English very well
English speakers - Native, born elsewhere 54.1% of residents of Hibbing speak English at home.
86.9% of residents speak Spanish at home 6 11.3% Speak English very well47 88.7% Speak English less than very well
English speakers - Foreign-born 28.8% of residents of Hibbing speak English at home.
9.2% of residents speak Spanish at home 25 100.0% Speak English less than very well57.2% of residents speak other language at home 130 83.9% Speak English very well25 16.1% Speak English less than very well
White (Caucasian) - Speak only English Native:
99.3% (14,103)Foreign-born:
94.1% (31)
White (Caucasian) - Speak another language Native:
0.8% (113)Foreign-born:
37.9% (13)
Black or African American - Speak only English Native:
97.2% (69)Foreign-born:
12.3% (33)
Two or more races - Speak another language Native:
14.8% (105)Foreign-born:
100.0% (35)
White alone - Speak only English Native:
99.2% (14,089)Foreign-born:
56.8% (7)
White alone - Speak another language Native:
0.8% (118)Foreign-born:
82.6% (10)
Hispanic or Latino - Speak only English Native:
63.1% (108)Foreign-born:
96.2% (37)
Hispanic or Latino - Speak another language Native:
28.7% (49)Foreign-born:
40.5% (15)
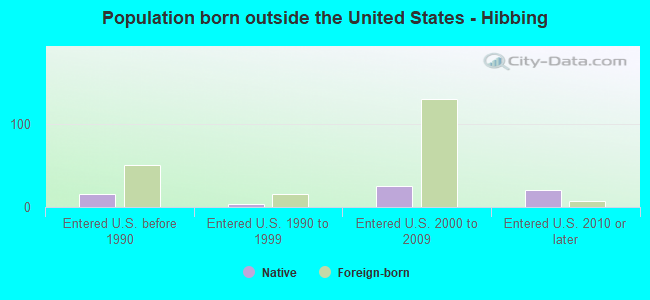
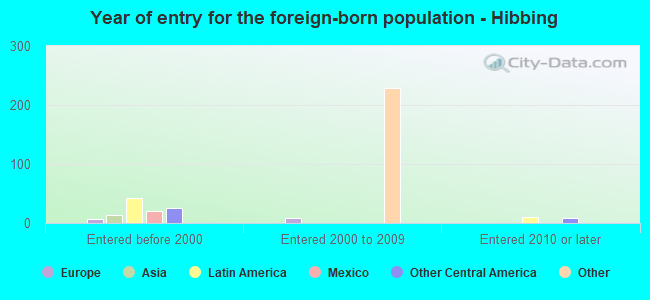
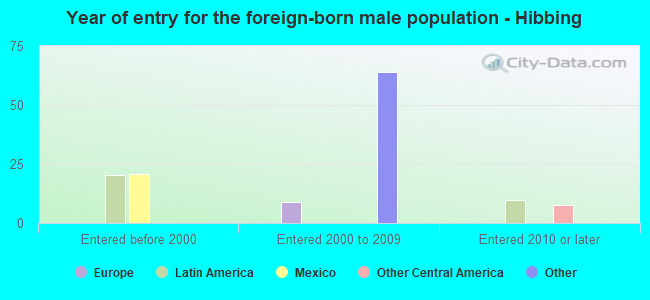
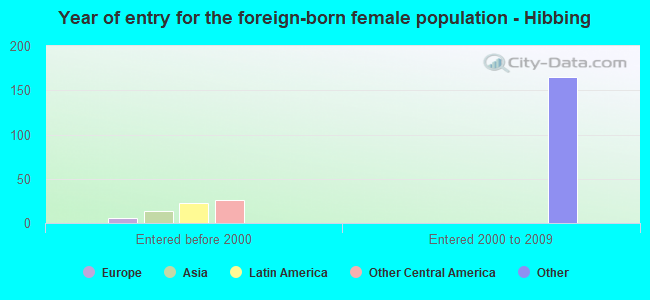
Foreign-born residents in Hibbing 346 residents are foreign born (1.5% Africa , 0.3% Latin America ).
This city:
2.1%Minnesota:
8.5%
Marital status for residents in Hibbing Marital status - White (Caucasian) population 15 years and over
Males 35.3% Never married45.4% Now married1.4% Separated4.3% Widowed13.6% DivorcedFemales 26.8% Never married43.8% Now married2.5% Separated13.2% Widowed13.6% DivorcedWomen who gave birth in the past 12 months Now married:
38.5% (70)Unmarried:
61.5% (112)
Women who did not give birth in the past 12 months Now married:
42.4% (1,083)Unmarried:
57.6% (1,470)
Marital status - Black or African American population 15 years and over
Males 87.6% Never married0.0% Now married0.0% Separated0.0% Widowed12.4% DivorcedFemales 81.2% Never married0.0% Now married0.0% Separated0.0% Widowed18.8% DivorcedWomen who did not give birth in the past 12 months Now married:
0.0% (0)Unmarried:
100.0% (166)
Marital status - American Indian / Alaska Native population 15 years and over
Males 16.7% Never married66.7% Now married16.7% Separated0.0% Widowed0.0% DivorcedFemales 100.0% Never married0.0% Now married0.0% Separated0.0% Widowed0.0% DivorcedWomen who did not give birth in the past 12 months Now married:
0.0% (0)Unmarried:
100.0% (22)
Marital status - Other race population 15 years and over
Males 81.3% Never married18.8% Now married0.0% Separated0.0% Widowed0.0% DivorcedFemales 0.0% Never married100.0% Now married0.0% Separated0.0% Widowed0.0% DivorcedWomen who gave birth in the past 12 months Now married:
100.0% (4)Unmarried:
0.0% (0)
Marital status - Two or more races population 15 years and over
Males 80.7% Never married8.5% Now married0.0% Separated0.0% Widowed10.8% DivorcedFemales 53.0% Never married22.6% Now married0.0% Separated0.0% Widowed24.4% DivorcedWomen who gave birth in the past 12 months Now married:
0.0% (0)Unmarried:
100.0% (5)
Women who did not give birth in the past 12 months Now married:
25.2% (31)Unmarried:
74.8% (93)
Marital status - White alone, not Hispanic / Latino population 15 years and over
Males 35.1% Never married45.5% Now married1.4% Separated4.3% Widowed13.6% DivorcedFemales 26.9% Never married44.0% Now married2.5% Separated12.9% Widowed13.7% DivorcedWomen who gave birth in the past 12 months Now married:
38.5% (70)Unmarried:
61.5% (112)
Women who did not give birth in the past 12 months Now married:
42.4% (1,087)Unmarried:
57.6% (1,473)
Marital status - Hispanic or Latino population 15 years and over
Males 40.5% Never married27.0% Now married0.0% Separated0.0% Widowed32.4% DivorcedFemales 16.3% Never married26.0% Now married0.0% Separated21.2% Widowed36.5% DivorcedWomen who gave birth in the past 12 months Now married:
0.0% (0)Unmarried:
100.0% (2)
Women who did not give birth in the past 12 months Now married:
56.2% (17)Unmarried:
43.8% (13)
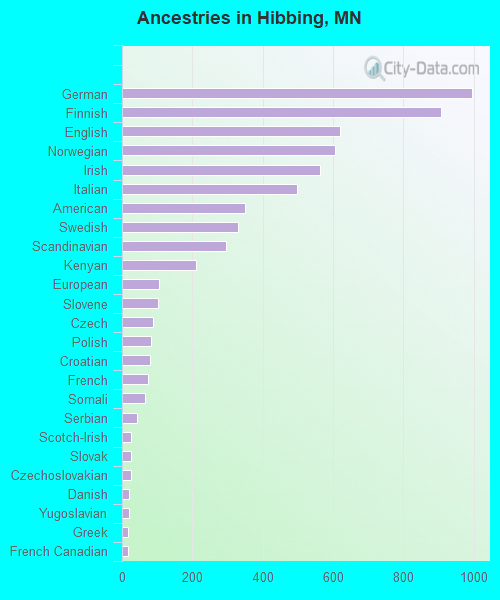
Ancestries in Hibbing
994 14.9% German907 13.6% Finnish619 9.3% English607 9.1% Norwegian562 8.4% Irish499 7.5% Italian350 5.2% American331 4.9% Swedish297 4.4% Scandinavian211 3.2% Kenyan106 1.6% European103 1.5% Slovene88 1.3% Czech83 1.2% Polish81 1.2% Croatian73 1.1% French64 1.0% Somali44 0.7% Serbian27 0.4% Scotch-Irish26 0.4% Slovak25 0.4% Czechoslovakian21 0.3% Danish20 0.3% Yugoslavian18 0.3% Greek16 0.2% French Canadian16 0.2% Scottish8 0.1% Eastern European5 0.07% Pennsylvania German
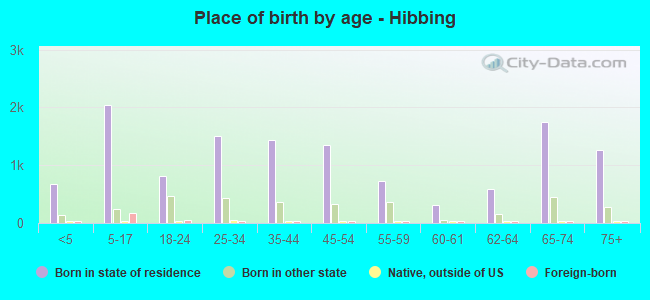
Children Nativity (place of birth) in Hibbing
Children under 6 years - Living with two parents Both parents native 470 100.0% NativeChildren under 6 years - Living with one parent Native parent 395 100.0% NativeChildren 6 to 17 years - Living with two parents Both parents native 1,377 100.0% NativeOne native, one foreign-born parent 5 100.0% NativeChildren 6 to 17 years - Living with one parent Native parent 583 78.9% Native156 21.1% Foreign-bornForeign-born parent 162 95.1% Native8 4.9% Foreign-born
Grandparents responsible for own grandchildren in Hibbing
Grandparents (30 to 59 years) White / Caucasian 26 21.1% Responsible for grandchildren97 78.9% Not responsible for grandchildrenWhite alone, not Hispanic / Latino 26 21.1% Responsible for grandchildren99 78.9% Not responsible for grandchildrenGrandparents (60 years and over) White / Caucasian 78 64.5% Responsible for grandchildren43 35.5% Not responsible for grandchildrenWhite alone, not Hispanic / Latino 81 64.7% Responsible for grandchildren44 35.3% Not responsible for grandchildren