Races in Hewlett, New York (NY) Detailed Stats
Data:
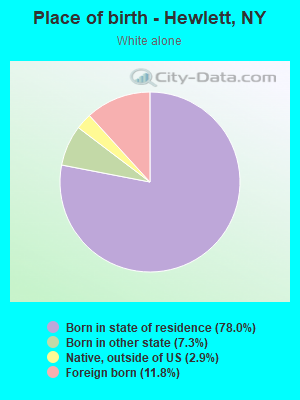
Races - White alone (%)
Races - White alone (% change since 2000)
Races - Black alone (%)
Races - Black alone (% change since 2000)
Races - American Indian alone (%)
Races - American Indian alone (% change since 2000)
Races - Asian alone (%)
Races - Asian alone (% change since 2000)
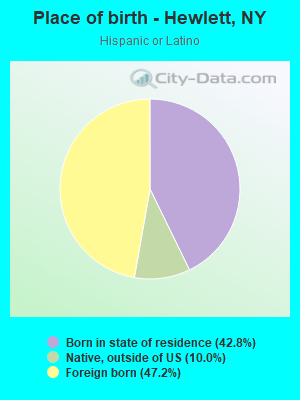
Races - Hispanic (%)
Races - Hispanic (% change since 2000)
Races - Native Hawaiian and Other Pacific Islander alone (%)
Races - Native Hawaiian and Other Pacific Islander alone (% change since 2000)
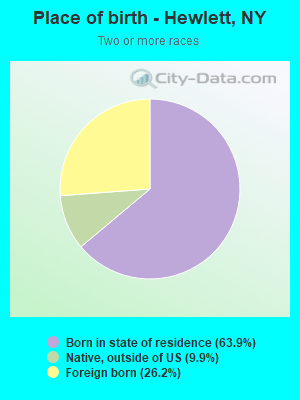
Races - Two or more races(%)
Races - Two or more races(% change since 2000)
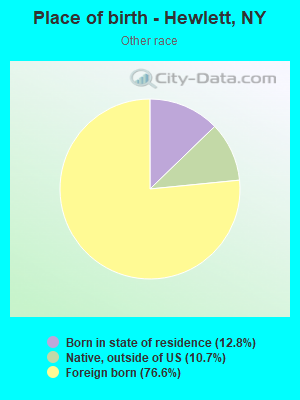
Races - Other race alone (%)
Races - Other race alone (% change since 2000)
Racial diversity
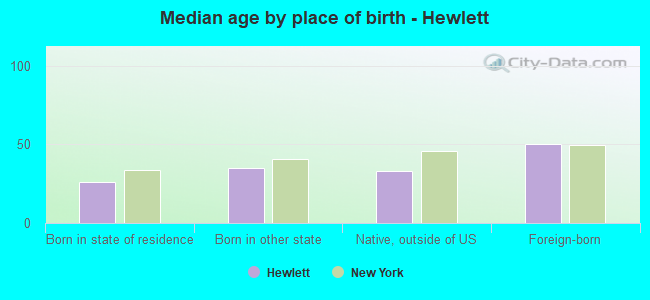
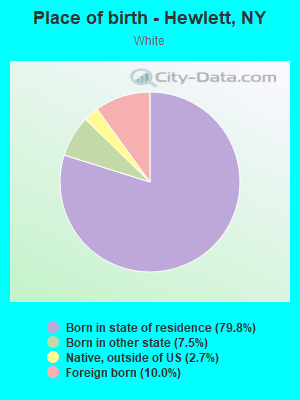
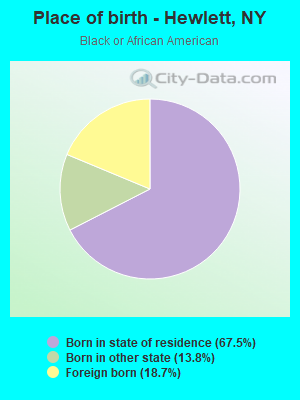
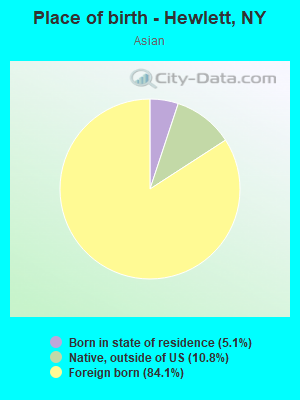
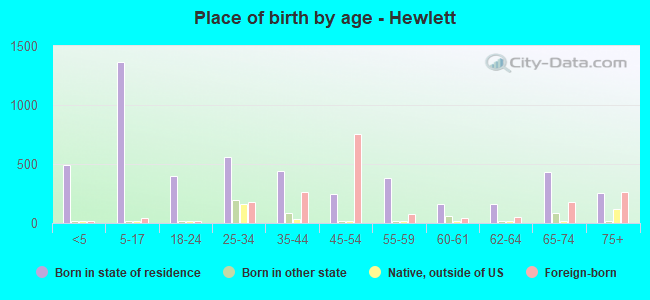
Place of birth - Born in state of residence (%)
Place of birth - Born in state of residence (%) - White
Place of birth - Born in state of residence (%) - Black or African American
Place of birth - Born in state of residence (%) - Asian
Place of birth - Born in state of residence (%) - Hispanic or Latino
Place of birth - Born in state of residence (%) - American Indian and Alaska Native
Place of birth - Born in state of residence (%) - Multirace
Place of birth - Born in state of residence (%) - Other Race
Place of birth - Born in other state (%)
Place of birth - Born in other state (%) - White
Place of birth - Born in other state (%) - Black or African American
Place of birth - Born in other state (%) - Asian
Place of birth - Born in other state (%) - Hispanic or Latino
Place of birth - Born in other state (%) - American Indian and Alaska Native
Place of birth - Born in other state (%) - Multirace
Place of birth - Born in other state (%) - Other Race
Place of birth - Native, outside of US (%)
Place of birth - Native, outside of US (%) - White
Place of birth - Native, outside of US (%) - Black or African American
Place of birth - Native, outside of US (%) - Asian
Place of birth - Native, outside of US (%) - Hispanic or Latino
Place of birth - Native, outside of US (%) - American Indian and Alaska Native
Place of birth - Native, outside of US (%) - Multirace
Place of birth - Native, outside of US (%) - Other Race
Place of birth - Foreign born (%)
Place of birth - Foreign born (%) - White
Place of birth - Foreign born (%) - Black or African American
Place of birth - Foreign born (%) - Asian
Place of birth - Foreign born (%) - Hispanic or Latino
Place of birth - Foreign born (%) - American Indian and Alaska Native
Place of birth - Foreign born (%) - Multirace
Place of birth - Foreign born (%) - Other Race
Residents speaking English at home (%)
Residents speaking English at home - Born in the United States (%)
Residents speaking English at home - Native, born elsewhere (%)
Residents speaking English at home - Foreign born (%)
Residents speaking Spanish at home (%)
Residents speaking Spanish at home - Born in the United States (%)
Residents speaking Spanish at home - Native, born elsewhere (%)
Residents speaking Spanish at home - Foreign born (%)
Residents speaking other language at home (%)
Residents speaking other language at home - Born in the United States (%)
Residents speaking other language at home - Native, born elsewhere (%)
Residents speaking other language at home - Foreign born (%)
Marital status - Never married (%)
Marital status - Now married (%)
Marital status - Separated (%)
Marital status - Widowed (%)
Marital status - Divorced (%)
Ancestries Reported - Arab (%)
Ancestries Reported - Czech (%)
Ancestries Reported - Danish (%)
Ancestries Reported - Dutch (%)
Ancestries Reported - English (%)
Ancestries Reported - French (%)
Ancestries Reported - French Canadian (%)
Ancestries Reported - German (%)
Ancestries Reported - Greek (%)
Ancestries Reported - Hungarian (%)
Ancestries Reported - Irish (%)
Ancestries Reported - Italian (%)
Ancestries Reported - Lithuanian (%)
Ancestries Reported - Norwegian (%)
Ancestries Reported - Polish (%)
Ancestries Reported - Portuguese (%)
Ancestries Reported - Russian (%)
Ancestries Reported - Scotch-Irish (%)
Ancestries Reported - Scottish (%)
Ancestries Reported - Slovak (%)
Ancestries Reported - Subsaharan African (%)
Ancestries Reported - Swedish (%)
Ancestries Reported - Swiss (%)
Ancestries Reported - Ukrainian (%)
Ancestries Reported - United States (%)
Ancestries Reported - Welsh (%)
Ancestries Reported - West Indian (%)
Ancestries Reported - Other (%)
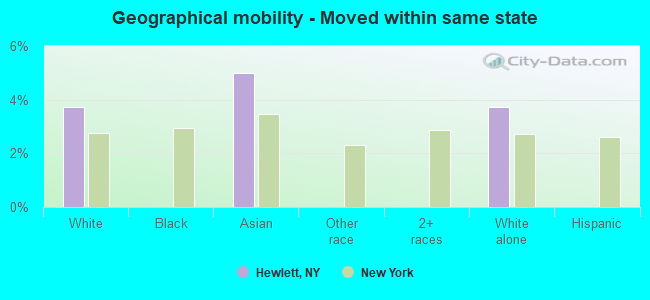
Geographical mobility - Same house 1 year ago (%)
Geographical mobility - Same house 1 year ago (%) - White
Geographical mobility - Same house 1 year ago (%) - Black or African American
Geographical mobility - Same house 1 year ago (%) - Asian
Geographical mobility - Same house 1 year ago (%) - Hispanic or Latino
Geographical mobility - Same house 1 year ago (%) - American Indian and Alaska Native
Geographical mobility - Same house 1 year ago (%) - Multirace
Geographical mobility - Same house 1 year ago (%) - Other Race
Geographical mobility - Moved within same county (%)
Geographical mobility - Moved within same county (%) - White
Geographical mobility - Moved within same county (%) - Black or African American
Geographical mobility - Moved within same county (%) - Asian
Geographical mobility - Moved within same county (%) - Hispanic or Latino
Geographical mobility - Moved within same county (%) - American Indian and Alaska Native
Geographical mobility - Moved within same county (%) - Multirace
Geographical mobility - Moved within same county (%) - Other Race
Geographical mobility - Moved from different county within same state (%)
Geographical mobility - Moved from different county within same state (%) - White
Geographical mobility - Moved from different county within same state (%) - Black or African American
Geographical mobility - Moved from different county within same state (%) - Asian
Geographical mobility - Moved from different county within same state (%) - Hispanic or Latino
Geographical mobility - Moved from different county within same state (%) - American Indian and Alaska Native
Geographical mobility - Moved from different county within same state (%) - Multirace
Geographical mobility - Moved from different county within same state (%) - Other Race
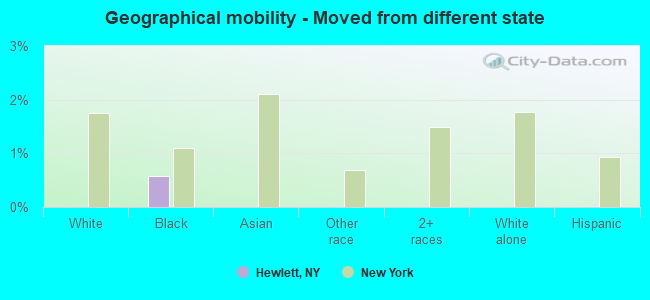
Geographical mobility - Moved from different state (%)
Geographical mobility - Moved from different state (%) - White
Geographical mobility - Moved from different state (%) - Black or African American
Geographical mobility - Moved from different state (%) - Asian
Geographical mobility - Moved from different state (%) - Hispanic or Latino
Geographical mobility - Moved from different state (%) - American Indian and Alaska Native
Geographical mobility - Moved from different state (%) - Multirace
Geographical mobility - Moved from different state (%) - Other Race
Geographical mobility - Moved from abroad (%)
Geographical mobility - Moved from abroad (%) - White
Geographical mobility - Moved from abroad (%) - Black or African American
Geographical mobility - Moved from abroad (%) - Asian
Geographical mobility - Moved from abroad (%) - Hispanic or Latino
Geographical mobility - Moved from abroad (%) - American Indian and Alaska Native
Geographical mobility - Moved from abroad (%) - Multirace
Geographical mobility - Moved from abroad (%) - Other Race
Place of birth for the foreign-born population - Ireland (%)
Place of birth for the foreign-born population - Denmark (%)
Place of birth for the foreign-born population - Norway (%)
Place of birth for the foreign-born population - Sweden (%)
Place of birth for the foreign-born population - United Kingdom (%)
Place of birth for the foreign-born population - England (%)
Place of birth for the foreign-born population - Scotland (%)
Place of birth for the foreign-born population - Other Northern Europe (%)
Place of birth for the foreign-born population - Austria (%)
Place of birth for the foreign-born population - Belgium (%)
Place of birth for the foreign-born population - France (%)
Place of birth for the foreign-born population - Germany (%)
Place of birth for the foreign-born population - Netherlands (%)
Place of birth for the foreign-born population - Switzerland (%)
Place of birth for the foreign-born population - Other Western Europe (%)
Place of birth for the foreign-born population - Greece (%)
Place of birth for the foreign-born population - Italy (%)
Place of birth for the foreign-born population - Portugal (%)
Place of birth for the foreign-born population - Spain (%)
Place of birth for the foreign-born population - Other Southern Europe (%)
Place of birth for the foreign-born population - Albania (%)
Place of birth for the foreign-born population - Belarus (%)
Place of birth for the foreign-born population - Bosnia and Herzegovina (%)
Place of birth for the foreign-born population - Bulgaria (%)
Place of birth for the foreign-born population - Croatia (%)
Place of birth for the foreign-born population - Czechoslovakia (%)
Place of birth for the foreign-born population - Hungary (%)
Place of birth for the foreign-born population - Latvia (%)
Place of birth for the foreign-born population - Lithuania (%)
Place of birth for the foreign-born population - North Macedonia (Macedonia) (%)
Place of birth for the foreign-born population - Moldova (%)
Place of birth for the foreign-born population - Poland (%)
Place of birth for the foreign-born population - Romania (%)
Place of birth for the foreign-born population - Russia (%)
Place of birth for the foreign-born population - Serbia (%)
Place of birth for the foreign-born population - Ukraine (%)
Place of birth for the foreign-born population - Other Eastern Europe (%)
Place of birth for the foreign-born population - China (%)
Place of birth for the foreign-born population - Hong Kong (%)
Place of birth for the foreign-born population - Taiwan (%)
Place of birth for the foreign-born population - Japan (%)
Place of birth for the foreign-born population - Korea (%)
Place of birth for the foreign-born population - Other Eastern Asia (%)
Place of birth for the foreign-born population - Afghanistan (%)
Place of birth for the foreign-born population - Bangladesh (%)
Place of birth for the foreign-born population - India (%)
Place of birth for the foreign-born population - Iran (%)
Place of birth for the foreign-born population - Kazakhstan (%)
Place of birth for the foreign-born population - Nepal (%)
Place of birth for the foreign-born population - Pakistan (%)
Place of birth for the foreign-born population - Sri Lanka (%)
Place of birth for the foreign-born population - Uzbekistan (%)
Place of birth for the foreign-born population - Other South Central Asia (%)
Place of birth for the foreign-born population - Burma (%)
Place of birth for the foreign-born population - Cambodia (%)
Place of birth for the foreign-born population - Indonesia (%)
Place of birth for the foreign-born population - Laos (%)
Place of birth for the foreign-born population - Malaysia (%)
Place of birth for the foreign-born population - Philippines (%)
Place of birth for the foreign-born population - Singapore (%)
Place of birth for the foreign-born population - Thailand (%)
Place of birth for the foreign-born population - Vietnam (%)
Place of birth for the foreign-born population - Other South Eastern Asia (%)
Place of birth for the foreign-born population - Armenia (%)
Place of birth for the foreign-born population - Iraq (%)
Place of birth for the foreign-born population - Israel (%)
Place of birth for the foreign-born population - Jordan (%)
Place of birth for the foreign-born population - Kuwait (%)
Place of birth for the foreign-born population - Lebanon (%)
Place of birth for the foreign-born population - Saudi Arabia (%)
Place of birth for the foreign-born population - Syria (%)
Place of birth for the foreign-born population - Turkey (%)
Place of birth for the foreign-born population - Yemen (%)
Place of birth for the foreign-born population - Other Western Asia (%)
Place of birth for the foreign-born population - Eritrea (%)
Place of birth for the foreign-born population - Ethiopia (%)
Place of birth for the foreign-born population - Kenya (%)
Place of birth for the foreign-born population - Somalia (%)
Place of birth for the foreign-born population - Uganda (%)
Place of birth for the foreign-born population - Zimbabwe (%)
Place of birth for the foreign-born population - Other Eastern Africa (%)
Place of birth for the foreign-born population - Cameroon (%)
Place of birth for the foreign-born population - Congo (%)
Place of birth for the foreign-born population - Democratic Republic of Congo (Zaire) (%)
Place of birth for the foreign-born population - Other Middle Africa (%)
Place of birth for the foreign-born population - Egypt (%)
Place of birth for the foreign-born population - Morocco (%)
Place of birth for the foreign-born population - Sudan (%)
Place of birth for the foreign-born population - Other Northern Africa (%)
Place of birth for the foreign-born population - South Africa (%)
Place of birth for the foreign-born population - Other Southern Africa (%)
Place of birth for the foreign-born population - Cabo Verde (%)
Place of birth for the foreign-born population - Ghana (%)
Place of birth for the foreign-born population - Liberia (%)
Place of birth for the foreign-born population - Nigeria (%)
Place of birth for the foreign-born population - Senegal (%)
Place of birth for the foreign-born population - Sierra Leone (%)
Place of birth for the foreign-born population - Other Western Africa (%)
Place of birth for the foreign-born population - Australia (%)
Place of birth for the foreign-born population - New Zealand (%)
Place of birth for the foreign-born population - Fiji (%)
Place of birth for the foreign-born population - Micronesia (%)
Place of birth for the foreign-born population - Bahamas (%)
Place of birth for the foreign-born population - Barbados (%)
Place of birth for the foreign-born population - Cuba (%)
Place of birth for the foreign-born population - Dominica (%)
Place of birth for the foreign-born population - Dominican Republic (%)
Place of birth for the foreign-born population - Grenada (%)
Place of birth for the foreign-born population - Haiti (%)
Place of birth for the foreign-born population - Jamaica (%)
Place of birth for the foreign-born population - St. Vincent and the Grenadines (%)
Place of birth for the foreign-born population - Trinidad and Tobago (%)
Place of birth for the foreign-born population - West Indies (%)
Place of birth for the foreign-born population - Other Caribbean (%)
Place of birth for the foreign-born population - Belize (%)
Place of birth for the foreign-born population - Costa Rica (%)
Place of birth for the foreign-born population - El Salvador (%)
Place of birth for the foreign-born population - Guatemala (%)
Place of birth for the foreign-born population - Honduras (%)
Place of birth for the foreign-born population - Mexico (%)
Place of birth for the foreign-born population - Nicaragua (%)
Place of birth for the foreign-born population - Panama (%)
Place of birth for the foreign-born population - Other Central America (%)
Place of birth for the foreign-born population - Argentina (%)
Place of birth for the foreign-born population - Bolivia (%)
Place of birth for the foreign-born population - Brazil (%)
Place of birth for the foreign-born population - Chile (%)
Place of birth for the foreign-born population - Colombia (%)
Place of birth for the foreign-born population - Ecuador (%)
Place of birth for the foreign-born population - Guyana (%)
Place of birth for the foreign-born population - Peru (%)
Place of birth for the foreign-born population - Uruguay (%)
Place of birth for the foreign-born population - Venezuela (%)
Place of birth for the foreign-born population - Other South America (%)
Place of birth for the foreign-born population - Canada (%)
Place of birth for the foreign-born population - Other Northern America (%)
Place of birth for the foreign-born population - Other (%)
Latest news about races in Hewlett, NY collected exclusively by city-data.com from local newspapers, TV, and radio stations
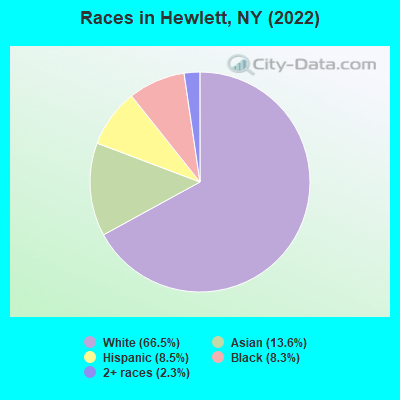
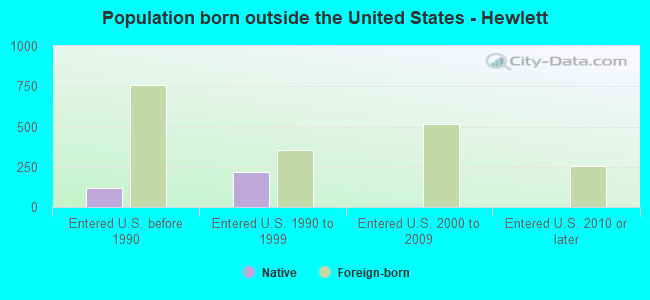
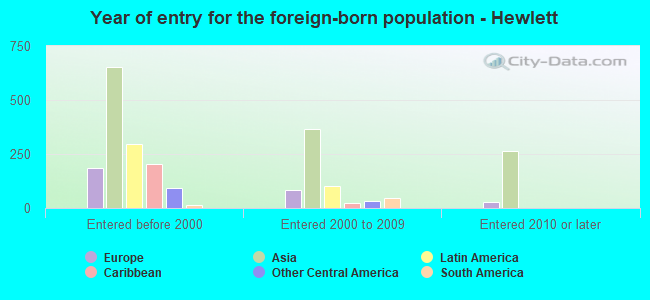
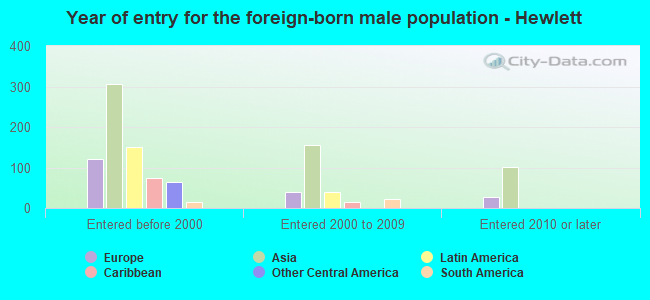
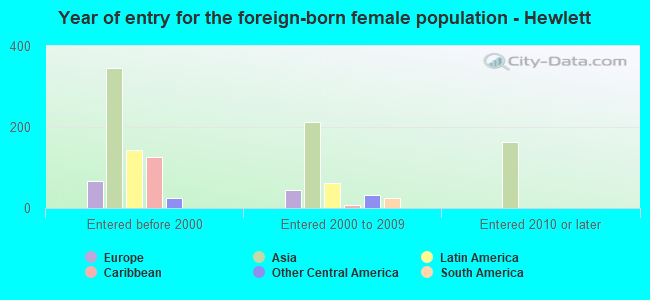
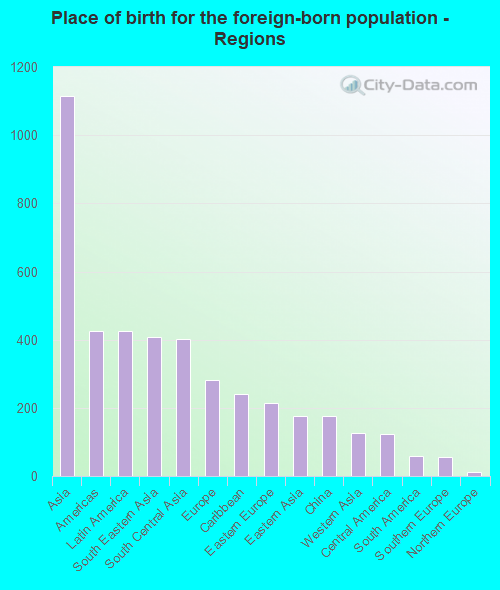
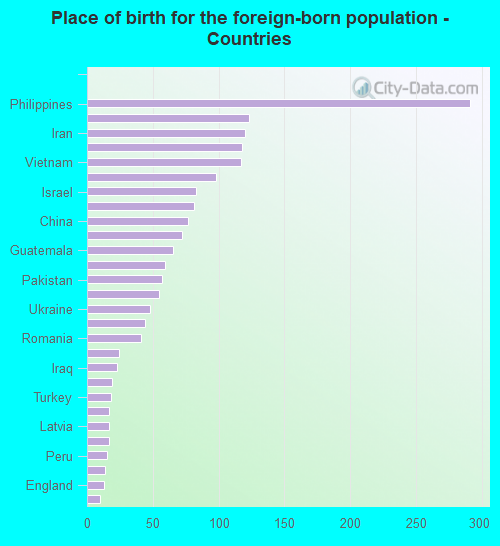
According to 2022 data, the most numerous races in Hewlett, NY are White alone (5,026 residents), Hispanic (639 residents), and Black alone (624 residents). 70.5% of Hewlett residents speak English at home. 24.1% of Hewlett, NY residents are foreign-born (14.8% born in Asia, 5.7% born in Latin America, 3.8% born in Europe), which is 8.7% greater than the foreign-born rate of 22.0% across the entire state of New York.
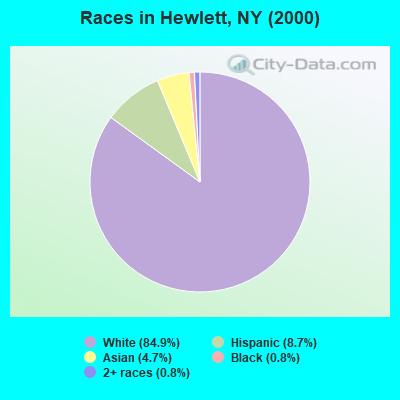
Race distribution in Hewlett
2000 2022
11,760,981 62.0% White alone 2,867,583 15.1% Hispanic 2,812,623 14.8% Black alone 1,035,926 5.5% Asian alone 366,116 1.9% Two or more races 75,499 0.4% Other race alone 52,499 0.3% American Indian alone 5,230 0.03% Native Hawaiian and Other
10,408,933 52.9% White alone 3,867,299 19.7% Hispanic 2,633,840 13.4% Black alone 1,776,286 9.0% Asian alone 732,670 3.7% Two or more races 216,110 1.1% Other race alone 35,082 0.2% American Indian alone 6,931 0.04% Native Hawaiian and Other
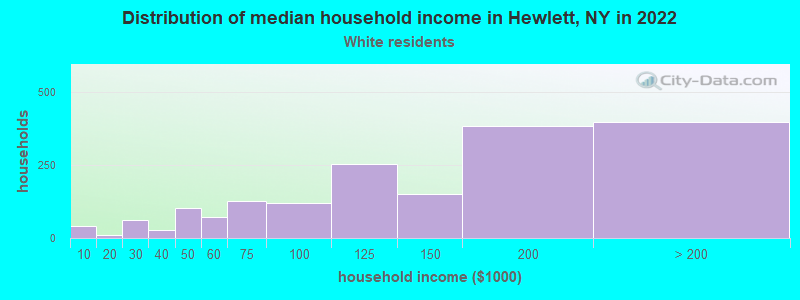
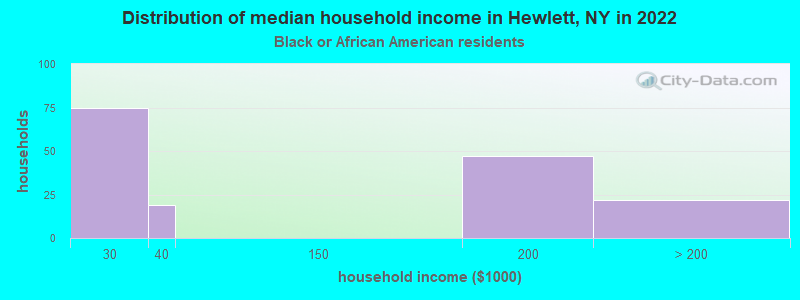
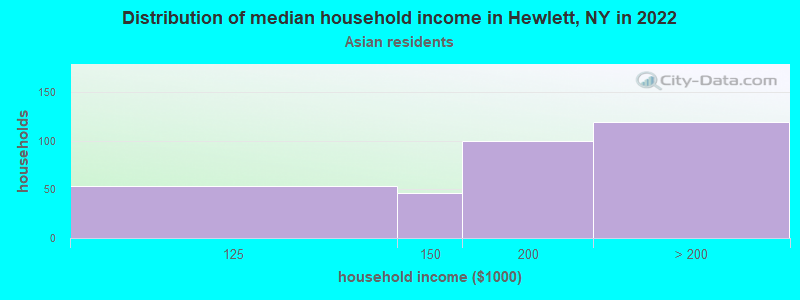
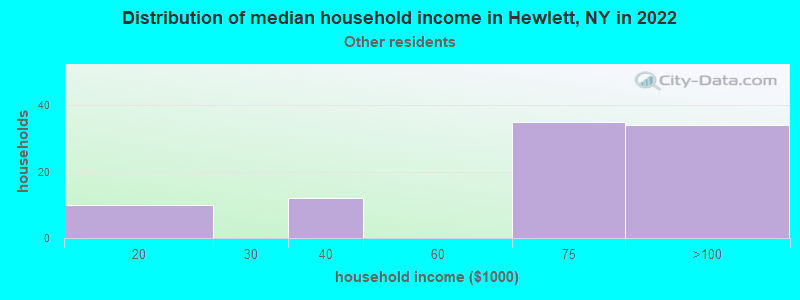
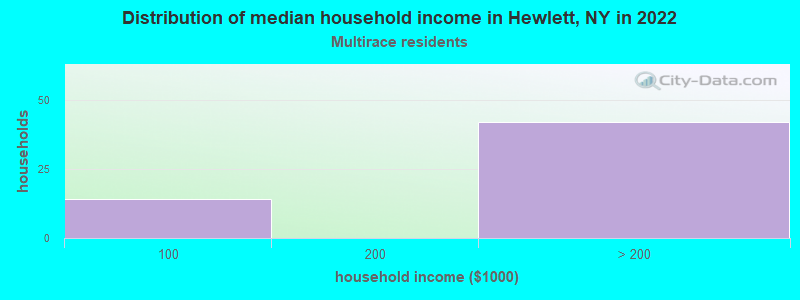
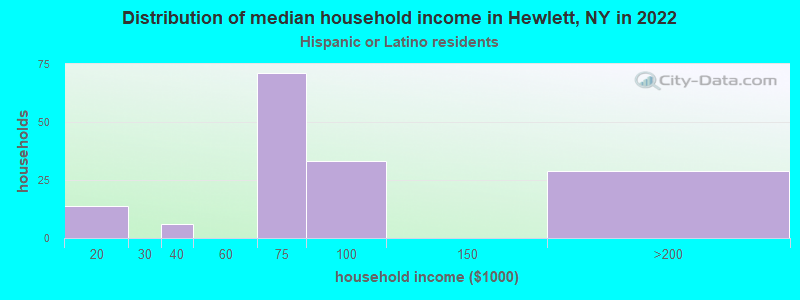
Income and house value in Hewlett Median household income in 2022 $127,979 White non-Hispanic householders$178,622 Asian householders$72,990 Some other race householdersover $200,000 Two or more races householders$69,148 Hispanic or Latino race householdersMedian 2022 house value $666,281 White Non-Hispanic householders$688,307 American Indian or Alaska Native householders $823,215 Asian householders$876,027 Two or more races householders$665,280 Hispanic or Latino householders
Median age by race in Hewlett
37.3 Median age for White residents37.2 37.6 26.8 Median age for Black or African American residents22.4 27.8 -855,158,729.3 Median age for American Indian / Alaska Native residents-607,543,322.5 -837,121,211.3 47.7 Median age for Asian residents49.2 40.4 -487,992,314.6 Median age for Native Hawaiian / Pacific Islander residents-477,502,295.2 -497,387,669.3 56.9 Median age for Other race residents58.1 52.1 25.8 Median age for Two or more races residents25.3 39.9 36.6 Median age for White alone residents36.8 36.7 48.4 Median age for Hispanic or Latino residents36.3 48.8
Owner/renter occupied households by race in Hewlett
House owners and renters - White residents 1,434 81.5% Owner occupied326 18.5% Renter occupiedHouse owners and renters - Black or African American residents 61 45.9% Owner occupied72 54.1% Renter occupiedHouse owners and renters - Asian residents 288 88.4% Owner occupied38 11.6% Renter occupiedHouse owners and renters - Other race residents 64 61.8% Owner occupied39 38.2% Renter occupiedHouse owners and renters - Two or more races residents 61 100.0% Owner occupiedHouse owners and renters - White alone residents 1,458 83.4% Owner occupied291 16.6% Renter occupiedHouse owners and renters - Hispanic or Latino residents 69 42.7% Owner occupied92 57.3% Renter occupied
Language usage in Hewlett
English speakers - Total 70.5% of residents of Hewlett speak English at home.
6.6% of residents speak Spanish at home 234 50.0% Speak English very well234 50.0% Speak English less than very well23.3% of residents speak other language at home 899 54.7% Speak English very well745 45.3% Speak English less than very well
English speakers - Born in the United States 98.5% of residents of Hewlett speak English at home.
English speakers - Native, born elsewhere 47.4% of residents of Hewlett speak English at home.
9.3% of residents speak Spanish at home 31 91.2% Speak English very well3 8.8% Speak English less than very well49.9% of residents speak other language at home 82 45.1% Speak English very well100 54.9% Speak English less than very well
English speakers - Foreign-born 22.1% of residents of Hewlett speak English at home.
13.2% of residents speak Spanish at home 65 26.2% Speak English very well183 73.8% Speak English less than very well66.7% of residents speak other language at home 651 51.8% Speak English very well605 48.2% Speak English less than very well
White (Caucasian) - Speak only English Native:
90.5% (3,687)Foreign-born:
38.3% (189)
White (Caucasian) - Speak another language Native:
8.8% (358)Foreign-born:
63.6% (314)
Black or African American - Speak only English Native:
99.1% (486)Foreign-born:
57.9% (66)
Asian - Speak only English Native:
100.0% (161)Foreign-born:
16.9% (145)
Asian - Speak another language Native:
3.1% (5)Foreign-born:
81.9% (705)
Other race - Speak another language Native:
93.8% (76)Foreign-born:
98.6% (266)
Two or more races - Speak another language Native:
43.0% (110)Foreign-born:
100.0% (116)
White alone - Speak only English Native:
90.6% (3,666)Foreign-born:
26.4% (157)
White alone - Speak another language Native:
9.0% (366)Foreign-born:
73.7% (438)
Hispanic or Latino - Speak only English Native:
37.4% (126)Foreign-born:
17.3% (52)
Hispanic or Latino - Speak another language Native:
62.8% (211)Foreign-born:
82.7% (249)
Foreign-born residents in Hewlett 1,822 residents are foreign born (14.8% Asia , 5.7% Latin America , 3.8% Europe ).
This city:
24.1%New York:
22.6%
Marital status for residents in Hewlett Marital status - White (Caucasian) population 15 years and over
Males 36.2% Never married61.1% Now married0.0% Separated0.8% Widowed1.9% DivorcedFemales 25.5% Never married55.0% Now married1.5% Separated11.3% Widowed6.6% DivorcedWomen who gave birth in the past 12 months Now married:
100.0% (35)Unmarried:
0.0% (0)
Women who did not give birth in the past 12 months Now married:
49.3% (476)Unmarried:
50.7% (490)
Marital status - Black or African American population 15 years and over
Males 57.6% Never married42.4% Now married0.0% Separated0.0% Widowed0.0% DivorcedFemales 74.6% Never married25.4% Now married0.0% Separated0.0% Widowed0.0% DivorcedWomen who did not give birth in the past 12 months Now married:
32.5% (72)Unmarried:
67.5% (149)
Marital status - Asian population 15 years and over
Males 42.0% Never married52.0% Now married0.0% Separated6.0% Widowed0.0% DivorcedFemales 38.3% Never married36.5% Now married0.0% Separated20.7% Widowed4.5% DivorcedWomen who gave birth in the past 12 months Now married:
100.0% (24)Unmarried:
0.0% (0)
Women who did not give birth in the past 12 months Now married:
25.2% (80)Unmarried:
74.8% (239)
Marital status - Other race population 15 years and over
Males 0.0% Never married85.4% Now married0.0% Separated0.0% Widowed14.6% DivorcedFemales 7.6% Never married85.6% Now married0.0% Separated0.0% Widowed6.8% DivorcedWomen who did not give birth in the past 12 months Now married:
83.3% (57)Unmarried:
16.7% (11)
Marital status - Two or more races population 15 years and over
Males 62.9% Never married37.1% Now married0.0% Separated0.0% Widowed0.0% DivorcedFemales 14.8% Never married82.4% Now married0.0% Separated0.0% Widowed2.8% DivorcedWomen who did not give birth in the past 12 months Now married:
74.6% (71)Unmarried:
25.4% (24)
Marital status - White alone, not Hispanic / Latino population 15 years and over
Males 35.8% Never married61.4% Now married0.0% Separated0.8% Widowed1.9% DivorcedFemales 26.4% Never married56.2% Now married0.0% Separated11.7% Widowed5.7% DivorcedWomen who gave birth in the past 12 months Now married:
100.0% (37)Unmarried:
0.0% (0)
Women who did not give birth in the past 12 months Now married:
48.1% (464)Unmarried:
51.9% (501)
Marital status - Hispanic or Latino population 15 years and over
Males 37.4% Never married55.3% Now married0.0% Separated0.0% Widowed7.3% DivorcedFemales 4.4% Never married66.4% Now married14.0% Separated0.0% Widowed15.3% DivorcedWomen who did not give birth in the past 12 months Now married:
74.4% (95)Unmarried:
25.6% (33)
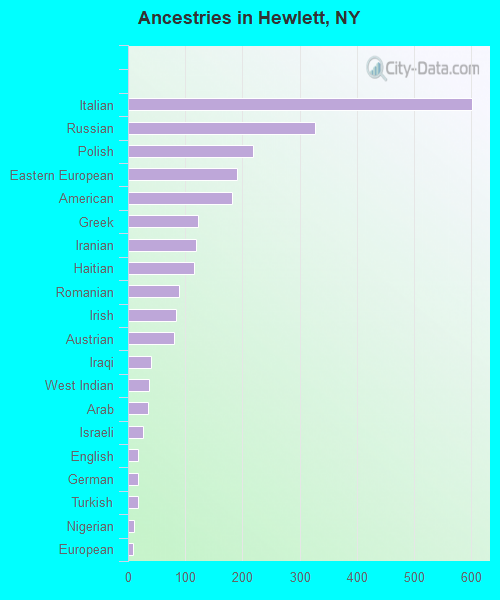
Ancestries in Hewlett
601 12.9% Italian327 7.0% Russian219 4.7% Polish191 4.1% Eastern European182 3.9% American122 2.6% Greek118 2.5% Iranian116 2.5% Haitian90 1.9% Romanian84 1.8% Irish80 1.7% Austrian41 0.9% Iraqi36 0.8% West Indian35 0.7% Arab27 0.6% Israeli18 0.4% English18 0.4% German17 0.4% Turkish10 0.2% Nigerian8 0.2% European
Children Nativity (place of birth) in Hewlett
Children under 6 years - Living with two parents Both parents native 395 100.0% NativeBoth parents foreign-born 101 100.0% NativeChildren under 6 years - Living with one parent Native parent 43 100.0% NativeForeign-born parent 36 100.0% NativeChildren 6 to 17 years - Living with two parents Both parents native 562 100.0% NativeBoth parents foreign-born 377 90.1% Native42 9.9% Foreign-bornChildren 6 to 17 years - Living with one parent Native parent 232 100.0% NativeForeign-born parent 35 47.2% Native39 52.8% Foreign-born
Grandparents responsible for own grandchildren in Hewlett
Grandparents (30 to 59 years) White / Caucasian 15 100.0% Not responsible for grandchildrenHispanic or Latino 18 100.0% Not responsible for grandchildren
Grandparents (60 years and over) White / Caucasian 52 100.0% Not responsible for grandchildrenHispanic or Latino 54 100.0% Not responsible for grandchildren