Races in Herrin, Illinois (IL) Detailed Stats
Data:
Races - White alone (%)
Races - White alone (% change since 2000)
Races - Black alone (%)
Races - Black alone (% change since 2000)
Races - American Indian alone (%)
Races - American Indian alone (% change since 2000)
Races - Asian alone (%)
Races - Asian alone (% change since 2000)
Races - Hispanic (%)
Races - Hispanic (% change since 2000)
Races - Native Hawaiian and Other Pacific Islander alone (%)
Races - Native Hawaiian and Other Pacific Islander alone (% change since 2000)
Races - Two or more races(%)
Races - Two or more races(% change since 2000)
Races - Other race alone (%)
Races - Other race alone (% change since 2000)
Racial diversity
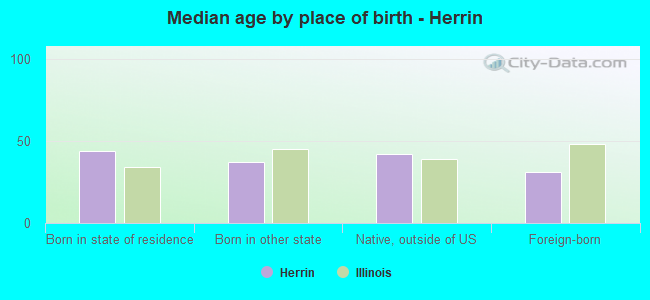
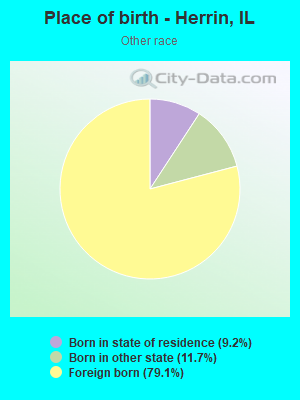
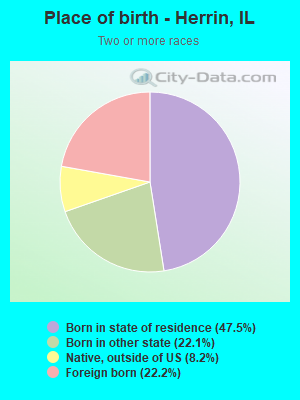
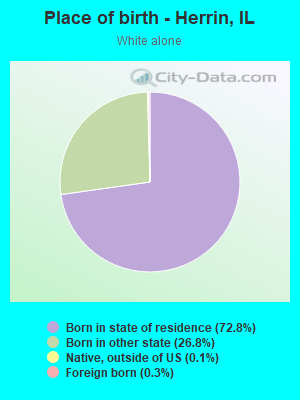
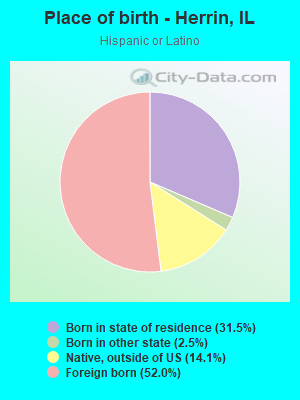
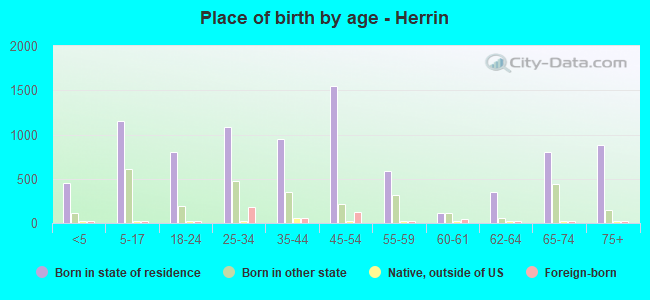
Place of birth - Born in state of residence (%)
Place of birth - Born in state of residence (%) - White
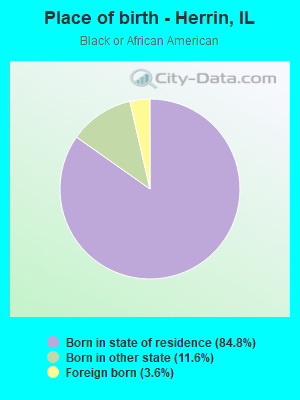
Place of birth - Born in state of residence (%) - Black or African American
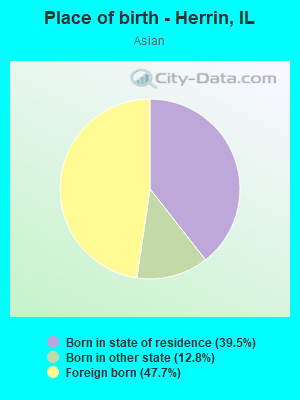
Place of birth - Born in state of residence (%) - Asian
Place of birth - Born in state of residence (%) - Hispanic or Latino
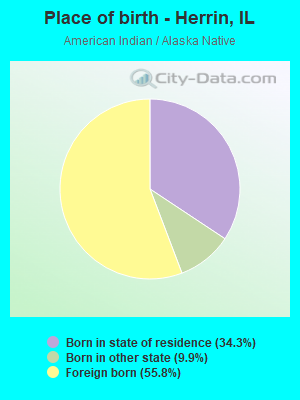
Place of birth - Born in state of residence (%) - American Indian and Alaska Native
Place of birth - Born in state of residence (%) - Multirace
Place of birth - Born in state of residence (%) - Other Race
Place of birth - Born in other state (%)
Place of birth - Born in other state (%) - White
Place of birth - Born in other state (%) - Black or African American
Place of birth - Born in other state (%) - Asian
Place of birth - Born in other state (%) - Hispanic or Latino
Place of birth - Born in other state (%) - American Indian and Alaska Native
Place of birth - Born in other state (%) - Multirace
Place of birth - Born in other state (%) - Other Race
Place of birth - Native, outside of US (%)
Place of birth - Native, outside of US (%) - White
Place of birth - Native, outside of US (%) - Black or African American
Place of birth - Native, outside of US (%) - Asian
Place of birth - Native, outside of US (%) - Hispanic or Latino
Place of birth - Native, outside of US (%) - American Indian and Alaska Native
Place of birth - Native, outside of US (%) - Multirace
Place of birth - Native, outside of US (%) - Other Race
Place of birth - Foreign born (%)
Place of birth - Foreign born (%) - White
Place of birth - Foreign born (%) - Black or African American
Place of birth - Foreign born (%) - Asian
Place of birth - Foreign born (%) - Hispanic or Latino
Place of birth - Foreign born (%) - American Indian and Alaska Native
Place of birth - Foreign born (%) - Multirace
Place of birth - Foreign born (%) - Other Race
Residents speaking English at home (%)
Residents speaking English at home - Born in the United States (%)
Residents speaking English at home - Native, born elsewhere (%)
Residents speaking English at home - Foreign born (%)
Residents speaking Spanish at home (%)
Residents speaking Spanish at home - Born in the United States (%)
Residents speaking Spanish at home - Native, born elsewhere (%)
Residents speaking Spanish at home - Foreign born (%)
Residents speaking other language at home (%)
Residents speaking other language at home - Born in the United States (%)
Residents speaking other language at home - Native, born elsewhere (%)
Residents speaking other language at home - Foreign born (%)
Marital status - Never married (%)
Marital status - Now married (%)
Marital status - Separated (%)
Marital status - Widowed (%)
Marital status - Divorced (%)
Ancestries Reported - Arab (%)
Ancestries Reported - Czech (%)
Ancestries Reported - Danish (%)
Ancestries Reported - Dutch (%)
Ancestries Reported - English (%)
Ancestries Reported - French (%)
Ancestries Reported - French Canadian (%)
Ancestries Reported - German (%)
Ancestries Reported - Greek (%)
Ancestries Reported - Hungarian (%)
Ancestries Reported - Irish (%)
Ancestries Reported - Italian (%)
Ancestries Reported - Lithuanian (%)
Ancestries Reported - Norwegian (%)
Ancestries Reported - Polish (%)
Ancestries Reported - Portuguese (%)
Ancestries Reported - Russian (%)
Ancestries Reported - Scotch-Irish (%)
Ancestries Reported - Scottish (%)
Ancestries Reported - Slovak (%)
Ancestries Reported - Subsaharan African (%)
Ancestries Reported - Swedish (%)
Ancestries Reported - Swiss (%)
Ancestries Reported - Ukrainian (%)
Ancestries Reported - United States (%)
Ancestries Reported - Welsh (%)
Ancestries Reported - West Indian (%)
Ancestries Reported - Other (%)
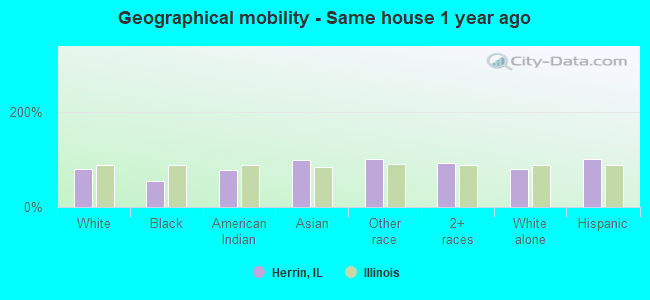
Geographical mobility - Same house 1 year ago (%)
Geographical mobility - Same house 1 year ago (%) - White
Geographical mobility - Same house 1 year ago (%) - Black or African American
Geographical mobility - Same house 1 year ago (%) - Asian
Geographical mobility - Same house 1 year ago (%) - Hispanic or Latino
Geographical mobility - Same house 1 year ago (%) - American Indian and Alaska Native
Geographical mobility - Same house 1 year ago (%) - Multirace
Geographical mobility - Same house 1 year ago (%) - Other Race
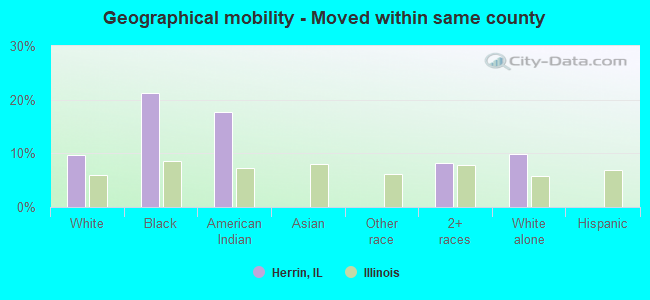
Geographical mobility - Moved within same county (%)
Geographical mobility - Moved within same county (%) - White
Geographical mobility - Moved within same county (%) - Black or African American
Geographical mobility - Moved within same county (%) - Asian
Geographical mobility - Moved within same county (%) - Hispanic or Latino
Geographical mobility - Moved within same county (%) - American Indian and Alaska Native
Geographical mobility - Moved within same county (%) - Multirace
Geographical mobility - Moved within same county (%) - Other Race
Geographical mobility - Moved from different county within same state (%)
Geographical mobility - Moved from different county within same state (%) - White
Geographical mobility - Moved from different county within same state (%) - Black or African American
Geographical mobility - Moved from different county within same state (%) - Asian
Geographical mobility - Moved from different county within same state (%) - Hispanic or Latino
Geographical mobility - Moved from different county within same state (%) - American Indian and Alaska Native
Geographical mobility - Moved from different county within same state (%) - Multirace
Geographical mobility - Moved from different county within same state (%) - Other Race
Geographical mobility - Moved from different state (%)
Geographical mobility - Moved from different state (%) - White
Geographical mobility - Moved from different state (%) - Black or African American
Geographical mobility - Moved from different state (%) - Asian
Geographical mobility - Moved from different state (%) - Hispanic or Latino
Geographical mobility - Moved from different state (%) - American Indian and Alaska Native
Geographical mobility - Moved from different state (%) - Multirace
Geographical mobility - Moved from different state (%) - Other Race
Geographical mobility - Moved from abroad (%)
Geographical mobility - Moved from abroad (%) - White
Geographical mobility - Moved from abroad (%) - Black or African American
Geographical mobility - Moved from abroad (%) - Asian
Geographical mobility - Moved from abroad (%) - Hispanic or Latino
Geographical mobility - Moved from abroad (%) - American Indian and Alaska Native
Geographical mobility - Moved from abroad (%) - Multirace
Geographical mobility - Moved from abroad (%) - Other Race
Place of birth for the foreign-born population - Ireland (%)
Place of birth for the foreign-born population - Denmark (%)
Place of birth for the foreign-born population - Norway (%)
Place of birth for the foreign-born population - Sweden (%)
Place of birth for the foreign-born population - United Kingdom (%)
Place of birth for the foreign-born population - England (%)
Place of birth for the foreign-born population - Scotland (%)
Place of birth for the foreign-born population - Other Northern Europe (%)
Place of birth for the foreign-born population - Austria (%)
Place of birth for the foreign-born population - Belgium (%)
Place of birth for the foreign-born population - France (%)
Place of birth for the foreign-born population - Germany (%)
Place of birth for the foreign-born population - Netherlands (%)
Place of birth for the foreign-born population - Switzerland (%)
Place of birth for the foreign-born population - Other Western Europe (%)
Place of birth for the foreign-born population - Greece (%)
Place of birth for the foreign-born population - Italy (%)
Place of birth for the foreign-born population - Portugal (%)
Place of birth for the foreign-born population - Spain (%)
Place of birth for the foreign-born population - Other Southern Europe (%)
Place of birth for the foreign-born population - Albania (%)
Place of birth for the foreign-born population - Belarus (%)
Place of birth for the foreign-born population - Bosnia and Herzegovina (%)
Place of birth for the foreign-born population - Bulgaria (%)
Place of birth for the foreign-born population - Croatia (%)
Place of birth for the foreign-born population - Czechoslovakia (%)
Place of birth for the foreign-born population - Hungary (%)
Place of birth for the foreign-born population - Latvia (%)
Place of birth for the foreign-born population - Lithuania (%)
Place of birth for the foreign-born population - North Macedonia (Macedonia) (%)
Place of birth for the foreign-born population - Moldova (%)
Place of birth for the foreign-born population - Poland (%)
Place of birth for the foreign-born population - Romania (%)
Place of birth for the foreign-born population - Russia (%)
Place of birth for the foreign-born population - Serbia (%)
Place of birth for the foreign-born population - Ukraine (%)
Place of birth for the foreign-born population - Other Eastern Europe (%)
Place of birth for the foreign-born population - China (%)
Place of birth for the foreign-born population - Hong Kong (%)
Place of birth for the foreign-born population - Taiwan (%)
Place of birth for the foreign-born population - Japan (%)
Place of birth for the foreign-born population - Korea (%)
Place of birth for the foreign-born population - Other Eastern Asia (%)
Place of birth for the foreign-born population - Afghanistan (%)
Place of birth for the foreign-born population - Bangladesh (%)
Place of birth for the foreign-born population - India (%)
Place of birth for the foreign-born population - Iran (%)
Place of birth for the foreign-born population - Kazakhstan (%)
Place of birth for the foreign-born population - Nepal (%)
Place of birth for the foreign-born population - Pakistan (%)
Place of birth for the foreign-born population - Sri Lanka (%)
Place of birth for the foreign-born population - Uzbekistan (%)
Place of birth for the foreign-born population - Other South Central Asia (%)
Place of birth for the foreign-born population - Burma (%)
Place of birth for the foreign-born population - Cambodia (%)
Place of birth for the foreign-born population - Indonesia (%)
Place of birth for the foreign-born population - Laos (%)
Place of birth for the foreign-born population - Malaysia (%)
Place of birth for the foreign-born population - Philippines (%)
Place of birth for the foreign-born population - Singapore (%)
Place of birth for the foreign-born population - Thailand (%)
Place of birth for the foreign-born population - Vietnam (%)
Place of birth for the foreign-born population - Other South Eastern Asia (%)
Place of birth for the foreign-born population - Armenia (%)
Place of birth for the foreign-born population - Iraq (%)
Place of birth for the foreign-born population - Israel (%)
Place of birth for the foreign-born population - Jordan (%)
Place of birth for the foreign-born population - Kuwait (%)
Place of birth for the foreign-born population - Lebanon (%)
Place of birth for the foreign-born population - Saudi Arabia (%)
Place of birth for the foreign-born population - Syria (%)
Place of birth for the foreign-born population - Turkey (%)
Place of birth for the foreign-born population - Yemen (%)
Place of birth for the foreign-born population - Other Western Asia (%)
Place of birth for the foreign-born population - Eritrea (%)
Place of birth for the foreign-born population - Ethiopia (%)
Place of birth for the foreign-born population - Kenya (%)
Place of birth for the foreign-born population - Somalia (%)
Place of birth for the foreign-born population - Uganda (%)
Place of birth for the foreign-born population - Zimbabwe (%)
Place of birth for the foreign-born population - Other Eastern Africa (%)
Place of birth for the foreign-born population - Cameroon (%)
Place of birth for the foreign-born population - Congo (%)
Place of birth for the foreign-born population - Democratic Republic of Congo (Zaire) (%)
Place of birth for the foreign-born population - Other Middle Africa (%)
Place of birth for the foreign-born population - Egypt (%)
Place of birth for the foreign-born population - Morocco (%)
Place of birth for the foreign-born population - Sudan (%)
Place of birth for the foreign-born population - Other Northern Africa (%)
Place of birth for the foreign-born population - South Africa (%)
Place of birth for the foreign-born population - Other Southern Africa (%)
Place of birth for the foreign-born population - Cabo Verde (%)
Place of birth for the foreign-born population - Ghana (%)
Place of birth for the foreign-born population - Liberia (%)
Place of birth for the foreign-born population - Nigeria (%)
Place of birth for the foreign-born population - Senegal (%)
Place of birth for the foreign-born population - Sierra Leone (%)
Place of birth for the foreign-born population - Other Western Africa (%)
Place of birth for the foreign-born population - Australia (%)
Place of birth for the foreign-born population - New Zealand (%)
Place of birth for the foreign-born population - Fiji (%)
Place of birth for the foreign-born population - Micronesia (%)
Place of birth for the foreign-born population - Bahamas (%)
Place of birth for the foreign-born population - Barbados (%)
Place of birth for the foreign-born population - Cuba (%)
Place of birth for the foreign-born population - Dominica (%)
Place of birth for the foreign-born population - Dominican Republic (%)
Place of birth for the foreign-born population - Grenada (%)
Place of birth for the foreign-born population - Haiti (%)
Place of birth for the foreign-born population - Jamaica (%)
Place of birth for the foreign-born population - St. Vincent and the Grenadines (%)
Place of birth for the foreign-born population - Trinidad and Tobago (%)
Place of birth for the foreign-born population - West Indies (%)
Place of birth for the foreign-born population - Other Caribbean (%)
Place of birth for the foreign-born population - Belize (%)
Place of birth for the foreign-born population - Costa Rica (%)
Place of birth for the foreign-born population - El Salvador (%)
Place of birth for the foreign-born population - Guatemala (%)
Place of birth for the foreign-born population - Honduras (%)
Place of birth for the foreign-born population - Mexico (%)
Place of birth for the foreign-born population - Nicaragua (%)
Place of birth for the foreign-born population - Panama (%)
Place of birth for the foreign-born population - Other Central America (%)
Place of birth for the foreign-born population - Argentina (%)
Place of birth for the foreign-born population - Bolivia (%)
Place of birth for the foreign-born population - Brazil (%)
Place of birth for the foreign-born population - Chile (%)
Place of birth for the foreign-born population - Colombia (%)
Place of birth for the foreign-born population - Ecuador (%)
Place of birth for the foreign-born population - Guyana (%)
Place of birth for the foreign-born population - Peru (%)
Place of birth for the foreign-born population - Uruguay (%)
Place of birth for the foreign-born population - Venezuela (%)
Place of birth for the foreign-born population - Other South America (%)
Place of birth for the foreign-born population - Canada (%)
Place of birth for the foreign-born population - Other Northern America (%)
Place of birth for the foreign-born population - Other (%)
Latest news about races in Herrin, IL collected exclusively by city-data.com from local newspapers, TV, and radio stations
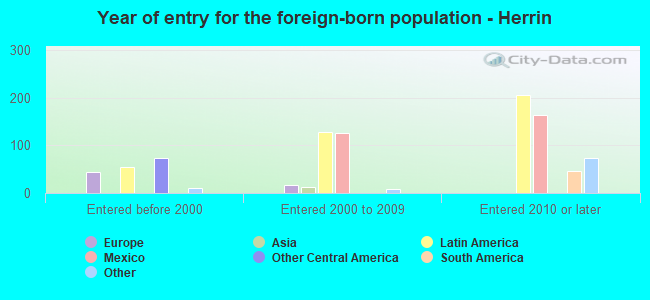
According to 2022 data, the most numerous races in Herrin, IL are White alone (10,312 residents), Hispanic (567 residents), and Black alone (485 residents). 93.1% of Herrin residents speak English at home. 4.2% of Herrin, IL residents are foreign-born (2.8% born in Latin America, 0.7% born in Africa, 0.5% born in Europe), which is 234.1% less than the foreign-born rate of 14.0% across the entire state of Illinois.
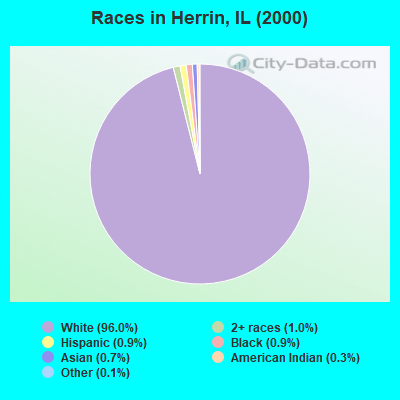
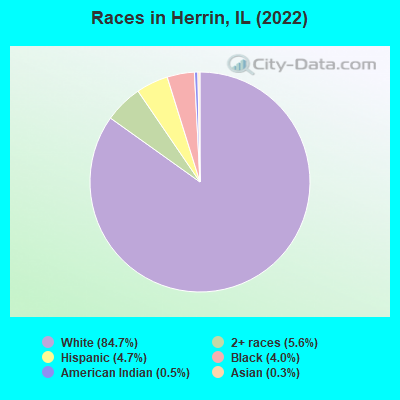
Race distribution in Herrin
2000 2022
8,424,140 67.8% White alone 1,856,152 14.9% Black alone 1,530,262 12.3% Hispanic 419,916 3.4% Asian alone 153,996 1.2% Two or more races 13,479 0.1% Other race alone 18,232 0.1% American Indian alone 3,116 0.03% Native Hawaiian and Other
7,356,301 58.5% White alone 2,299,726 18.3% Hispanic 1,660,423 13.2% Black alone 747,296 5.9% Asian alone 458,599 3.6% Two or more races 45,386 0.4% Other race alone 10,405 0.08% American Indian alone 3,896 0.03% Native Hawaiian and Other
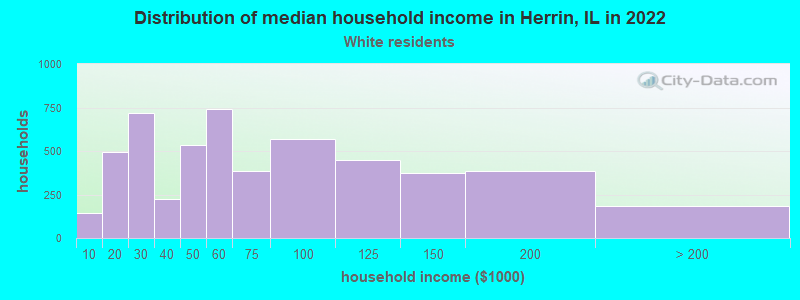
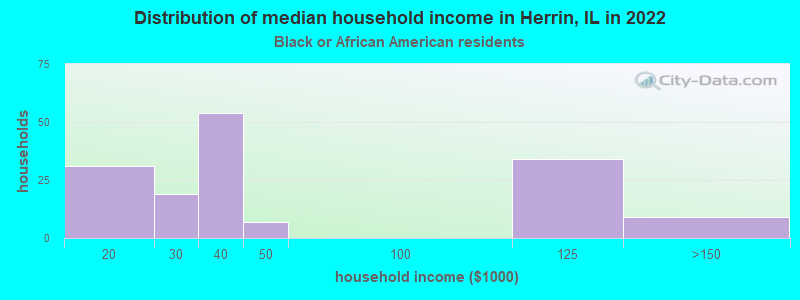
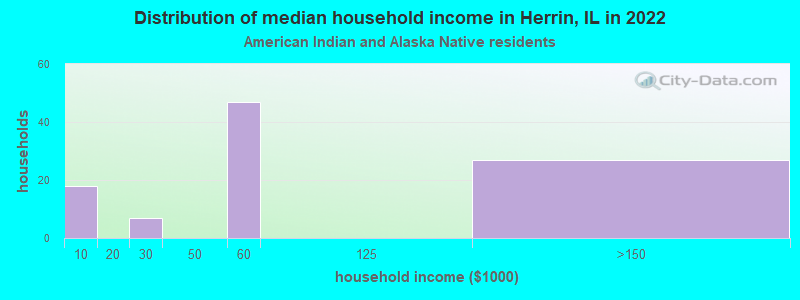
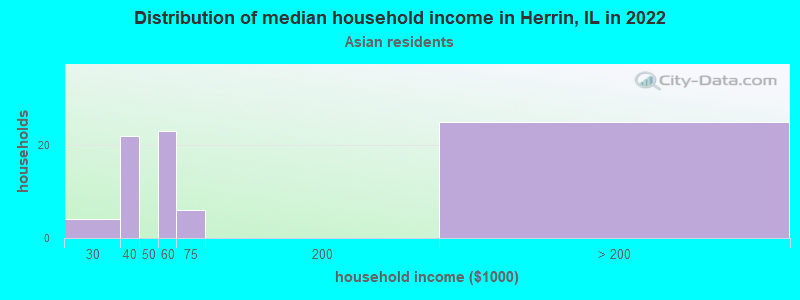
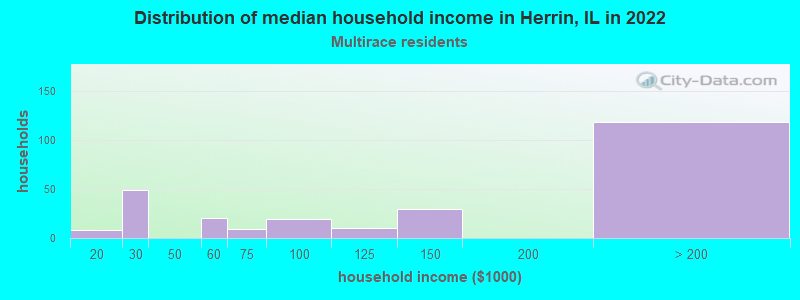
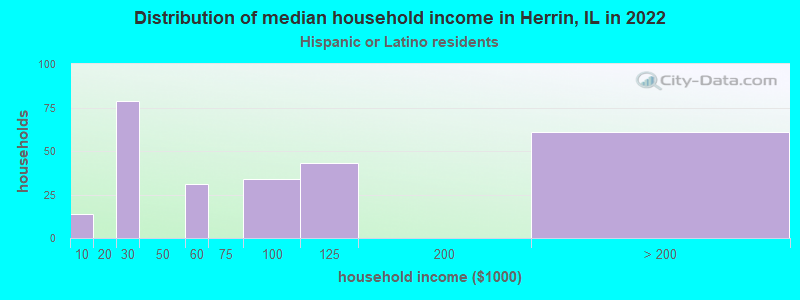
Income and house value in Herrin Median household income in 2022 $56,601 White non-Hispanic householders$47,873 American Indian and Alaska Native householdersMedian 2022 house value $115,265 White Non-Hispanic householders$117,858 Black or African American householders $206,252 Asian householders$191,873 Hispanic or Latino householders
Median age by race in Herrin
46.0 Median age for White residents45.4 46.5 28.5 Median age for Black or African American residents31.1 32.2 41.3 Median age for American Indian / Alaska Native residents32.0 69.1 35.5 Median age for Asian residents50.9 32.9 -666,666,666.0 Median age for Native Hawaiian / Pacific Islander residents-666,666,666.0 -666,666,666.0 55.9 Median age for Other race residents56.3 -686,210,639.9 33.7 Median age for Two or more races residents33.1 44.8 46.0 Median age for White alone residents45.2 46.9 34.2 Median age for Hispanic or Latino residents51.3 16.6
Owner/renter occupied households by race in Herrin
House owners and renters - White residents 3,263 63.8% Owner occupied1,854 36.2% Renter occupiedHouse owners and renters - Black or African American residents 46 29.9% Owner occupied107 70.1% Renter occupiedHouse owners and renters - American Indian / Alaska Native residents 44 39.5% Owner occupied68 60.5% Renter occupiedHouse owners and renters - Asian residents 9 100.0% Owner occupiedHouse owners and renters - Other race residents 26 30.5% Owner occupied58 69.5% Renter occupiedHouse owners and renters - Two or more races residents 97 53.6% Owner occupied84 46.4% Renter occupiedHouse owners and renters - White alone residents 3,187 63.2% Owner occupied1,852 36.8% Renter occupiedHouse owners and renters - Hispanic or Latino residents 204 68.3% Owner occupied95 31.7% Renter occupied
Language usage in Herrin
English speakers - Total 93.1% of residents of Herrin speak English at home.
4.0% of residents speak Spanish at home 249 53.5% Speak English very well216 46.5% Speak English less than very well2.4% of residents speak other language at home 253 89.7% Speak English very well29 10.3% Speak English less than very well
English speakers - Born in the United States 98.9% of residents of Herrin speak English at home.
0.7% of residents speak other language at home 17 100.0% Speak English very well
English speakers - Native, born elsewhere 11.5% of residents of Herrin speak English at home.
82.8% of residents speak Spanish at home 17 23.6% Speak English very well55 76.4% Speak English less than very well
English speakers - Foreign-born 1.4% of residents of Herrin speak English at home.
68.1% of residents speak Spanish at home 196 56.0% Speak English very well154 44.0% Speak English less than very well30.9% of residents speak other language at home 141 88.7% Speak English very well18 11.3% Speak English less than very well
White (Caucasian) - Speak another language Native:
0.7% (63)Foreign-born:
98.0% (48)
Black or African American - Speak another language Native:
13.4% (56)Foreign-born:
95.1% (18)
Asian - Speak only English Native:
49.3% (8)Foreign-born:
46.7% (7)
Asian - Speak another language Native:
50.8% (9)Foreign-born:
47.5% (7)
Two or more races - Speak another language Native:
15.6% (113)Foreign-born:
100.0% (272)
White alone - Speak another language Native:
0.8% (78)Foreign-born:
100.0% (65)
Hispanic or Latino - Speak another language Native:
34.4% (75)Foreign-born:
100.0% (353)
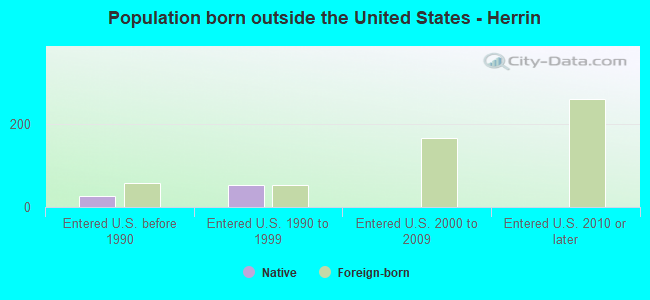
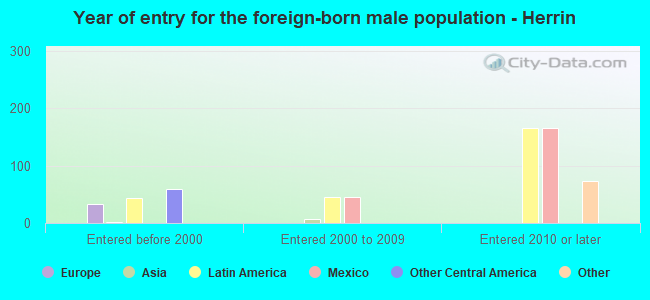
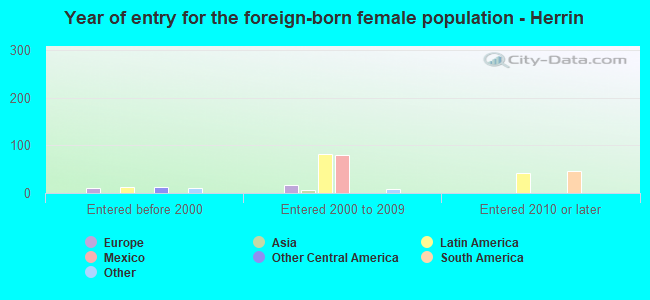
Foreign-born residents in Herrin 514 residents are foreign born (2.8% Latin America , 0.7% Africa , 0.5% Europe ).
This city:
4.2%Illinois:
14.1%
Marital status for residents in Herrin Marital status - White (Caucasian) population 15 years and over
Males 23.8% Never married51.3% Now married1.5% Separated5.3% Widowed18.2% DivorcedFemales 23.9% Never married43.6% Now married2.6% Separated10.1% Widowed19.7% DivorcedWomen who gave birth in the past 12 months Now married:
83.9% (102)Unmarried:
16.1% (20)
Women who did not give birth in the past 12 months Now married:
44.5% (942)Unmarried:
55.5% (1,177)
Marital status - Black or African American population 15 years and over
Males 68.9% Never married31.1% Now married0.0% Separated0.0% Widowed0.0% DivorcedFemales 61.4% Never married24.5% Now married0.0% Separated0.0% Widowed14.1% DivorcedWomen who did not give birth in the past 12 months Now married:
19.7% (32)Unmarried:
80.3% (131)
Marital status - American Indian / Alaska Native population 15 years and over
Males 23.2% Never married76.8% Now married0.0% Separated0.0% Widowed0.0% DivorcedFemales 3.3% Never married78.5% Now married0.0% Separated18.2% Widowed0.0% DivorcedWomen who did not give birth in the past 12 months Now married:
96.0% (158)Unmarried:
4.0% (7)
Marital status - Asian population 15 years and over
Males 0.0% Never married100.0% Now married0.0% Separated0.0% Widowed0.0% DivorcedFemales 57.1% Never married42.9% Now married0.0% Separated0.0% Widowed0.0% DivorcedWomen who did not give birth in the past 12 months Now married:
42.9% (6)Unmarried:
57.1% (8)
Marital status - Two or more races population 15 years and over
Males 55.0% Never married26.0% Now married19.0% Separated0.0% Widowed0.0% DivorcedFemales 26.3% Never married49.6% Now married2.5% Separated3.0% Widowed18.6% DivorcedWomen who gave birth in the past 12 months Now married:
0.0% (0)Unmarried:
100.0% (17)
Women who did not give birth in the past 12 months Now married:
48.6% (123)Unmarried:
51.4% (131)
Marital status - White alone, not Hispanic / Latino population 15 years and over
Males 24.1% Never married50.7% Now married1.5% Separated5.3% Widowed18.4% DivorcedFemales 24.1% Never married43.3% Now married2.6% Separated10.2% Widowed19.9% DivorcedWomen who gave birth in the past 12 months Now married:
83.9% (102)Unmarried:
16.1% (20)
Women who did not give birth in the past 12 months Now married:
43.7% (912)Unmarried:
56.3% (1,177)
Marital status - Hispanic or Latino population 15 years and over
Males 39.2% Never married26.2% Now married15.0% Separated19.6% Widowed0.0% DivorcedFemales 0.0% Never married92.5% Now married0.0% Separated7.5% Widowed0.0% DivorcedWomen who did not give birth in the past 12 months Now married:
100.0% (143)Unmarried:
0.0% (0)
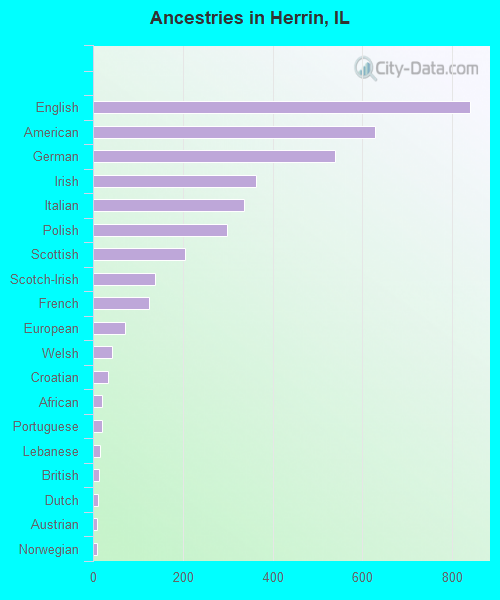
Ancestries in Herrin
840 16.5% English628 12.3% American538 10.6% German363 7.1% Irish336 6.6% Italian299 5.9% Polish206 4.0% Scottish137 2.7% Scotch-Irish124 2.4% French71 1.4% European43 0.8% Welsh34 0.7% Croatian21 0.4% African19 0.4% Portuguese15 0.3% Lebanese13 0.3% British11 0.2% Dutch9 0.2% Austrian9 0.2% Norwegian7 0.1% Czechoslovakian5 0.10% Scandinavian
Children Nativity (place of birth) in Herrin
Children under 6 years - Living with two parents Both parents native 369 100.0% NativeChildren under 6 years - Living with one parent Native parent 238 100.0% NativeChildren 6 to 17 years - Living with two parents Both parents native 901 100.0% NativeBoth parents foreign-born 28 100.0% NativeOne native, one foreign-born parent 28 71.5% Native11 28.5% Foreign-bornChildren 6 to 17 years - Living with one parent Native parent 466 100.0% Native
Grandparents responsible for own grandchildren in Herrin
Grandparents (30 to 59 years) White / Caucasian 18 73.2% Responsible for grandchildren7 26.8% Not responsible for grandchildrenBlack or African American 52 100.0% Responsible for grandchildrenTwo or more races 30 100.0% Not responsible for grandchildrenWhite alone, not Hispanic / Latino 31 79.1% Responsible for grandchildren8 20.9% Not responsible for grandchildrenGrandparents (60 years and over) White / Caucasian 21 37.2% Responsible for grandchildren35 62.8% Not responsible for grandchildrenTwo or more races 2 100.0% Responsible for grandchildrenWhite alone, not Hispanic / Latino 33 50.9% Responsible for grandchildren32 49.1% Not responsible for grandchildren