Races in Hendersonville, Tennessee (TN) Detailed Stats
Data:
Races - White alone (%)
Races - White alone (% change since 2000)
Races - Black alone (%)
Races - Black alone (% change since 2000)
Races - American Indian alone (%)
Races - American Indian alone (% change since 2000)
Races - Asian alone (%)
Races - Asian alone (% change since 2000)
Races - Hispanic (%)
Races - Hispanic (% change since 2000)
Races - Native Hawaiian and Other Pacific Islander alone (%)
Races - Native Hawaiian and Other Pacific Islander alone (% change since 2000)
Races - Two or more races(%)
Races - Two or more races(% change since 2000)
Races - Other race alone (%)
Races - Other race alone (% change since 2000)
Racial diversity
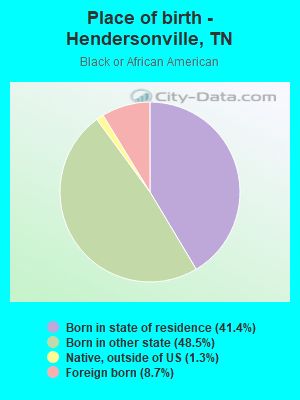
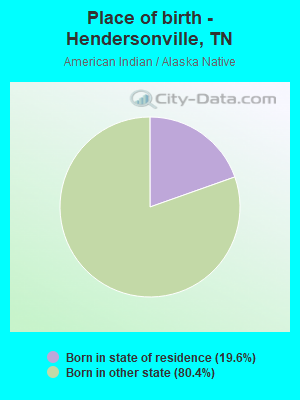
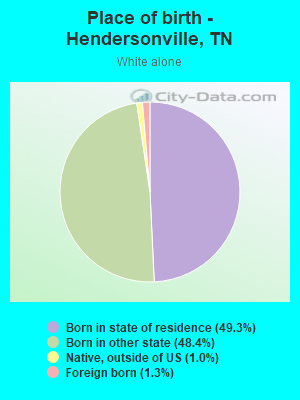
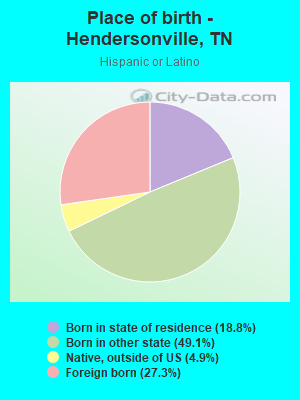
Place of birth - Born in state of residence (%)
Place of birth - Born in state of residence (%) - White
Place of birth - Born in state of residence (%) - Black or African American
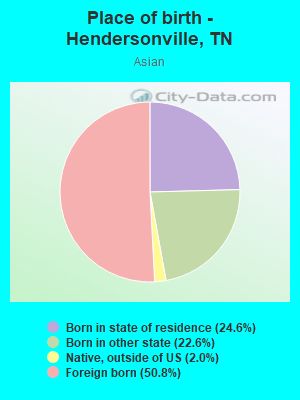
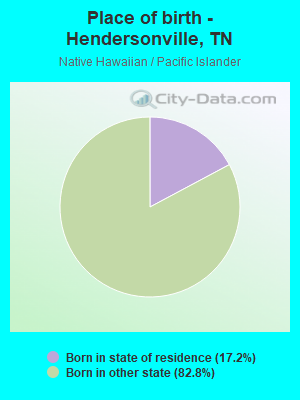
Place of birth - Born in state of residence (%) - Asian
Place of birth - Born in state of residence (%) - Hispanic or Latino
Place of birth - Born in state of residence (%) - American Indian and Alaska Native
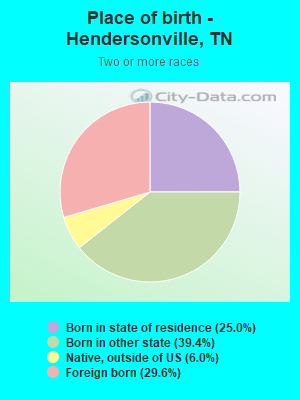
Place of birth - Born in state of residence (%) - Multirace
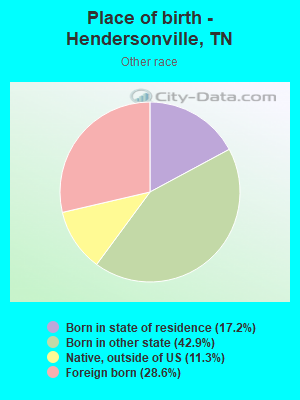
Place of birth - Born in state of residence (%) - Other Race
Place of birth - Born in other state (%)
Place of birth - Born in other state (%) - White
Place of birth - Born in other state (%) - Black or African American
Place of birth - Born in other state (%) - Asian
Place of birth - Born in other state (%) - Hispanic or Latino
Place of birth - Born in other state (%) - American Indian and Alaska Native
Place of birth - Born in other state (%) - Multirace
Place of birth - Born in other state (%) - Other Race
Place of birth - Native, outside of US (%)
Place of birth - Native, outside of US (%) - White
Place of birth - Native, outside of US (%) - Black or African American
Place of birth - Native, outside of US (%) - Asian
Place of birth - Native, outside of US (%) - Hispanic or Latino
Place of birth - Native, outside of US (%) - American Indian and Alaska Native
Place of birth - Native, outside of US (%) - Multirace
Place of birth - Native, outside of US (%) - Other Race
Place of birth - Foreign born (%)
Place of birth - Foreign born (%) - White
Place of birth - Foreign born (%) - Black or African American
Place of birth - Foreign born (%) - Asian
Place of birth - Foreign born (%) - Hispanic or Latino
Place of birth - Foreign born (%) - American Indian and Alaska Native
Place of birth - Foreign born (%) - Multirace
Place of birth - Foreign born (%) - Other Race
Residents speaking English at home (%)
Residents speaking English at home - Born in the United States (%)
Residents speaking English at home - Native, born elsewhere (%)
Residents speaking English at home - Foreign born (%)
Residents speaking Spanish at home (%)
Residents speaking Spanish at home - Born in the United States (%)
Residents speaking Spanish at home - Native, born elsewhere (%)
Residents speaking Spanish at home - Foreign born (%)
Residents speaking other language at home (%)
Residents speaking other language at home - Born in the United States (%)
Residents speaking other language at home - Native, born elsewhere (%)
Residents speaking other language at home - Foreign born (%)
Marital status - Never married (%)
Marital status - Now married (%)
Marital status - Separated (%)
Marital status - Widowed (%)
Marital status - Divorced (%)
Ancestries Reported - Arab (%)
Ancestries Reported - Czech (%)
Ancestries Reported - Danish (%)
Ancestries Reported - Dutch (%)
Ancestries Reported - English (%)
Ancestries Reported - French (%)
Ancestries Reported - French Canadian (%)
Ancestries Reported - German (%)
Ancestries Reported - Greek (%)
Ancestries Reported - Hungarian (%)
Ancestries Reported - Irish (%)
Ancestries Reported - Italian (%)
Ancestries Reported - Lithuanian (%)
Ancestries Reported - Norwegian (%)
Ancestries Reported - Polish (%)
Ancestries Reported - Portuguese (%)
Ancestries Reported - Russian (%)
Ancestries Reported - Scotch-Irish (%)
Ancestries Reported - Scottish (%)
Ancestries Reported - Slovak (%)
Ancestries Reported - Subsaharan African (%)
Ancestries Reported - Swedish (%)
Ancestries Reported - Swiss (%)
Ancestries Reported - Ukrainian (%)
Ancestries Reported - United States (%)
Ancestries Reported - Welsh (%)
Ancestries Reported - West Indian (%)
Ancestries Reported - Other (%)
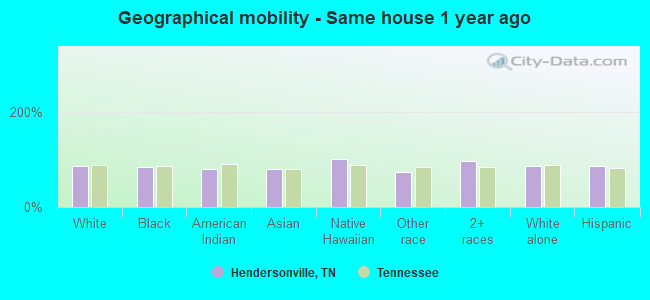
Geographical mobility - Same house 1 year ago (%)
Geographical mobility - Same house 1 year ago (%) - White
Geographical mobility - Same house 1 year ago (%) - Black or African American
Geographical mobility - Same house 1 year ago (%) - Asian
Geographical mobility - Same house 1 year ago (%) - Hispanic or Latino
Geographical mobility - Same house 1 year ago (%) - American Indian and Alaska Native
Geographical mobility - Same house 1 year ago (%) - Multirace
Geographical mobility - Same house 1 year ago (%) - Other Race
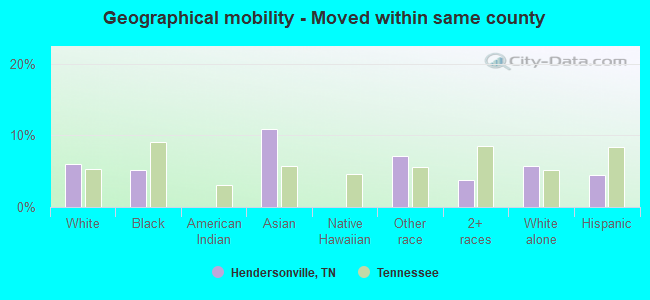
Geographical mobility - Moved within same county (%)
Geographical mobility - Moved within same county (%) - White
Geographical mobility - Moved within same county (%) - Black or African American
Geographical mobility - Moved within same county (%) - Asian
Geographical mobility - Moved within same county (%) - Hispanic or Latino
Geographical mobility - Moved within same county (%) - American Indian and Alaska Native
Geographical mobility - Moved within same county (%) - Multirace
Geographical mobility - Moved within same county (%) - Other Race
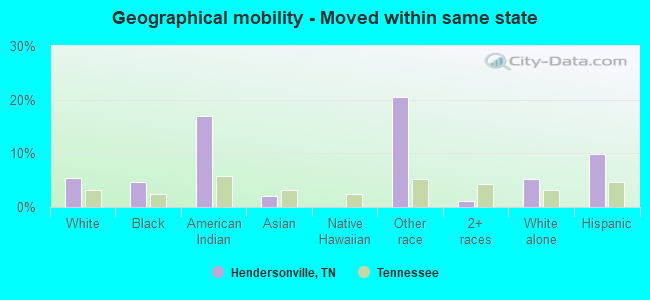
Geographical mobility - Moved from different county within same state (%)
Geographical mobility - Moved from different county within same state (%) - White
Geographical mobility - Moved from different county within same state (%) - Black or African American
Geographical mobility - Moved from different county within same state (%) - Asian
Geographical mobility - Moved from different county within same state (%) - Hispanic or Latino
Geographical mobility - Moved from different county within same state (%) - American Indian and Alaska Native
Geographical mobility - Moved from different county within same state (%) - Multirace
Geographical mobility - Moved from different county within same state (%) - Other Race
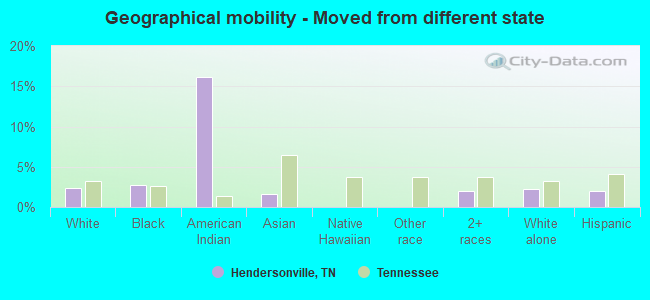
Geographical mobility - Moved from different state (%)
Geographical mobility - Moved from different state (%) - White
Geographical mobility - Moved from different state (%) - Black or African American
Geographical mobility - Moved from different state (%) - Asian
Geographical mobility - Moved from different state (%) - Hispanic or Latino
Geographical mobility - Moved from different state (%) - American Indian and Alaska Native
Geographical mobility - Moved from different state (%) - Multirace
Geographical mobility - Moved from different state (%) - Other Race
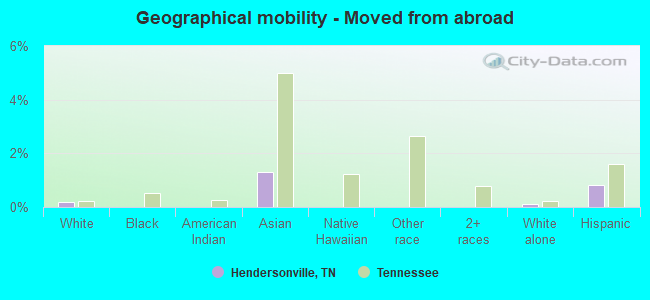
Geographical mobility - Moved from abroad (%)
Geographical mobility - Moved from abroad (%) - White
Geographical mobility - Moved from abroad (%) - Black or African American
Geographical mobility - Moved from abroad (%) - Asian
Geographical mobility - Moved from abroad (%) - Hispanic or Latino
Geographical mobility - Moved from abroad (%) - American Indian and Alaska Native
Geographical mobility - Moved from abroad (%) - Multirace
Geographical mobility - Moved from abroad (%) - Other Race
Place of birth for the foreign-born population - Ireland (%)
Place of birth for the foreign-born population - Denmark (%)
Place of birth for the foreign-born population - Norway (%)
Place of birth for the foreign-born population - Sweden (%)
Place of birth for the foreign-born population - United Kingdom (%)
Place of birth for the foreign-born population - England (%)
Place of birth for the foreign-born population - Scotland (%)
Place of birth for the foreign-born population - Other Northern Europe (%)
Place of birth for the foreign-born population - Austria (%)
Place of birth for the foreign-born population - Belgium (%)
Place of birth for the foreign-born population - France (%)
Place of birth for the foreign-born population - Germany (%)
Place of birth for the foreign-born population - Netherlands (%)
Place of birth for the foreign-born population - Switzerland (%)
Place of birth for the foreign-born population - Other Western Europe (%)
Place of birth for the foreign-born population - Greece (%)
Place of birth for the foreign-born population - Italy (%)
Place of birth for the foreign-born population - Portugal (%)
Place of birth for the foreign-born population - Spain (%)
Place of birth for the foreign-born population - Other Southern Europe (%)
Place of birth for the foreign-born population - Albania (%)
Place of birth for the foreign-born population - Belarus (%)
Place of birth for the foreign-born population - Bosnia and Herzegovina (%)
Place of birth for the foreign-born population - Bulgaria (%)
Place of birth for the foreign-born population - Croatia (%)
Place of birth for the foreign-born population - Czechoslovakia (%)
Place of birth for the foreign-born population - Hungary (%)
Place of birth for the foreign-born population - Latvia (%)
Place of birth for the foreign-born population - Lithuania (%)
Place of birth for the foreign-born population - North Macedonia (Macedonia) (%)
Place of birth for the foreign-born population - Moldova (%)
Place of birth for the foreign-born population - Poland (%)
Place of birth for the foreign-born population - Romania (%)
Place of birth for the foreign-born population - Russia (%)
Place of birth for the foreign-born population - Serbia (%)
Place of birth for the foreign-born population - Ukraine (%)
Place of birth for the foreign-born population - Other Eastern Europe (%)
Place of birth for the foreign-born population - China (%)
Place of birth for the foreign-born population - Hong Kong (%)
Place of birth for the foreign-born population - Taiwan (%)
Place of birth for the foreign-born population - Japan (%)
Place of birth for the foreign-born population - Korea (%)
Place of birth for the foreign-born population - Other Eastern Asia (%)
Place of birth for the foreign-born population - Afghanistan (%)
Place of birth for the foreign-born population - Bangladesh (%)
Place of birth for the foreign-born population - India (%)
Place of birth for the foreign-born population - Iran (%)
Place of birth for the foreign-born population - Kazakhstan (%)
Place of birth for the foreign-born population - Nepal (%)
Place of birth for the foreign-born population - Pakistan (%)
Place of birth for the foreign-born population - Sri Lanka (%)
Place of birth for the foreign-born population - Uzbekistan (%)
Place of birth for the foreign-born population - Other South Central Asia (%)
Place of birth for the foreign-born population - Burma (%)
Place of birth for the foreign-born population - Cambodia (%)
Place of birth for the foreign-born population - Indonesia (%)
Place of birth for the foreign-born population - Laos (%)
Place of birth for the foreign-born population - Malaysia (%)
Place of birth for the foreign-born population - Philippines (%)
Place of birth for the foreign-born population - Singapore (%)
Place of birth for the foreign-born population - Thailand (%)
Place of birth for the foreign-born population - Vietnam (%)
Place of birth for the foreign-born population - Other South Eastern Asia (%)
Place of birth for the foreign-born population - Armenia (%)
Place of birth for the foreign-born population - Iraq (%)
Place of birth for the foreign-born population - Israel (%)
Place of birth for the foreign-born population - Jordan (%)
Place of birth for the foreign-born population - Kuwait (%)
Place of birth for the foreign-born population - Lebanon (%)
Place of birth for the foreign-born population - Saudi Arabia (%)
Place of birth for the foreign-born population - Syria (%)
Place of birth for the foreign-born population - Turkey (%)
Place of birth for the foreign-born population - Yemen (%)
Place of birth for the foreign-born population - Other Western Asia (%)
Place of birth for the foreign-born population - Eritrea (%)
Place of birth for the foreign-born population - Ethiopia (%)
Place of birth for the foreign-born population - Kenya (%)
Place of birth for the foreign-born population - Somalia (%)
Place of birth for the foreign-born population - Uganda (%)
Place of birth for the foreign-born population - Zimbabwe (%)
Place of birth for the foreign-born population - Other Eastern Africa (%)
Place of birth for the foreign-born population - Cameroon (%)
Place of birth for the foreign-born population - Congo (%)
Place of birth for the foreign-born population - Democratic Republic of Congo (Zaire) (%)
Place of birth for the foreign-born population - Other Middle Africa (%)
Place of birth for the foreign-born population - Egypt (%)
Place of birth for the foreign-born population - Morocco (%)
Place of birth for the foreign-born population - Sudan (%)
Place of birth for the foreign-born population - Other Northern Africa (%)
Place of birth for the foreign-born population - South Africa (%)
Place of birth for the foreign-born population - Other Southern Africa (%)
Place of birth for the foreign-born population - Cabo Verde (%)
Place of birth for the foreign-born population - Ghana (%)
Place of birth for the foreign-born population - Liberia (%)
Place of birth for the foreign-born population - Nigeria (%)
Place of birth for the foreign-born population - Senegal (%)
Place of birth for the foreign-born population - Sierra Leone (%)
Place of birth for the foreign-born population - Other Western Africa (%)
Place of birth for the foreign-born population - Australia (%)
Place of birth for the foreign-born population - New Zealand (%)
Place of birth for the foreign-born population - Fiji (%)
Place of birth for the foreign-born population - Micronesia (%)
Place of birth for the foreign-born population - Bahamas (%)
Place of birth for the foreign-born population - Barbados (%)
Place of birth for the foreign-born population - Cuba (%)
Place of birth for the foreign-born population - Dominica (%)
Place of birth for the foreign-born population - Dominican Republic (%)
Place of birth for the foreign-born population - Grenada (%)
Place of birth for the foreign-born population - Haiti (%)
Place of birth for the foreign-born population - Jamaica (%)
Place of birth for the foreign-born population - St. Vincent and the Grenadines (%)
Place of birth for the foreign-born population - Trinidad and Tobago (%)
Place of birth for the foreign-born population - West Indies (%)
Place of birth for the foreign-born population - Other Caribbean (%)
Place of birth for the foreign-born population - Belize (%)
Place of birth for the foreign-born population - Costa Rica (%)
Place of birth for the foreign-born population - El Salvador (%)
Place of birth for the foreign-born population - Guatemala (%)
Place of birth for the foreign-born population - Honduras (%)
Place of birth for the foreign-born population - Mexico (%)
Place of birth for the foreign-born population - Nicaragua (%)
Place of birth for the foreign-born population - Panama (%)
Place of birth for the foreign-born population - Other Central America (%)
Place of birth for the foreign-born population - Argentina (%)
Place of birth for the foreign-born population - Bolivia (%)
Place of birth for the foreign-born population - Brazil (%)
Place of birth for the foreign-born population - Chile (%)
Place of birth for the foreign-born population - Colombia (%)
Place of birth for the foreign-born population - Ecuador (%)
Place of birth for the foreign-born population - Guyana (%)
Place of birth for the foreign-born population - Peru (%)
Place of birth for the foreign-born population - Uruguay (%)
Place of birth for the foreign-born population - Venezuela (%)
Place of birth for the foreign-born population - Other South America (%)
Place of birth for the foreign-born population - Canada (%)
Place of birth for the foreign-born population - Other Northern America (%)
Place of birth for the foreign-born population - Other (%)
Latest news about races in Hendersonville, TN collected exclusively by city-data.com from local newspapers, TV, and radio stations
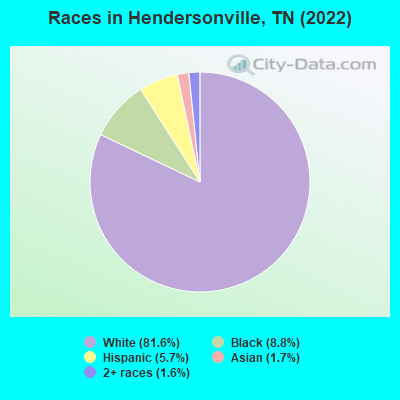
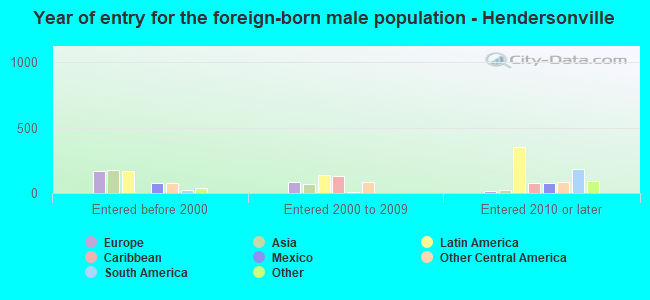
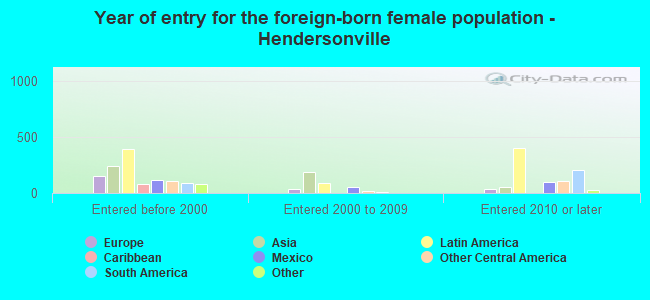
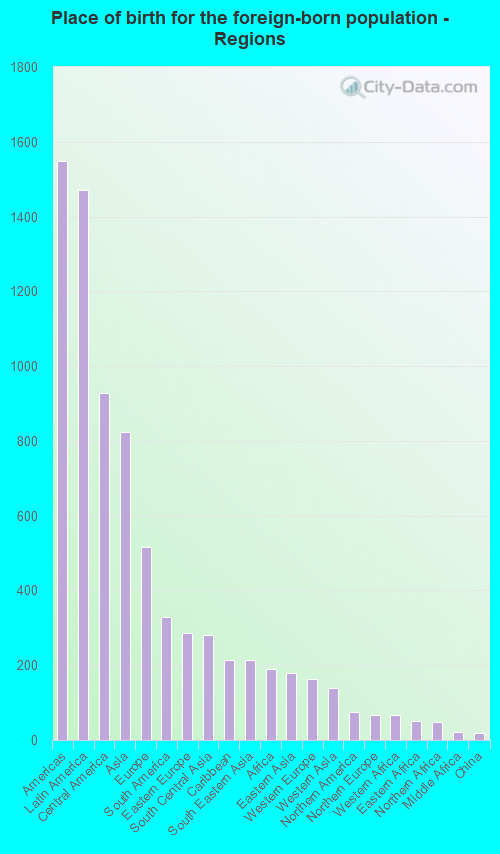
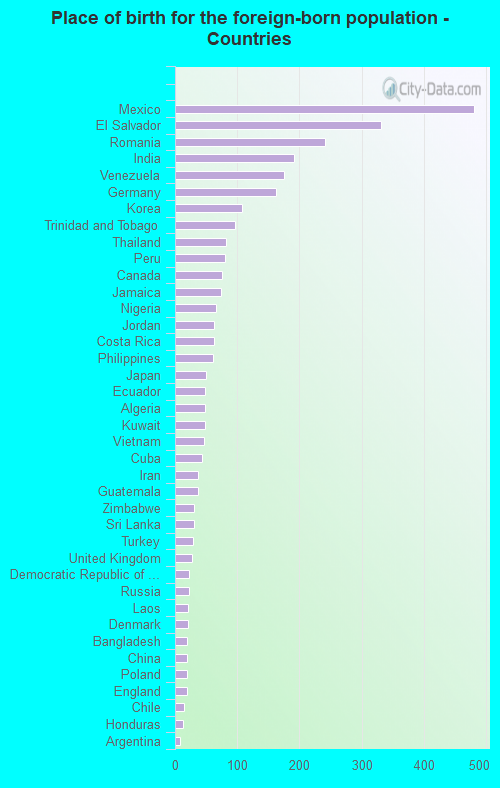
According to 2022 data, the most numerous races in Hendersonville, TN are White alone (52,018 residents), Black alone (5,640 residents), and Hispanic (3,631 residents). 93.0% of Hendersonville residents speak English at home. 4.8% of Hendersonville, TN residents are foreign-born (2.3% born in Latin America, 1.3% born in Asia, 0.8% born in Europe), which is 3.5% less than the foreign-born rate of 5.0% across the entire state of Tennessee.
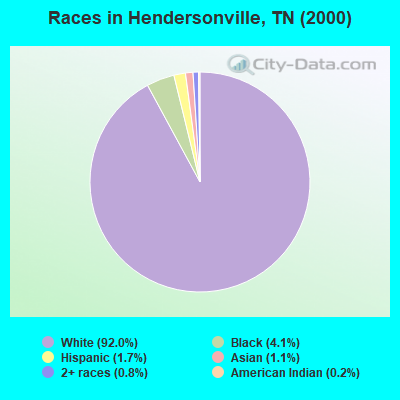
Race distribution in Hendersonville
2000 2022
4,505,930 79.2% White alone 928,204 16.3% Black alone 123,838 2.2% Hispanic 54,824 1.0% Two or more races 56,077 1.0% Asian alone 13,820 0.2% American Indian alone 4,780 0.08% Other race alone 1,810 0.03% Native Hawaiian and Other
5,070,026 71.9% White alone 1,089,738 15.5% Black alone 442,629 6.3% Hispanic 279,381 4.0% Two or more races 131,817 1.9% Asian alone 26,972 0.4% Other race alone 6,387 0.09% American Indian alone 4,389 0.06% Native Hawaiian and Other
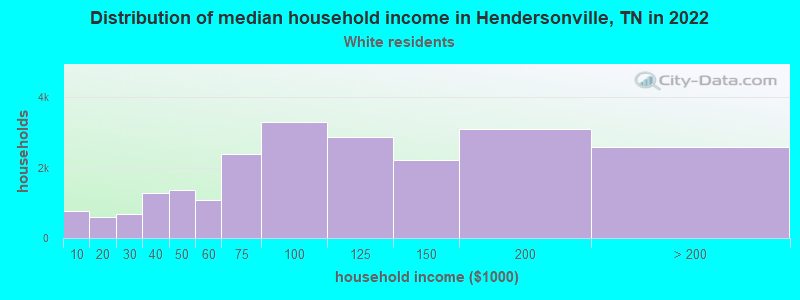
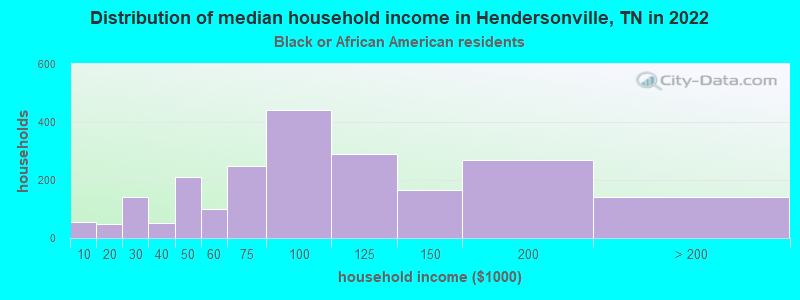
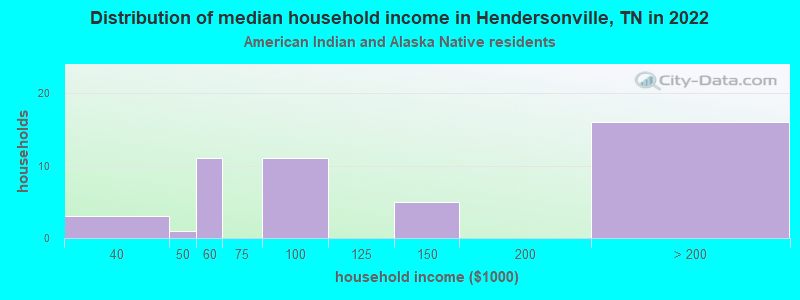
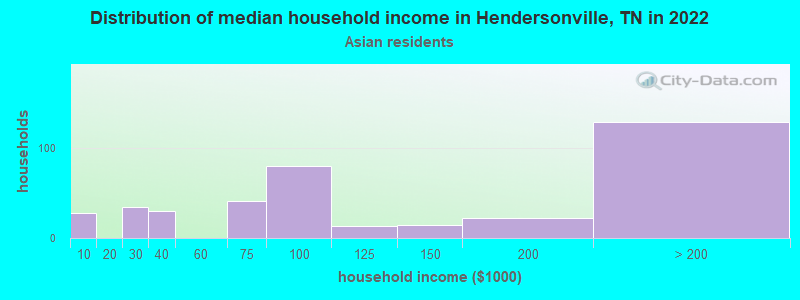
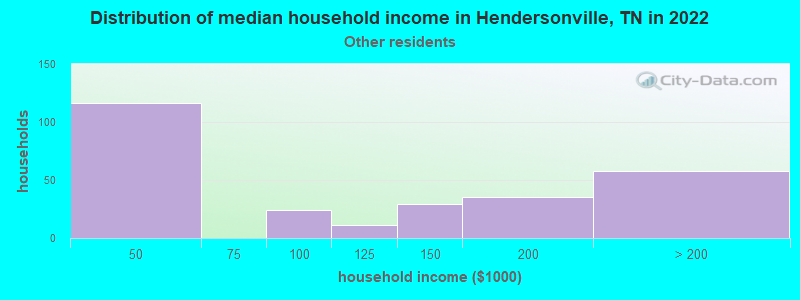
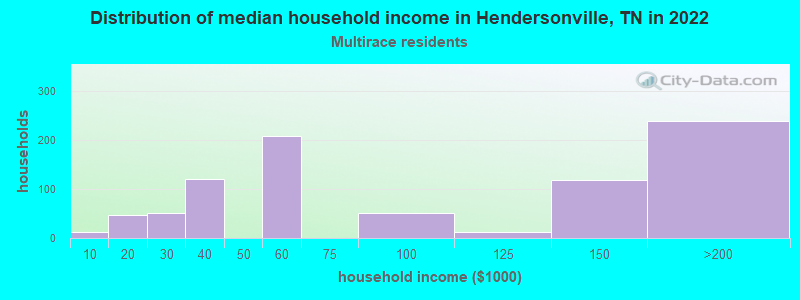
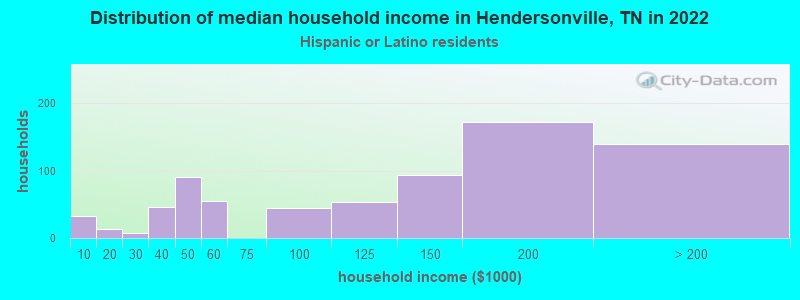
Income and house value in Hendersonville Median household income in 2022 $94,317 White non-Hispanic householders$87,404 Black householders$139,104 Asian householders$164,813 Some other race householders$52,509 Two or more races householders$150,345 Hispanic or Latino race householdersMedian 2022 house value $441,070 White Non-Hispanic householders$493,701 Black or African American householders$363,253 American Indian or Alaska Native householders $473,036 Asian householders$371,325 Some other race householders$355,181 Two or more races householders$453,017 Hispanic or Latino householders
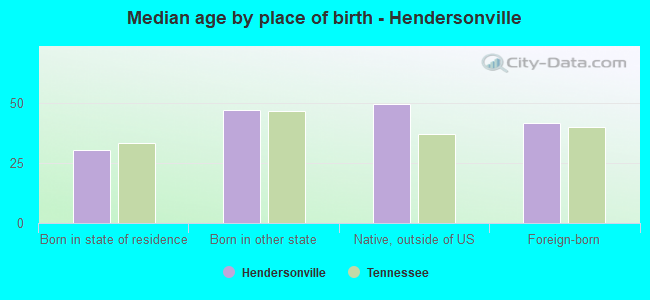
Median age by race in Hendersonville
42.9 Median age for White residents42.5 43.4 34.8 Median age for Black or African American residents31.1 37.3 32.8 Median age for American Indian / Alaska Native residents39.7 51.7 31.5 Median age for Asian residents16.6 35.0 46.5 Median age for Native Hawaiian / Pacific Islander residents-951,707,890.7 12.0 34.2 Median age for Other race residents34.5 30.2 33.6 Median age for Two or more races residents36.3 31.8 43.2 Median age for White alone residents42.4 43.8 29.0 Median age for Hispanic or Latino residents32.2 29.7
Owner/renter occupied households by race in Hendersonville
House owners and renters - White residents 16,506 74.7% Owner occupied5,595 25.3% Renter occupiedHouse owners and renters - Black or African American residents 1,417 59.6% Owner occupied961 40.4% Renter occupiedHouse owners and renters - American Indian / Alaska Native residents 33 84.2% Owner occupied6 15.8% Renter occupiedHouse owners and renters - Asian residents 318 73.8% Owner occupied113 26.2% Renter occupiedHouse owners and renters - Native Hawaiian / Pacific Islander residents 28 100.0% Owner occupiedHouse owners and renters - Other race residents 126 41.3% Owner occupied180 58.7% Renter occupiedHouse owners and renters - Two or more races residents 249 46.8% Owner occupied282 53.2% Renter occupiedHouse owners and renters - White alone residents 16,486 74.8% Owner occupied5,550 25.2% Renter occupiedHouse owners and renters - Hispanic or Latino residents 449 55.4% Owner occupied361 44.6% Renter occupied
Language usage in Hendersonville
English speakers - Total 93.0% of residents of Hendersonville speak English at home.
4.5% of residents speak Spanish at home 2,087 76.8% Speak English very well629 23.2% Speak English less than very well3.3% of residents speak other language at home 1,285 64.7% Speak English very well702 35.3% Speak English less than very well
English speakers - Born in the United States 95.5% of residents of Hendersonville speak English at home.
3.0% of residents speak Spanish at home 812 89.6% Speak English very well94 10.4% Speak English less than very well1.2% of residents speak other language at home 215 59.6% Speak English very well146 40.4% Speak English less than very well
English speakers - Native, born elsewhere 61.5% of residents of Hendersonville speak English at home.
24.0% of residents speak Spanish at home 200 90.9% Speak English very well20 9.1% Speak English less than very well7.1% of residents speak other language at home 65 100.0% Speak English less than very well
English speakers - Foreign-born 26.8% of residents of Hendersonville speak English at home.
37.3% of residents speak Spanish at home 667 62.6% Speak English very well398 37.4% Speak English less than very well50.2% of residents speak other language at home 1,117 77.9% Speak English very well317 22.1% Speak English less than very well
White (Caucasian) - Speak only English Native:
97.8% (47,725)Foreign-born:
38.2% (282)
White (Caucasian) - Speak another language Native:
2.3% (1,116)Foreign-born:
54.3% (401)
Black or African American - Speak only English Native:
99.9% (4,795)Foreign-born:
79.0% (206)
Asian - Speak only English Native:
82.5% (477)Foreign-born:
24.2% (146)
Asian - Speak another language Native:
16.0% (92)Foreign-born:
75.8% (458)
Other race - Speak only English Native:
23.4% (118)Foreign-born:
15.4% (42)
Other race - Speak another language Native:
77.1% (388)Foreign-born:
99.8% (273)
Two or more races - Speak only English Native:
79.9% (1,482)Foreign-born:
1.1% (9)
Two or more races - Speak another language Native:
22.0% (408)Foreign-born:
88.2% (777)
White alone - Speak only English Native:
97.9% (47,564)Foreign-born:
36.7% (258)
White alone - Speak another language Native:
2.4% (1,158)Foreign-born:
58.6% (411)
Hispanic or Latino - Speak only English Native:
57.6% (1,261)Foreign-born:
7.8% (77)
Hispanic or Latino - Speak another language Native:
41.7% (913)Foreign-born:
98.7% (973)
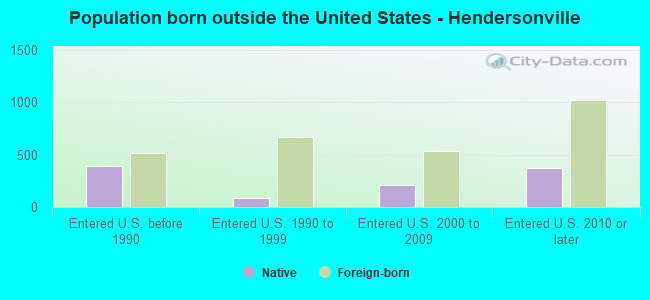
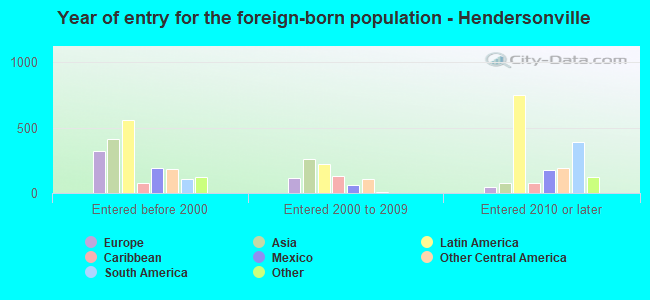
Foreign-born residents in Hendersonville 3,080 residents are foreign born (2.3% Latin America , 1.3% Asia , 0.8% Europe ).
This city:
4.8%Tennessee:
5.4%
Marital status for residents in Hendersonville Marital status - White (Caucasian) population 15 years and over
Males 26.4% Never married57.8% Now married0.8% Separated2.9% Widowed12.0% DivorcedFemales 21.9% Never married54.3% Now married0.9% Separated9.7% Widowed13.2% DivorcedWomen who gave birth in the past 12 months Now married:
80.5% (382)Unmarried:
19.5% (92)
Women who did not give birth in the past 12 months Now married:
51.1% (5,991)Unmarried:
48.9% (5,724)
Marital status - Black or African American population 15 years and over
Males 36.1% Never married53.7% Now married3.4% Separated1.5% Widowed5.4% DivorcedFemales 34.2% Never married40.6% Now married4.0% Separated3.2% Widowed18.0% DivorcedWomen who gave birth in the past 12 months Now married:
0.0% (0)Unmarried:
100.0% (156)
Women who did not give birth in the past 12 months Now married:
43.9% (838)Unmarried:
56.1% (1,069)
Marital status - American Indian / Alaska Native population 15 years and over
Males 0.0% Never married87.5% Now married0.0% Separated0.0% Widowed12.5% DivorcedFemales 0.0% Never married70.6% Now married0.0% Separated29.4% Widowed0.0% DivorcedWomen who gave birth in the past 12 months Now married:
100.0% (7)Unmarried:
0.0% (0)
Marital status - Asian population 15 years and over
Males 27.0% Never married73.0% Now married0.0% Separated0.0% Widowed0.0% DivorcedFemales 27.1% Never married61.4% Now married7.9% Separated2.7% Widowed0.9% DivorcedWomen who did not give birth in the past 12 months Now married:
66.7% (310)Unmarried:
33.3% (154)
Marital status - Native Hawaiian / Pacific Islander population 15 years and over
Males 0.0% Never married0.0% Now married0.0% Separated0.0% Widowed100.0% DivorcedFemales 0.0% Never married100.0% Now married0.0% Separated0.0% Widowed0.0% DivorcedWomen who did not give birth in the past 12 months Now married:
100.0% (11)Unmarried:
0.0% (0)
Marital status - Other race population 15 years and over
Males 2.6% Never married71.9% Now married8.4% Separated0.0% Widowed17.1% DivorcedFemales 31.5% Never married46.5% Now married1.9% Separated7.0% Widowed13.2% DivorcedWomen who gave birth in the past 12 months Now married:
0.0% (0)Unmarried:
100.0% (19)
Women who did not give birth in the past 12 months Now married:
46.8% (149)Unmarried:
53.2% (169)
Marital status - Two or more races population 15 years and over
Males 49.4% Never married49.2% Now married0.0% Separated0.0% Widowed1.4% DivorcedFemales 59.9% Never married33.0% Now married1.5% Separated3.4% Widowed2.2% DivorcedWomen who gave birth in the past 12 months Now married:
68.6% (33)Unmarried:
31.4% (15)
Women who did not give birth in the past 12 months Now married:
23.5% (234)Unmarried:
76.5% (759)
Marital status - White alone, not Hispanic / Latino population 15 years and over
Males 26.3% Never married57.9% Now married0.9% Separated2.9% Widowed12.0% DivorcedFemales 21.5% Never married54.5% Now married0.8% Separated9.8% Widowed13.3% DivorcedWomen who gave birth in the past 12 months Now married:
79.6% (365)Unmarried:
20.4% (93)
Women who did not give birth in the past 12 months Now married:
51.4% (5,971)Unmarried:
48.6% (5,641)
Marital status - Hispanic or Latino population 15 years and over
Males 30.7% Never married59.1% Now married2.9% Separated0.0% Widowed7.3% DivorcedFemales 49.8% Never married42.3% Now married2.2% Separated2.0% Widowed3.7% DivorcedWomen who gave birth in the past 12 months Now married:
43.8% (24)Unmarried:
56.2% (31)
Women who did not give birth in the past 12 months Now married:
39.7% (452)Unmarried:
60.3% (686)
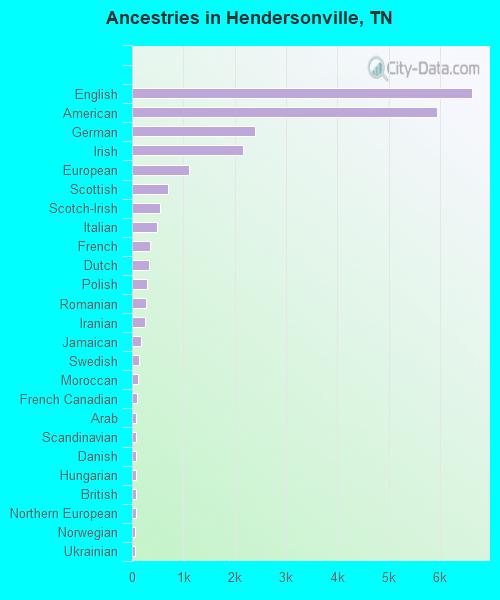
Ancestries in Hendersonville
6,627 21.4% English5,952 19.2% American2,396 7.7% German2,168 7.0% Irish1,120 3.6% European702 2.3% Scottish554 1.8% Scotch-Irish488 1.6% Italian343 1.1% French332 1.1% Dutch289 0.9% Polish264 0.9% Romanian250 0.8% Iranian171 0.6% Jamaican133 0.4% Swedish124 0.4% Moroccan89 0.3% French Canadian86 0.3% Arab86 0.3% Scandinavian85 0.3% Danish80 0.3% Hungarian73 0.2% British71 0.2% Northern European63 0.2% Norwegian63 0.2% Ukrainian58 0.2% African50 0.2% Luxembourger50 0.2% West Indian47 0.2% Turkish39 0.1% Swiss37 0.1% Greek34 0.1% Bahamian33 0.1% Welsh29 0.09% U.S. Virgin Islander27 0.09% Belgian24 0.08% Russian24 0.08% Canadian18 0.06% Eastern European14 0.05% Czechoslovakian11 0.04% Brazilian11 0.04% Austrian10 0.03% Celtic7 0.02% Croatian7 0.02% Lithuanian
Geographical mobility in Hendersonville Same house 1 year ago 44,495 85.7% White (Caucasian)4,945 83.4% Black or African American46 80.1% American Indian / Alaska Native1,017 79.8% Asian59 100.0% Native Hawaiian / Pacific Islander717 73.4% Other race2,648 97.3% Two or more races44,425 86.3% White alone, not Hispanic / Latino2,969 85.4% Hispanic or LatinoMoved within same county 3,085 5.9% White / Caucasian305 5.1% Black or African American140 10.9% Asian70 7.1% Other race104 3.8% Two or more races2,951 5.7% White alone, not Hispanic / Latino155 4.4% Hispanic or LatinoMoved within same state 2,817 5.4% White / Caucasian273 4.6% Black or African American10 17.0% American Indian / Alaska Native27 2.1% Asian201 20.5% Other race33 1.2% Two or more races2,727 5.3% White alone, not Hispanic / Latino342 9.8% Hispanic or LatinoMoved from different state 1,249 2.4% White / Caucasian162 2.7% Black or African American9 16.1% American Indian / Alaska Native20 1.6% Asian55 2.0% Two or more races1,143 2.2% White alone, not Hispanic / Latino68 2.0% Hispanic or LatinoMoved from abroad 96 0.2% White17 1.3% Asian56 0.1% White alone, not Hispanic / Latino29 0.8% Hispanic or Latino
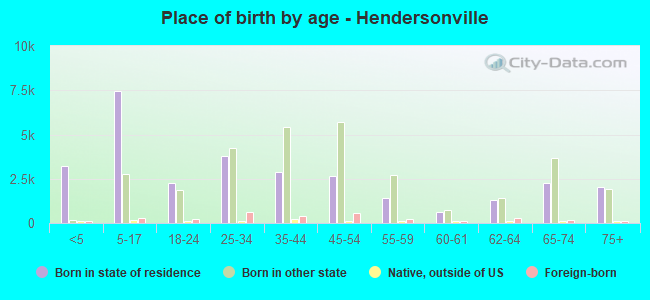
Children Nativity (place of birth) in Hendersonville
Children under 6 years - Living with two parents Both parents native 2,649 100.0% Native1 0.0% Foreign-bornBoth parents foreign-born 137 100.0% NativeOne native, one foreign-born parent 410 100.0% NativeChildren under 6 years - Living with one parent Native parent 678 99.9% Native0 0.1% Foreign-bornForeign-born parent 74 84.1% Native14 15.9% Foreign-bornChildren 6 to 17 years - Living with two parents Both parents native 6,384 99.1% Native59 0.9% Foreign-bornBoth parents foreign-born 257 64.4% Native142 35.6% Foreign-bornOne native, one foreign-born parent 472 100.0% NativeChildren 6 to 17 years - Living with one parent Native parent 1,661 100.0% NativeForeign-born parent 487 54.2% Native412 45.8% Foreign-born
Grandparents responsible for own grandchildren in Hendersonville
Grandparents (30 to 59 years) White / Caucasian 113 77.8% Responsible for grandchildren32 22.2% Not responsible for grandchildrenOther race 107 100.0% Responsible for grandchildrenWhite alone, not Hispanic / Latino 113 77.8% Responsible for grandchildren32 22.2% Not responsible for grandchildrenHispanic or Latino 114 100.0% Responsible for grandchildrenGrandparents (60 years and over) White / Caucasian 147 31.2% Responsible for grandchildren325 68.8% Not responsible for grandchildrenWhite alone, not Hispanic / Latino 147 32.3% Responsible for grandchildren308 67.7% Not responsible for grandchildrenHispanic or Latino 74 100.0% Not responsible for grandchildren