Races in Hayesville, Oregon (OR) Detailed Stats
Data:
Races - White alone (%)
Races - White alone (% change since 2000)
Races - Black alone (%)
Races - Black alone (% change since 2000)
Races - American Indian alone (%)
Races - American Indian alone (% change since 2000)
Races - Asian alone (%)
Races - Asian alone (% change since 2000)
Races - Hispanic (%)
Races - Hispanic (% change since 2000)
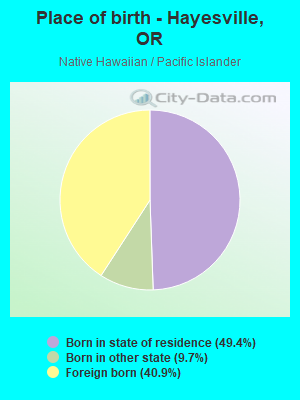
Races - Native Hawaiian and Other Pacific Islander alone (%)
Races - Native Hawaiian and Other Pacific Islander alone (% change since 2000)
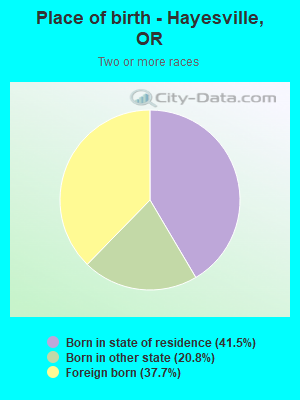
Races - Two or more races(%)
Races - Two or more races(% change since 2000)
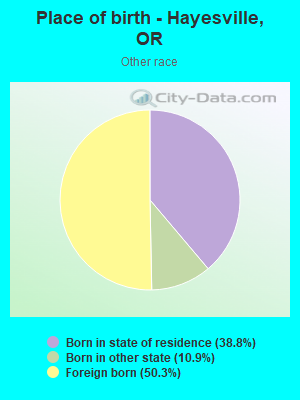
Races - Other race alone (%)
Races - Other race alone (% change since 2000)
Racial diversity
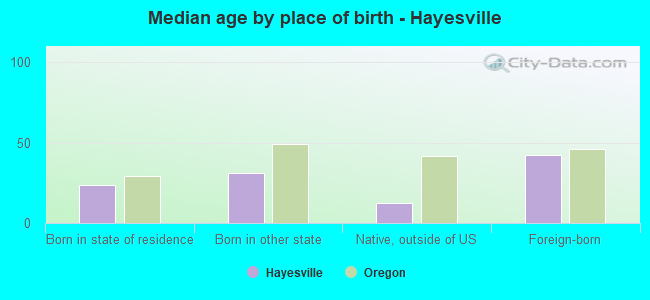
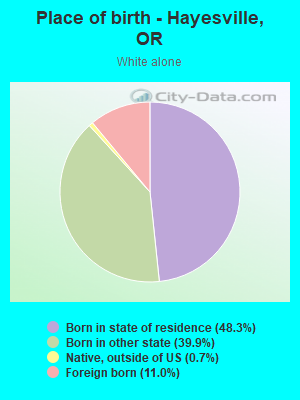
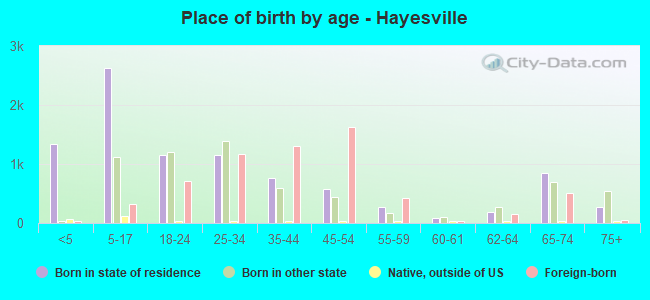
Place of birth - Born in state of residence (%)
Place of birth - Born in state of residence (%) - White
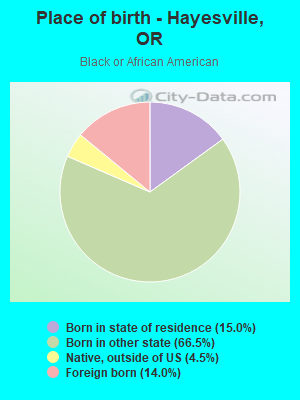
Place of birth - Born in state of residence (%) - Black or African American
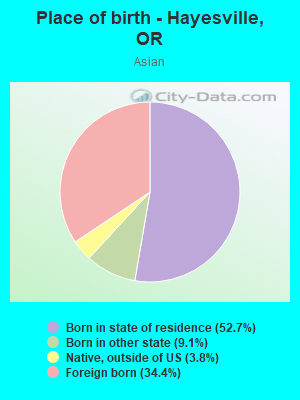
Place of birth - Born in state of residence (%) - Asian
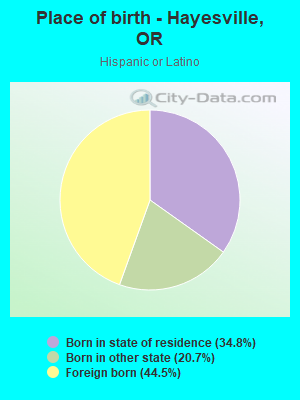
Place of birth - Born in state of residence (%) - Hispanic or Latino
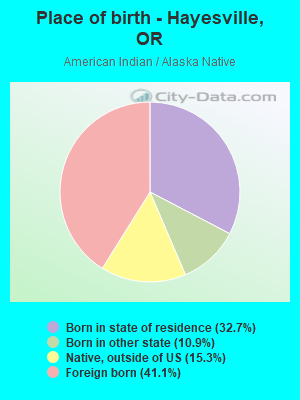
Place of birth - Born in state of residence (%) - American Indian and Alaska Native
Place of birth - Born in state of residence (%) - Multirace
Place of birth - Born in state of residence (%) - Other Race
Place of birth - Born in other state (%)
Place of birth - Born in other state (%) - White
Place of birth - Born in other state (%) - Black or African American
Place of birth - Born in other state (%) - Asian
Place of birth - Born in other state (%) - Hispanic or Latino
Place of birth - Born in other state (%) - American Indian and Alaska Native
Place of birth - Born in other state (%) - Multirace
Place of birth - Born in other state (%) - Other Race
Place of birth - Native, outside of US (%)
Place of birth - Native, outside of US (%) - White
Place of birth - Native, outside of US (%) - Black or African American
Place of birth - Native, outside of US (%) - Asian
Place of birth - Native, outside of US (%) - Hispanic or Latino
Place of birth - Native, outside of US (%) - American Indian and Alaska Native
Place of birth - Native, outside of US (%) - Multirace
Place of birth - Native, outside of US (%) - Other Race
Place of birth - Foreign born (%)
Place of birth - Foreign born (%) - White
Place of birth - Foreign born (%) - Black or African American
Place of birth - Foreign born (%) - Asian
Place of birth - Foreign born (%) - Hispanic or Latino
Place of birth - Foreign born (%) - American Indian and Alaska Native
Place of birth - Foreign born (%) - Multirace
Place of birth - Foreign born (%) - Other Race
Residents speaking English at home (%)
Residents speaking English at home - Born in the United States (%)
Residents speaking English at home - Native, born elsewhere (%)
Residents speaking English at home - Foreign born (%)
Residents speaking Spanish at home (%)
Residents speaking Spanish at home - Born in the United States (%)
Residents speaking Spanish at home - Native, born elsewhere (%)
Residents speaking Spanish at home - Foreign born (%)
Residents speaking other language at home (%)
Residents speaking other language at home - Born in the United States (%)
Residents speaking other language at home - Native, born elsewhere (%)
Residents speaking other language at home - Foreign born (%)
Marital status - Never married (%)
Marital status - Now married (%)
Marital status - Separated (%)
Marital status - Widowed (%)
Marital status - Divorced (%)
Ancestries Reported - Arab (%)
Ancestries Reported - Czech (%)
Ancestries Reported - Danish (%)
Ancestries Reported - Dutch (%)
Ancestries Reported - English (%)
Ancestries Reported - French (%)
Ancestries Reported - French Canadian (%)
Ancestries Reported - German (%)
Ancestries Reported - Greek (%)
Ancestries Reported - Hungarian (%)
Ancestries Reported - Irish (%)
Ancestries Reported - Italian (%)
Ancestries Reported - Lithuanian (%)
Ancestries Reported - Norwegian (%)
Ancestries Reported - Polish (%)
Ancestries Reported - Portuguese (%)
Ancestries Reported - Russian (%)
Ancestries Reported - Scotch-Irish (%)
Ancestries Reported - Scottish (%)
Ancestries Reported - Slovak (%)
Ancestries Reported - Subsaharan African (%)
Ancestries Reported - Swedish (%)
Ancestries Reported - Swiss (%)
Ancestries Reported - Ukrainian (%)
Ancestries Reported - United States (%)
Ancestries Reported - Welsh (%)
Ancestries Reported - West Indian (%)
Ancestries Reported - Other (%)
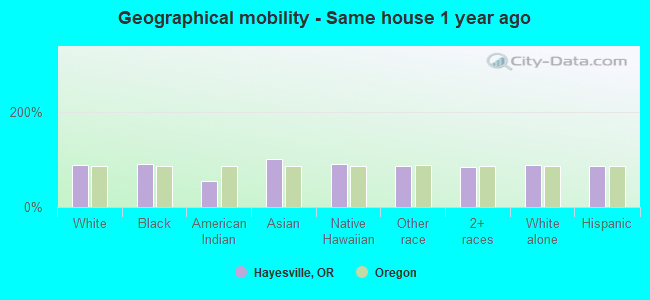
Geographical mobility - Same house 1 year ago (%)
Geographical mobility - Same house 1 year ago (%) - White
Geographical mobility - Same house 1 year ago (%) - Black or African American
Geographical mobility - Same house 1 year ago (%) - Asian
Geographical mobility - Same house 1 year ago (%) - Hispanic or Latino
Geographical mobility - Same house 1 year ago (%) - American Indian and Alaska Native
Geographical mobility - Same house 1 year ago (%) - Multirace
Geographical mobility - Same house 1 year ago (%) - Other Race
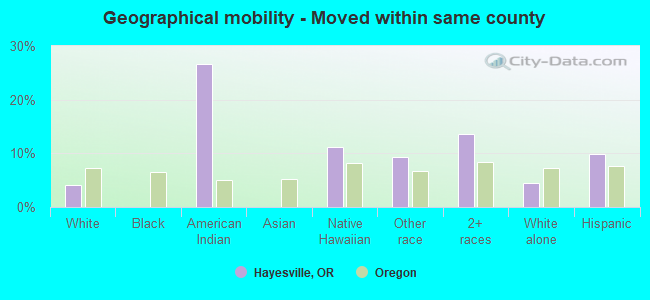
Geographical mobility - Moved within same county (%)
Geographical mobility - Moved within same county (%) - White
Geographical mobility - Moved within same county (%) - Black or African American
Geographical mobility - Moved within same county (%) - Asian
Geographical mobility - Moved within same county (%) - Hispanic or Latino
Geographical mobility - Moved within same county (%) - American Indian and Alaska Native
Geographical mobility - Moved within same county (%) - Multirace
Geographical mobility - Moved within same county (%) - Other Race
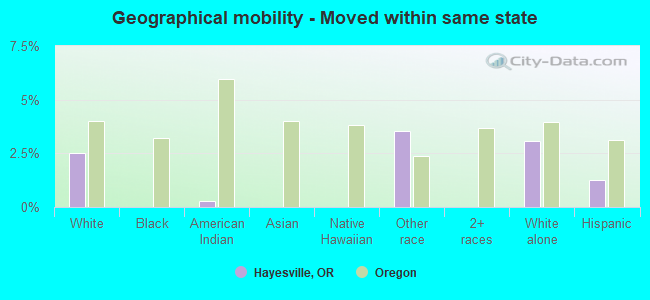
Geographical mobility - Moved from different county within same state (%)
Geographical mobility - Moved from different county within same state (%) - White
Geographical mobility - Moved from different county within same state (%) - Black or African American
Geographical mobility - Moved from different county within same state (%) - Asian
Geographical mobility - Moved from different county within same state (%) - Hispanic or Latino
Geographical mobility - Moved from different county within same state (%) - American Indian and Alaska Native
Geographical mobility - Moved from different county within same state (%) - Multirace
Geographical mobility - Moved from different county within same state (%) - Other Race
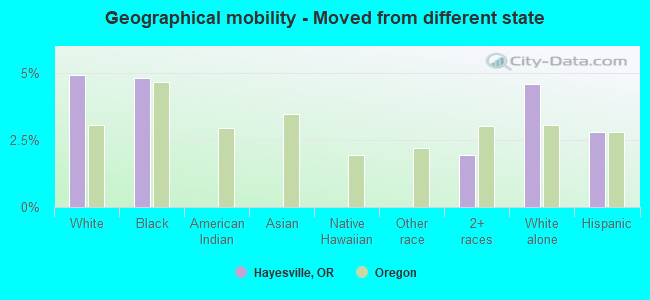
Geographical mobility - Moved from different state (%)
Geographical mobility - Moved from different state (%) - White
Geographical mobility - Moved from different state (%) - Black or African American
Geographical mobility - Moved from different state (%) - Asian
Geographical mobility - Moved from different state (%) - Hispanic or Latino
Geographical mobility - Moved from different state (%) - American Indian and Alaska Native
Geographical mobility - Moved from different state (%) - Multirace
Geographical mobility - Moved from different state (%) - Other Race
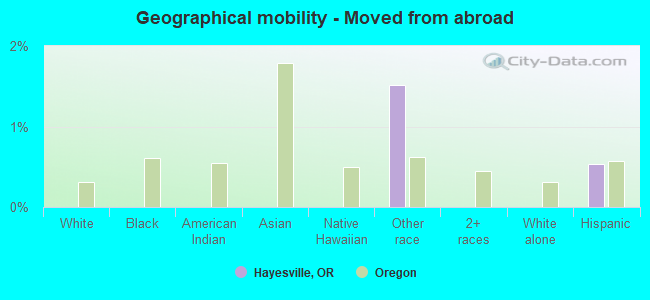
Geographical mobility - Moved from abroad (%)
Geographical mobility - Moved from abroad (%) - White
Geographical mobility - Moved from abroad (%) - Black or African American
Geographical mobility - Moved from abroad (%) - Asian
Geographical mobility - Moved from abroad (%) - Hispanic or Latino
Geographical mobility - Moved from abroad (%) - American Indian and Alaska Native
Geographical mobility - Moved from abroad (%) - Multirace
Geographical mobility - Moved from abroad (%) - Other Race
Place of birth for the foreign-born population - Ireland (%)
Place of birth for the foreign-born population - Denmark (%)
Place of birth for the foreign-born population - Norway (%)
Place of birth for the foreign-born population - Sweden (%)
Place of birth for the foreign-born population - United Kingdom (%)
Place of birth for the foreign-born population - England (%)
Place of birth for the foreign-born population - Scotland (%)
Place of birth for the foreign-born population - Other Northern Europe (%)
Place of birth for the foreign-born population - Austria (%)
Place of birth for the foreign-born population - Belgium (%)
Place of birth for the foreign-born population - France (%)
Place of birth for the foreign-born population - Germany (%)
Place of birth for the foreign-born population - Netherlands (%)
Place of birth for the foreign-born population - Switzerland (%)
Place of birth for the foreign-born population - Other Western Europe (%)
Place of birth for the foreign-born population - Greece (%)
Place of birth for the foreign-born population - Italy (%)
Place of birth for the foreign-born population - Portugal (%)
Place of birth for the foreign-born population - Spain (%)
Place of birth for the foreign-born population - Other Southern Europe (%)
Place of birth for the foreign-born population - Albania (%)
Place of birth for the foreign-born population - Belarus (%)
Place of birth for the foreign-born population - Bosnia and Herzegovina (%)
Place of birth for the foreign-born population - Bulgaria (%)
Place of birth for the foreign-born population - Croatia (%)
Place of birth for the foreign-born population - Czechoslovakia (%)
Place of birth for the foreign-born population - Hungary (%)
Place of birth for the foreign-born population - Latvia (%)
Place of birth for the foreign-born population - Lithuania (%)
Place of birth for the foreign-born population - North Macedonia (Macedonia) (%)
Place of birth for the foreign-born population - Moldova (%)
Place of birth for the foreign-born population - Poland (%)
Place of birth for the foreign-born population - Romania (%)
Place of birth for the foreign-born population - Russia (%)
Place of birth for the foreign-born population - Serbia (%)
Place of birth for the foreign-born population - Ukraine (%)
Place of birth for the foreign-born population - Other Eastern Europe (%)
Place of birth for the foreign-born population - China (%)
Place of birth for the foreign-born population - Hong Kong (%)
Place of birth for the foreign-born population - Taiwan (%)
Place of birth for the foreign-born population - Japan (%)
Place of birth for the foreign-born population - Korea (%)
Place of birth for the foreign-born population - Other Eastern Asia (%)
Place of birth for the foreign-born population - Afghanistan (%)
Place of birth for the foreign-born population - Bangladesh (%)
Place of birth for the foreign-born population - India (%)
Place of birth for the foreign-born population - Iran (%)
Place of birth for the foreign-born population - Kazakhstan (%)
Place of birth for the foreign-born population - Nepal (%)
Place of birth for the foreign-born population - Pakistan (%)
Place of birth for the foreign-born population - Sri Lanka (%)
Place of birth for the foreign-born population - Uzbekistan (%)
Place of birth for the foreign-born population - Other South Central Asia (%)
Place of birth for the foreign-born population - Burma (%)
Place of birth for the foreign-born population - Cambodia (%)
Place of birth for the foreign-born population - Indonesia (%)
Place of birth for the foreign-born population - Laos (%)
Place of birth for the foreign-born population - Malaysia (%)
Place of birth for the foreign-born population - Philippines (%)
Place of birth for the foreign-born population - Singapore (%)
Place of birth for the foreign-born population - Thailand (%)
Place of birth for the foreign-born population - Vietnam (%)
Place of birth for the foreign-born population - Other South Eastern Asia (%)
Place of birth for the foreign-born population - Armenia (%)
Place of birth for the foreign-born population - Iraq (%)
Place of birth for the foreign-born population - Israel (%)
Place of birth for the foreign-born population - Jordan (%)
Place of birth for the foreign-born population - Kuwait (%)
Place of birth for the foreign-born population - Lebanon (%)
Place of birth for the foreign-born population - Saudi Arabia (%)
Place of birth for the foreign-born population - Syria (%)
Place of birth for the foreign-born population - Turkey (%)
Place of birth for the foreign-born population - Yemen (%)
Place of birth for the foreign-born population - Other Western Asia (%)
Place of birth for the foreign-born population - Eritrea (%)
Place of birth for the foreign-born population - Ethiopia (%)
Place of birth for the foreign-born population - Kenya (%)
Place of birth for the foreign-born population - Somalia (%)
Place of birth for the foreign-born population - Uganda (%)
Place of birth for the foreign-born population - Zimbabwe (%)
Place of birth for the foreign-born population - Other Eastern Africa (%)
Place of birth for the foreign-born population - Cameroon (%)
Place of birth for the foreign-born population - Congo (%)
Place of birth for the foreign-born population - Democratic Republic of Congo (Zaire) (%)
Place of birth for the foreign-born population - Other Middle Africa (%)
Place of birth for the foreign-born population - Egypt (%)
Place of birth for the foreign-born population - Morocco (%)
Place of birth for the foreign-born population - Sudan (%)
Place of birth for the foreign-born population - Other Northern Africa (%)
Place of birth for the foreign-born population - South Africa (%)
Place of birth for the foreign-born population - Other Southern Africa (%)
Place of birth for the foreign-born population - Cabo Verde (%)
Place of birth for the foreign-born population - Ghana (%)
Place of birth for the foreign-born population - Liberia (%)
Place of birth for the foreign-born population - Nigeria (%)
Place of birth for the foreign-born population - Senegal (%)
Place of birth for the foreign-born population - Sierra Leone (%)
Place of birth for the foreign-born population - Other Western Africa (%)
Place of birth for the foreign-born population - Australia (%)
Place of birth for the foreign-born population - New Zealand (%)
Place of birth for the foreign-born population - Fiji (%)
Place of birth for the foreign-born population - Micronesia (%)
Place of birth for the foreign-born population - Bahamas (%)
Place of birth for the foreign-born population - Barbados (%)
Place of birth for the foreign-born population - Cuba (%)
Place of birth for the foreign-born population - Dominica (%)
Place of birth for the foreign-born population - Dominican Republic (%)
Place of birth for the foreign-born population - Grenada (%)
Place of birth for the foreign-born population - Haiti (%)
Place of birth for the foreign-born population - Jamaica (%)
Place of birth for the foreign-born population - St. Vincent and the Grenadines (%)
Place of birth for the foreign-born population - Trinidad and Tobago (%)
Place of birth for the foreign-born population - West Indies (%)
Place of birth for the foreign-born population - Other Caribbean (%)
Place of birth for the foreign-born population - Belize (%)
Place of birth for the foreign-born population - Costa Rica (%)
Place of birth for the foreign-born population - El Salvador (%)
Place of birth for the foreign-born population - Guatemala (%)
Place of birth for the foreign-born population - Honduras (%)
Place of birth for the foreign-born population - Mexico (%)
Place of birth for the foreign-born population - Nicaragua (%)
Place of birth for the foreign-born population - Panama (%)
Place of birth for the foreign-born population - Other Central America (%)
Place of birth for the foreign-born population - Argentina (%)
Place of birth for the foreign-born population - Bolivia (%)
Place of birth for the foreign-born population - Brazil (%)
Place of birth for the foreign-born population - Chile (%)
Place of birth for the foreign-born population - Colombia (%)
Place of birth for the foreign-born population - Ecuador (%)
Place of birth for the foreign-born population - Guyana (%)
Place of birth for the foreign-born population - Peru (%)
Place of birth for the foreign-born population - Uruguay (%)
Place of birth for the foreign-born population - Venezuela (%)
Place of birth for the foreign-born population - Other South America (%)
Place of birth for the foreign-born population - Canada (%)
Place of birth for the foreign-born population - Other Northern America (%)
Place of birth for the foreign-born population - Other (%)
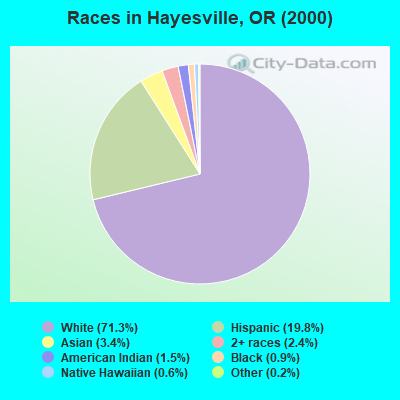
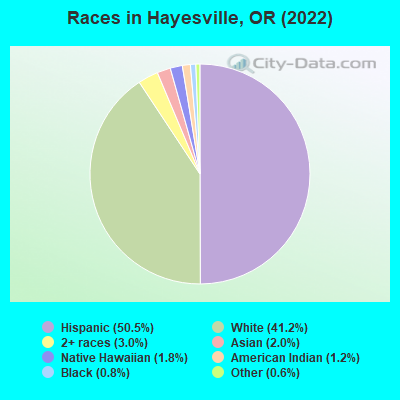
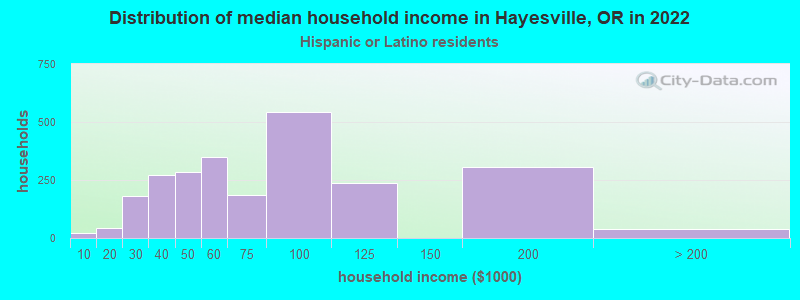
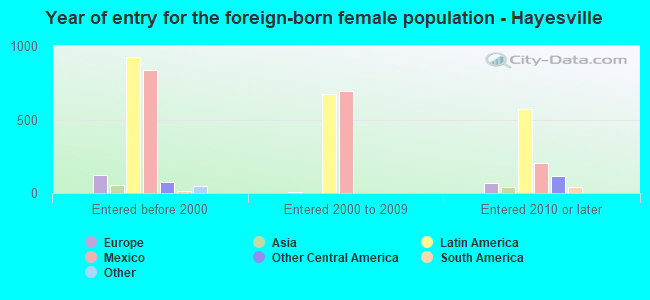
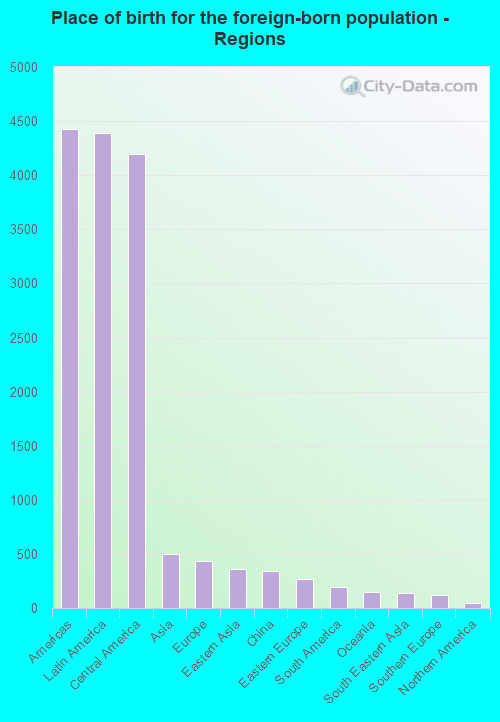
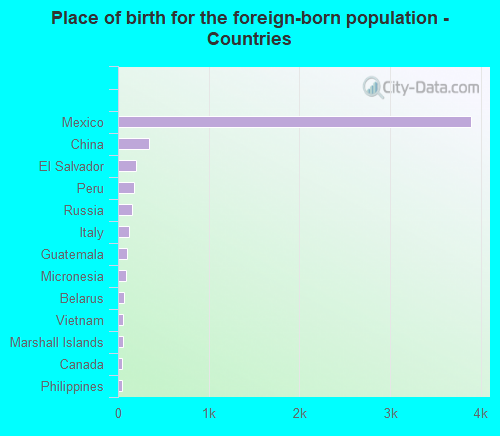
According to 2022 data, the most numerous races in Hayesville, OR are White alone (9,017 residents), Hispanic (11,042 residents), and Two or more races (652 residents). 49.6% of Hayesville residents speak English at home. 25.3% of Hayesville, OR residents are foreign-born (19.7% born in Latin America), which is 64.5% greater than the foreign-born rate of 9.0% across the entire state of Oregon.
Race distribution in Hayesville
2000 2022
2,857,616 83.5% White alone 275,314 8.0% Hispanic 100,333 2.9% Asian alone 82,733 2.4% Two or more races 53,325 1.6% Black alone 40,130 1.2% American Indian alone 7,398 0.2% Native Hawaiian and Other 4,550 0.1% Other race alone
3,037,571 71.6% White alone 609,538 14.4% Hispanic 252,744 6.0% Two or more races 191,283 4.5% Asian alone 78,228 1.8% Black alone 29,399 0.7% American Indian alone 25,731 0.6% Other race alone 15,643 0.4% Native Hawaiian and Other
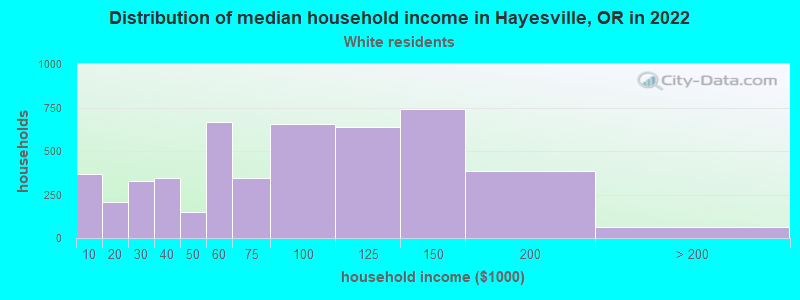
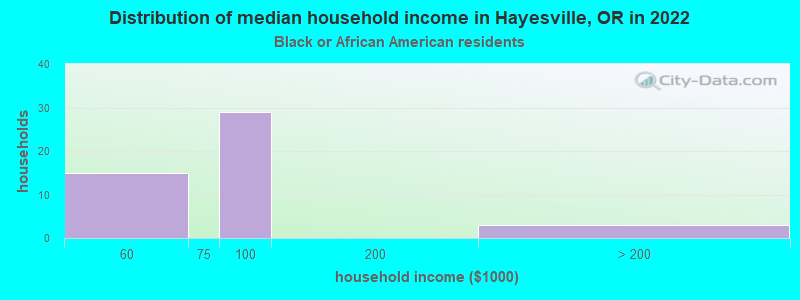
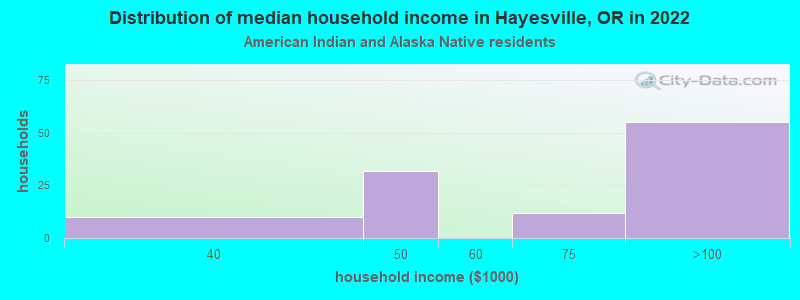
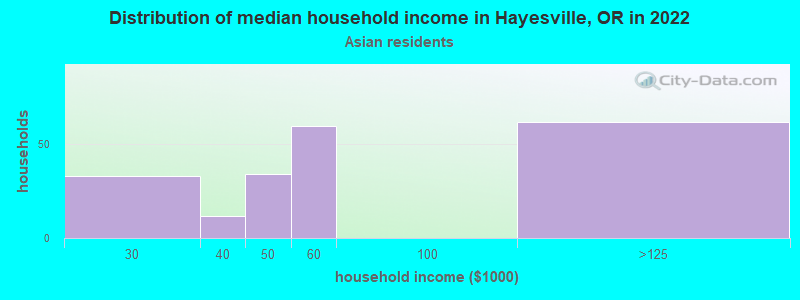
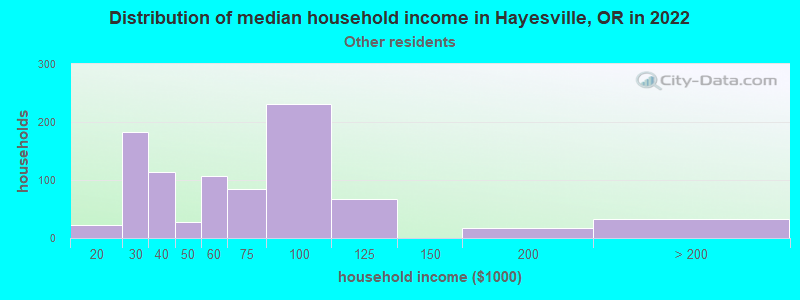
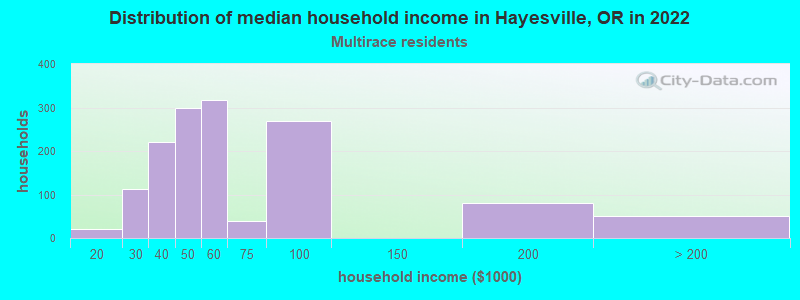
Income and house value in Hayesville Median household income in 2022 $70,287 White non-Hispanic householders$83,878 Black householders$158,496 American Indian and Alaska Native householders$73,104 Asian householders$61,432 Some other race householders$51,688 Two or more races householders$64,820 Hispanic or Latino race householdersMedian 2022 house value $358,202 White Non-Hispanic householders$384,757 Black or African American householders$309,999 American Indian or Alaska Native householders $334,245 Asian householders$340,018 Some other race householders$429,785 Two or more races householders$337,132 Hispanic or Latino householders
Median age by race in Hayesville
37.9 Median age for White residents40.0 37.6 22.1 Median age for Black or African American residents28.9 27.6 15.4 Median age for American Indian / Alaska Native residents26.9 6.6 43.6 Median age for Asian residents48.6 53.6 22.3 Median age for Native Hawaiian / Pacific Islander residents34.8 -866,666,665.8 26.3 Median age for Other race residents26.1 21.5 23.3 Median age for Two or more races residents24.7 23.7 46.4 Median age for White alone residents47.4 45.5 25.4 Median age for Hispanic or Latino residents26.0 23.6
Owner/renter occupied households by race in Hayesville
House owners and renters - White residents 2,986 61.3% Owner occupied1,886 38.7% Renter occupiedHouse owners and renters - Black or African American residents 3 3.0% Owner occupied93 97.0% Renter occupiedHouse owners and renters - American Indian / Alaska Native residents 23 16.1% Owner occupied119 83.9% Renter occupiedHouse owners and renters - Asian residents 105 56.1% Owner occupied82 43.9% Renter occupiedHouse owners and renters - Native Hawaiian / Pacific Islander residents 180 100.0% Renter occupiedHouse owners and renters - Other race residents 282 31.9% Owner occupied601 68.1% Renter occupiedHouse owners and renters - Two or more races residents 403 35.1% Owner occupied744 64.9% Renter occupiedHouse owners and renters - White alone residents 2,946 69.8% Owner occupied1,275 30.2% Renter occupiedHouse owners and renters - Hispanic or Latino residents 629 24.0% Owner occupied1,996 76.0% Renter occupied
Language usage in Hayesville
English speakers - Total 49.6% of residents of Hayesville speak English at home.
43.5% of residents speak Spanish at home 4,291 48.3% Speak English very well4,599 51.7% Speak English less than very well7.8% of residents speak other language at home 928 58.4% Speak English very well660 41.6% Speak English less than very well
English speakers - Born in the United States 73.9% of residents of Hayesville speak English at home.
18.5% of residents speak Spanish at home 875 74.0% Speak English very well308 26.0% Speak English less than very well2.4% of residents speak other language at home 134 87.6% Speak English very well19 12.4% Speak English less than very well
English speakers - Native, born elsewhere 71.4% of residents of Hayesville speak English at home.
10.8% of residents speak Spanish at home 20 100.0% Speak English very well16.2% of residents speak other language at home 30 100.0% Speak English very well
English speakers - Foreign-born 2.6% of residents of Hayesville speak English at home.
78.3% of residents speak Spanish at home 1,171 23.8% Speak English very well3,740 76.2% Speak English less than very well19.5% of residents speak other language at home 522 42.7% Speak English very well701 57.3% Speak English less than very well
White (Caucasian) - Speak only English Native:
84.9% (7,998)Foreign-born:
4.2% (58)
White (Caucasian) - Speak another language Native:
9.7% (914)Foreign-born:
84.3% (1,161)
Black or African American - Speak only English Native:
53.9% (137)Foreign-born:
52.8% (23)
Black or African American - Speak another language Native:
36.7% (93)Foreign-born:
4.9% (2)
American Indian / Alaska Native - Speak another language Native:
24.9% (62)Foreign-born:
100.0% (233)
Asian - Speak only English Native:
85.6% (201)Foreign-born:
39.1% (67)
Asian - Speak another language Native:
58.4% (137)Foreign-born:
68.1% (117)
Native Hawaiian / Pacific Islander - Speak another language Native:
100.0% (227)Foreign-born:
99.5% (191)
Other race - Speak only English Native:
16.6% (320)Foreign-born:
0.8% (17)
Other race - Speak another language Native:
81.5% (1,569)Foreign-born:
99.6% (2,203)
Two or more races - Speak another language Native:
52.5% (1,190)Foreign-born:
100.0% (1,751)
White alone - Speak only English Native:
97.2% (7,662)Foreign-born:
6.9% (69)
White alone - Speak another language Native:
2.5% (200)Foreign-born:
98.0% (978)
Hispanic or Latino - Speak only English Native:
22.3% (1,123)Foreign-born:
0.3% (14)
Hispanic or Latino - Speak another language Native:
76.8% (3,866)Foreign-born:
100.0% (4,978)
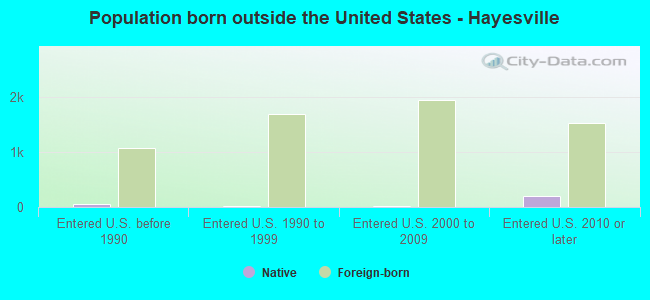
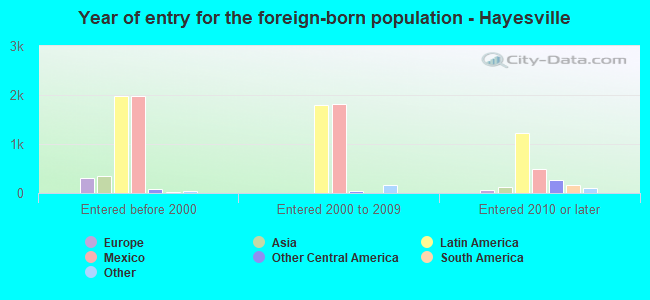
Foreign-born residents in Hayesville 5,543 residents are foreign born (19.7% Latin America ).
This city:
25.3%Oregon:
9.8%
Marital status for residents in Hayesville Marital status - White (Caucasian) population 15 years and over
Males 28.2% Never married47.8% Now married2.3% Separated12.8% Widowed8.9% DivorcedFemales 31.4% Never married40.6% Now married1.1% Separated9.6% Widowed17.2% DivorcedWomen who gave birth in the past 12 months Now married:
70.4% (44)Unmarried:
29.6% (19)
Women who did not give birth in the past 12 months Now married:
32.0% (997)Unmarried:
68.0% (2,117)
Marital status - Black or African American population 15 years and over
Males 78.2% Never married2.4% Now married19.4% Separated0.0% Widowed0.0% DivorcedFemales 82.5% Never married17.5% Now married0.0% Separated0.0% Widowed0.0% DivorcedWomen who did not give birth in the past 12 months Now married:
17.5% (15)Unmarried:
82.5% (70)
Marital status - American Indian / Alaska Native population 15 years and over
Males 91.1% Never married7.4% Now married0.0% Separated0.0% Widowed1.6% DivorcedFemales 66.1% Never married17.9% Now married0.0% Separated0.0% Widowed16.1% DivorcedWomen who did not give birth in the past 12 months Now married:
0.0% (0)Unmarried:
100.0% (40)
Marital status - Asian population 15 years and over
Males 44.6% Never married34.2% Now married0.0% Separated0.0% Widowed21.1% DivorcedFemales 8.3% Never married52.6% Now married5.2% Separated33.3% Widowed0.5% DivorcedWomen who did not give birth in the past 12 months Now married:
83.0% (87)Unmarried:
17.0% (18)
Marital status - Native Hawaiian / Pacific Islander population 15 years and over
Males 21.7% Never married54.2% Now married0.0% Separated0.0% Widowed24.1% DivorcedFemales 100.0% Never married0.0% Now married0.0% Separated0.0% Widowed0.0% DivorcedWomen who did not give birth in the past 12 months Now married:
0.0% (0)Unmarried:
100.0% (48)
Marital status - Other race population 15 years and over
Males 65.1% Never married25.5% Now married1.4% Separated0.6% Widowed7.4% DivorcedFemales 41.3% Never married44.9% Now married0.0% Separated0.0% Widowed13.8% DivorcedWomen who gave birth in the past 12 months Now married:
27.8% (21)Unmarried:
72.2% (54)
Women who did not give birth in the past 12 months Now married:
43.2% (529)Unmarried:
56.8% (696)
Marital status - Two or more races population 15 years and over
Males 60.3% Never married34.7% Now married1.1% Separated0.0% Widowed3.9% DivorcedFemales 51.8% Never married35.9% Now married0.0% Separated0.0% Widowed12.3% DivorcedWomen who gave birth in the past 12 months Now married:
59.6% (69)Unmarried:
40.4% (47)
Women who did not give birth in the past 12 months Now married:
21.7% (162)Unmarried:
78.3% (582)
Marital status - White alone, not Hispanic / Latino population 15 years and over
Males 32.1% Never married44.3% Now married1.5% Separated11.0% Widowed11.1% DivorcedFemales 30.3% Never married40.6% Now married1.6% Separated7.2% Widowed20.2% DivorcedWomen who gave birth in the past 12 months Now married:
77.8% (47)Unmarried:
22.2% (13)
Women who did not give birth in the past 12 months Now married:
28.1% (568)Unmarried:
71.9% (1,449)
Marital status - Hispanic or Latino population 15 years and over
Males 49.7% Never married37.9% Now married2.4% Separated5.6% Widowed4.4% DivorcedFemales 40.0% Never married41.8% Now married0.0% Separated7.6% Widowed10.7% DivorcedWomen who gave birth in the past 12 months Now married:
61.0% (75)Unmarried:
39.0% (48)
Women who did not give birth in the past 12 months Now married:
37.1% (1,070)Unmarried:
62.9% (1,816)
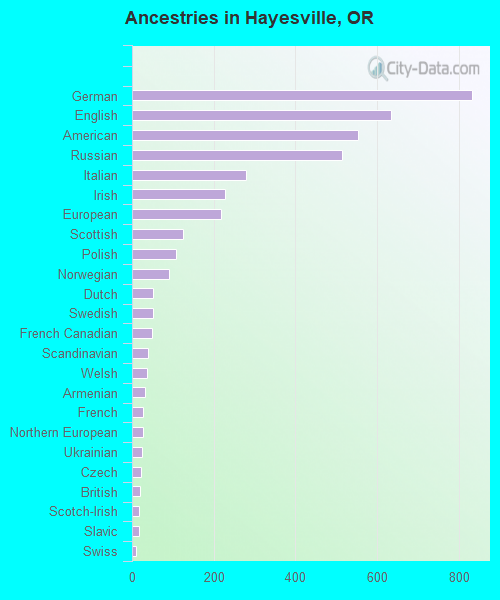
Ancestries in Hayesville
833 6.6% German635 5.0% English554 4.4% American515 4.1% Russian279 2.2% Italian228 1.8% Irish219 1.7% European125 1.0% Scottish107 0.8% Polish91 0.7% Norwegian51 0.4% Dutch51 0.4% Swedish48 0.4% French Canadian39 0.3% Scandinavian37 0.3% Welsh32 0.3% Armenian26 0.2% French26 0.2% Northern European24 0.2% Ukrainian21 0.2% Czech19 0.1% British16 0.1% Scotch-Irish16 0.1% Slavic11 0.09% Swiss3 0.02% Romanian
Geographical mobility in Hayesville Same house 1 year ago 10,348 88.2% White (Caucasian)276 90.4% Black or African American275 53.8% American Indian / Alaska Native520 100.0% Asian342 90.7% Native Hawaiian / Pacific Islander3,732 85.4% Other race3,684 84.3% Two or more races7,863 87.6% White alone, not Hispanic / Latino9,139 84.7% Hispanic or LatinoMoved within same county 487 4.1% White / Caucasian136 26.6% American Indian / Alaska Native42 11.1% Native Hawaiian / Pacific Islander410 9.4% Other race597 13.7% Two or more races408 4.5% White alone, not Hispanic / Latino1,071 9.9% Hispanic or LatinoMoved within same state 297 2.5% White / Caucasian1 0.3% American Indian / Alaska Native156 3.6% Other race277 3.1% White alone, not Hispanic / Latino134 1.2% Hispanic or LatinoMoved from different state 575 4.9% White / Caucasian15 4.8% Black or African American85 2.0% Two or more races410 4.6% White alone, not Hispanic / Latino301 2.8% Hispanic or LatinoMoved from abroad 66 1.5% Other race57 0.5% Hispanic or Latino
Children Nativity (place of birth) in Hayesville
Children under 6 years - Living with two parents Both parents native 485 100.0% NativeBoth parents foreign-born 353 100.0% NativeOne native, one foreign-born parent 40 100.0% NativeChildren under 6 years - Living with one parent Native parent 451 100.0% NativeForeign-born parent 294 100.0% NativeChildren 6 to 17 years - Living with two parents Both parents native 423 70.0% Native181 30.0% Foreign-bornBoth parents foreign-born 732 84.9% Native130 15.1% Foreign-bornOne native, one foreign-born parent 404 100.0% NativeChildren 6 to 17 years - Living with one parent Native parent 805 100.0% NativeForeign-born parent 868 50.0% Native867 50.0% Foreign-born
Grandparents responsible for own grandchildren in Hayesville
Grandparents (30 to 59 years) White / Caucasian 195 44.0% Responsible for grandchildren248 56.0% Not responsible for grandchildrenAmerican Indian / Alaska Native 1 74.4% Responsible for grandchildrenNative Hawaiian / Pacific Islander 21 100.0% Not responsible for grandchildrenOther race 25 100.0% Responsible for grandchildrenWhite alone, not Hispanic / Latino 47 100.0% Not responsible for grandchildrenHispanic or Latino 146 36.2% Responsible for grandchildren257 63.8% Not responsible for grandchildrenGrandparents (60 years and over) White / Caucasian 53 13.6% Responsible for grandchildren335 86.4% Not responsible for grandchildrenAmerican Indian / Alaska Native 2 100.0% Responsible for grandchildrenOther race 44 100.0% Not responsible for grandchildrenWhite alone, not Hispanic / Latino 55 13.1% Responsible for grandchildren369 86.9% Not responsible for grandchildrenHispanic or Latino 95 100.0% Not responsible for grandchildren