Races in Hauppauge, New York (NY) Detailed Stats
Data:
Races - White alone (%)
Races - White alone (% change since 2000)
Races - Black alone (%)
Races - Black alone (% change since 2000)
Races - American Indian alone (%)
Races - American Indian alone (% change since 2000)
Races - Asian alone (%)
Races - Asian alone (% change since 2000)
Races - Hispanic (%)
Races - Hispanic (% change since 2000)
Races - Native Hawaiian and Other Pacific Islander alone (%)
Races - Native Hawaiian and Other Pacific Islander alone (% change since 2000)
Races - Two or more races(%)
Races - Two or more races(% change since 2000)
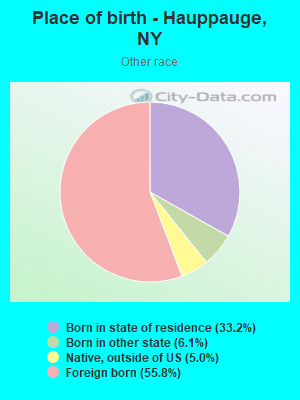
Races - Other race alone (%)
Races - Other race alone (% change since 2000)
Racial diversity
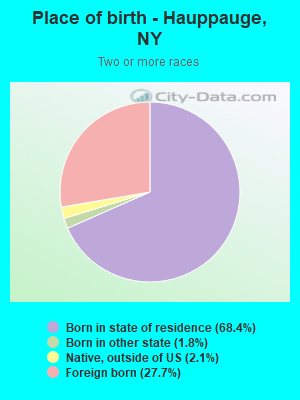
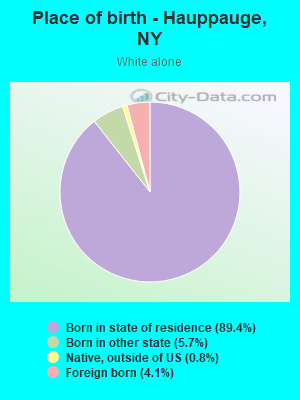
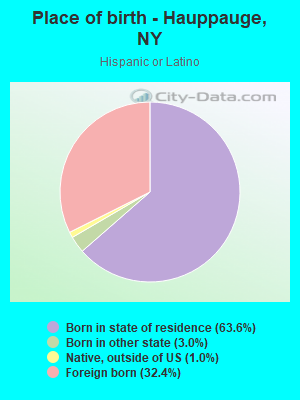
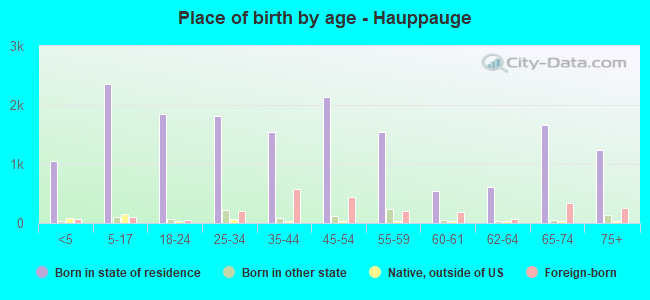
Place of birth - Born in state of residence (%)
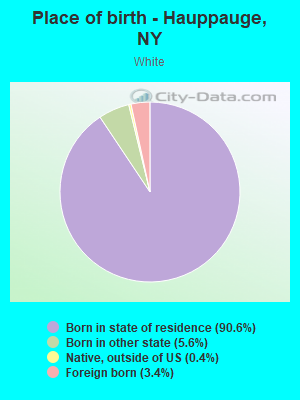
Place of birth - Born in state of residence (%) - White
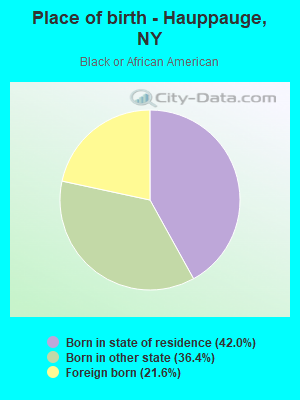
Place of birth - Born in state of residence (%) - Black or African American
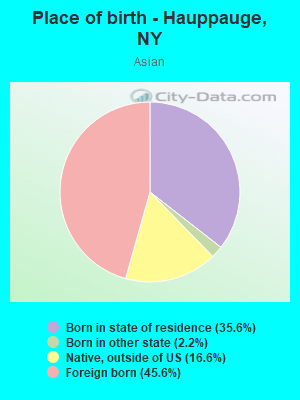
Place of birth - Born in state of residence (%) - Asian
Place of birth - Born in state of residence (%) - Hispanic or Latino
Place of birth - Born in state of residence (%) - American Indian and Alaska Native
Place of birth - Born in state of residence (%) - Multirace
Place of birth - Born in state of residence (%) - Other Race
Place of birth - Born in other state (%)
Place of birth - Born in other state (%) - White
Place of birth - Born in other state (%) - Black or African American
Place of birth - Born in other state (%) - Asian
Place of birth - Born in other state (%) - Hispanic or Latino
Place of birth - Born in other state (%) - American Indian and Alaska Native
Place of birth - Born in other state (%) - Multirace
Place of birth - Born in other state (%) - Other Race
Place of birth - Native, outside of US (%)
Place of birth - Native, outside of US (%) - White
Place of birth - Native, outside of US (%) - Black or African American
Place of birth - Native, outside of US (%) - Asian
Place of birth - Native, outside of US (%) - Hispanic or Latino
Place of birth - Native, outside of US (%) - American Indian and Alaska Native
Place of birth - Native, outside of US (%) - Multirace
Place of birth - Native, outside of US (%) - Other Race
Place of birth - Foreign born (%)
Place of birth - Foreign born (%) - White
Place of birth - Foreign born (%) - Black or African American
Place of birth - Foreign born (%) - Asian
Place of birth - Foreign born (%) - Hispanic or Latino
Place of birth - Foreign born (%) - American Indian and Alaska Native
Place of birth - Foreign born (%) - Multirace
Place of birth - Foreign born (%) - Other Race
Residents speaking English at home (%)
Residents speaking English at home - Born in the United States (%)
Residents speaking English at home - Native, born elsewhere (%)
Residents speaking English at home - Foreign born (%)
Residents speaking Spanish at home (%)
Residents speaking Spanish at home - Born in the United States (%)
Residents speaking Spanish at home - Native, born elsewhere (%)
Residents speaking Spanish at home - Foreign born (%)
Residents speaking other language at home (%)
Residents speaking other language at home - Born in the United States (%)
Residents speaking other language at home - Native, born elsewhere (%)
Residents speaking other language at home - Foreign born (%)
Marital status - Never married (%)
Marital status - Now married (%)
Marital status - Separated (%)
Marital status - Widowed (%)
Marital status - Divorced (%)
Ancestries Reported - Arab (%)
Ancestries Reported - Czech (%)
Ancestries Reported - Danish (%)
Ancestries Reported - Dutch (%)
Ancestries Reported - English (%)
Ancestries Reported - French (%)
Ancestries Reported - French Canadian (%)
Ancestries Reported - German (%)
Ancestries Reported - Greek (%)
Ancestries Reported - Hungarian (%)
Ancestries Reported - Irish (%)
Ancestries Reported - Italian (%)
Ancestries Reported - Lithuanian (%)
Ancestries Reported - Norwegian (%)
Ancestries Reported - Polish (%)
Ancestries Reported - Portuguese (%)
Ancestries Reported - Russian (%)
Ancestries Reported - Scotch-Irish (%)
Ancestries Reported - Scottish (%)
Ancestries Reported - Slovak (%)
Ancestries Reported - Subsaharan African (%)
Ancestries Reported - Swedish (%)
Ancestries Reported - Swiss (%)
Ancestries Reported - Ukrainian (%)
Ancestries Reported - United States (%)
Ancestries Reported - Welsh (%)
Ancestries Reported - West Indian (%)
Ancestries Reported - Other (%)
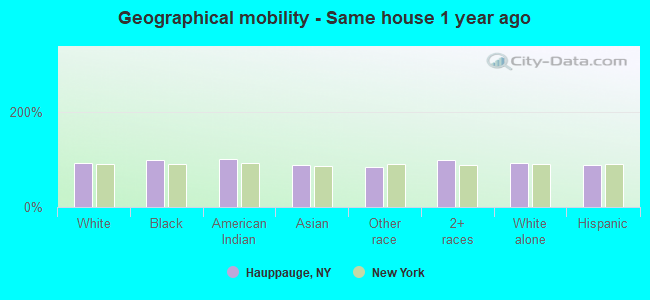
Geographical mobility - Same house 1 year ago (%)
Geographical mobility - Same house 1 year ago (%) - White
Geographical mobility - Same house 1 year ago (%) - Black or African American
Geographical mobility - Same house 1 year ago (%) - Asian
Geographical mobility - Same house 1 year ago (%) - Hispanic or Latino
Geographical mobility - Same house 1 year ago (%) - American Indian and Alaska Native
Geographical mobility - Same house 1 year ago (%) - Multirace
Geographical mobility - Same house 1 year ago (%) - Other Race
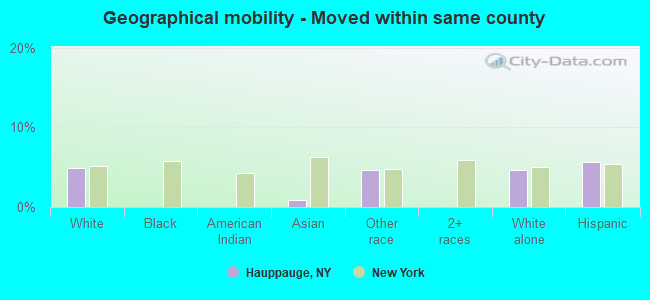
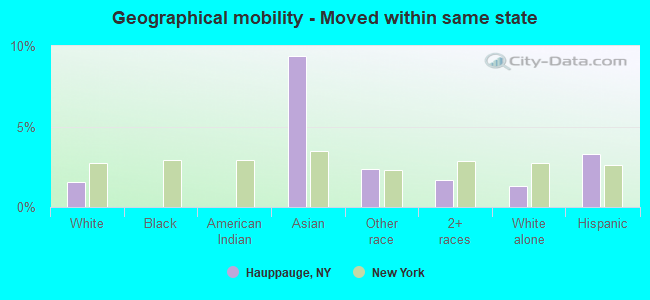
Geographical mobility - Moved within same county (%)
Geographical mobility - Moved within same county (%) - White
Geographical mobility - Moved within same county (%) - Black or African American
Geographical mobility - Moved within same county (%) - Asian
Geographical mobility - Moved within same county (%) - Hispanic or Latino
Geographical mobility - Moved within same county (%) - American Indian and Alaska Native
Geographical mobility - Moved within same county (%) - Multirace
Geographical mobility - Moved within same county (%) - Other Race
Geographical mobility - Moved from different county within same state (%)
Geographical mobility - Moved from different county within same state (%) - White
Geographical mobility - Moved from different county within same state (%) - Black or African American
Geographical mobility - Moved from different county within same state (%) - Asian
Geographical mobility - Moved from different county within same state (%) - Hispanic or Latino
Geographical mobility - Moved from different county within same state (%) - American Indian and Alaska Native
Geographical mobility - Moved from different county within same state (%) - Multirace
Geographical mobility - Moved from different county within same state (%) - Other Race
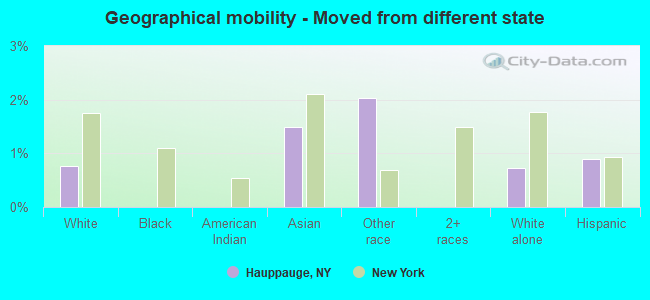
Geographical mobility - Moved from different state (%)
Geographical mobility - Moved from different state (%) - White
Geographical mobility - Moved from different state (%) - Black or African American
Geographical mobility - Moved from different state (%) - Asian
Geographical mobility - Moved from different state (%) - Hispanic or Latino
Geographical mobility - Moved from different state (%) - American Indian and Alaska Native
Geographical mobility - Moved from different state (%) - Multirace
Geographical mobility - Moved from different state (%) - Other Race
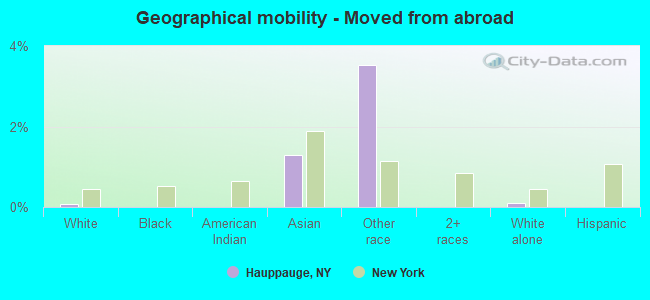
Geographical mobility - Moved from abroad (%)
Geographical mobility - Moved from abroad (%) - White
Geographical mobility - Moved from abroad (%) - Black or African American
Geographical mobility - Moved from abroad (%) - Asian
Geographical mobility - Moved from abroad (%) - Hispanic or Latino
Geographical mobility - Moved from abroad (%) - American Indian and Alaska Native
Geographical mobility - Moved from abroad (%) - Multirace
Geographical mobility - Moved from abroad (%) - Other Race
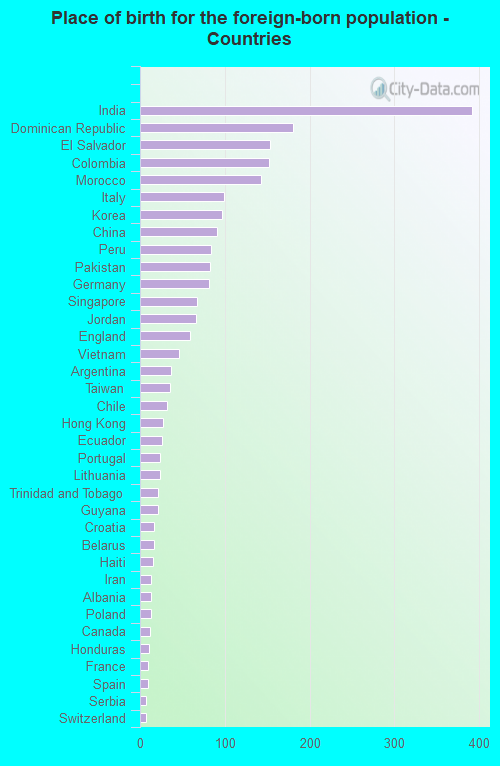
Place of birth for the foreign-born population - Ireland (%)
Place of birth for the foreign-born population - Denmark (%)
Place of birth for the foreign-born population - Norway (%)
Place of birth for the foreign-born population - Sweden (%)
Place of birth for the foreign-born population - United Kingdom (%)
Place of birth for the foreign-born population - England (%)
Place of birth for the foreign-born population - Scotland (%)
Place of birth for the foreign-born population - Other Northern Europe (%)
Place of birth for the foreign-born population - Austria (%)
Place of birth for the foreign-born population - Belgium (%)
Place of birth for the foreign-born population - France (%)
Place of birth for the foreign-born population - Germany (%)
Place of birth for the foreign-born population - Netherlands (%)
Place of birth for the foreign-born population - Switzerland (%)
Place of birth for the foreign-born population - Other Western Europe (%)
Place of birth for the foreign-born population - Greece (%)
Place of birth for the foreign-born population - Italy (%)
Place of birth for the foreign-born population - Portugal (%)
Place of birth for the foreign-born population - Spain (%)
Place of birth for the foreign-born population - Other Southern Europe (%)
Place of birth for the foreign-born population - Albania (%)
Place of birth for the foreign-born population - Belarus (%)
Place of birth for the foreign-born population - Bosnia and Herzegovina (%)
Place of birth for the foreign-born population - Bulgaria (%)
Place of birth for the foreign-born population - Croatia (%)
Place of birth for the foreign-born population - Czechoslovakia (%)
Place of birth for the foreign-born population - Hungary (%)
Place of birth for the foreign-born population - Latvia (%)
Place of birth for the foreign-born population - Lithuania (%)
Place of birth for the foreign-born population - North Macedonia (Macedonia) (%)
Place of birth for the foreign-born population - Moldova (%)
Place of birth for the foreign-born population - Poland (%)
Place of birth for the foreign-born population - Romania (%)
Place of birth for the foreign-born population - Russia (%)
Place of birth for the foreign-born population - Serbia (%)
Place of birth for the foreign-born population - Ukraine (%)
Place of birth for the foreign-born population - Other Eastern Europe (%)
Place of birth for the foreign-born population - China (%)
Place of birth for the foreign-born population - Hong Kong (%)
Place of birth for the foreign-born population - Taiwan (%)
Place of birth for the foreign-born population - Japan (%)
Place of birth for the foreign-born population - Korea (%)
Place of birth for the foreign-born population - Other Eastern Asia (%)
Place of birth for the foreign-born population - Afghanistan (%)
Place of birth for the foreign-born population - Bangladesh (%)
Place of birth for the foreign-born population - India (%)
Place of birth for the foreign-born population - Iran (%)
Place of birth for the foreign-born population - Kazakhstan (%)
Place of birth for the foreign-born population - Nepal (%)
Place of birth for the foreign-born population - Pakistan (%)
Place of birth for the foreign-born population - Sri Lanka (%)
Place of birth for the foreign-born population - Uzbekistan (%)
Place of birth for the foreign-born population - Other South Central Asia (%)
Place of birth for the foreign-born population - Burma (%)
Place of birth for the foreign-born population - Cambodia (%)
Place of birth for the foreign-born population - Indonesia (%)
Place of birth for the foreign-born population - Laos (%)
Place of birth for the foreign-born population - Malaysia (%)
Place of birth for the foreign-born population - Philippines (%)
Place of birth for the foreign-born population - Singapore (%)
Place of birth for the foreign-born population - Thailand (%)
Place of birth for the foreign-born population - Vietnam (%)
Place of birth for the foreign-born population - Other South Eastern Asia (%)
Place of birth for the foreign-born population - Armenia (%)
Place of birth for the foreign-born population - Iraq (%)
Place of birth for the foreign-born population - Israel (%)
Place of birth for the foreign-born population - Jordan (%)
Place of birth for the foreign-born population - Kuwait (%)
Place of birth for the foreign-born population - Lebanon (%)
Place of birth for the foreign-born population - Saudi Arabia (%)
Place of birth for the foreign-born population - Syria (%)
Place of birth for the foreign-born population - Turkey (%)
Place of birth for the foreign-born population - Yemen (%)
Place of birth for the foreign-born population - Other Western Asia (%)
Place of birth for the foreign-born population - Eritrea (%)
Place of birth for the foreign-born population - Ethiopia (%)
Place of birth for the foreign-born population - Kenya (%)
Place of birth for the foreign-born population - Somalia (%)
Place of birth for the foreign-born population - Uganda (%)
Place of birth for the foreign-born population - Zimbabwe (%)
Place of birth for the foreign-born population - Other Eastern Africa (%)
Place of birth for the foreign-born population - Cameroon (%)
Place of birth for the foreign-born population - Congo (%)
Place of birth for the foreign-born population - Democratic Republic of Congo (Zaire) (%)
Place of birth for the foreign-born population - Other Middle Africa (%)
Place of birth for the foreign-born population - Egypt (%)
Place of birth for the foreign-born population - Morocco (%)
Place of birth for the foreign-born population - Sudan (%)
Place of birth for the foreign-born population - Other Northern Africa (%)
Place of birth for the foreign-born population - South Africa (%)
Place of birth for the foreign-born population - Other Southern Africa (%)
Place of birth for the foreign-born population - Cabo Verde (%)
Place of birth for the foreign-born population - Ghana (%)
Place of birth for the foreign-born population - Liberia (%)
Place of birth for the foreign-born population - Nigeria (%)
Place of birth for the foreign-born population - Senegal (%)
Place of birth for the foreign-born population - Sierra Leone (%)
Place of birth for the foreign-born population - Other Western Africa (%)
Place of birth for the foreign-born population - Australia (%)
Place of birth for the foreign-born population - New Zealand (%)
Place of birth for the foreign-born population - Fiji (%)
Place of birth for the foreign-born population - Micronesia (%)
Place of birth for the foreign-born population - Bahamas (%)
Place of birth for the foreign-born population - Barbados (%)
Place of birth for the foreign-born population - Cuba (%)
Place of birth for the foreign-born population - Dominica (%)
Place of birth for the foreign-born population - Dominican Republic (%)
Place of birth for the foreign-born population - Grenada (%)
Place of birth for the foreign-born population - Haiti (%)
Place of birth for the foreign-born population - Jamaica (%)
Place of birth for the foreign-born population - St. Vincent and the Grenadines (%)
Place of birth for the foreign-born population - Trinidad and Tobago (%)
Place of birth for the foreign-born population - West Indies (%)
Place of birth for the foreign-born population - Other Caribbean (%)
Place of birth for the foreign-born population - Belize (%)
Place of birth for the foreign-born population - Costa Rica (%)
Place of birth for the foreign-born population - El Salvador (%)
Place of birth for the foreign-born population - Guatemala (%)
Place of birth for the foreign-born population - Honduras (%)
Place of birth for the foreign-born population - Mexico (%)
Place of birth for the foreign-born population - Nicaragua (%)
Place of birth for the foreign-born population - Panama (%)
Place of birth for the foreign-born population - Other Central America (%)
Place of birth for the foreign-born population - Argentina (%)
Place of birth for the foreign-born population - Bolivia (%)
Place of birth for the foreign-born population - Brazil (%)
Place of birth for the foreign-born population - Chile (%)
Place of birth for the foreign-born population - Colombia (%)
Place of birth for the foreign-born population - Ecuador (%)
Place of birth for the foreign-born population - Guyana (%)
Place of birth for the foreign-born population - Peru (%)
Place of birth for the foreign-born population - Uruguay (%)
Place of birth for the foreign-born population - Venezuela (%)
Place of birth for the foreign-born population - Other South America (%)
Place of birth for the foreign-born population - Canada (%)
Place of birth for the foreign-born population - Other Northern America (%)
Place of birth for the foreign-born population - Other (%)
Latest news about races in Hauppauge, NY collected exclusively by city-data.com from local newspapers, TV, and radio stations
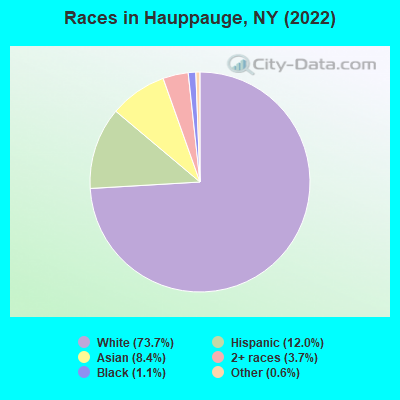
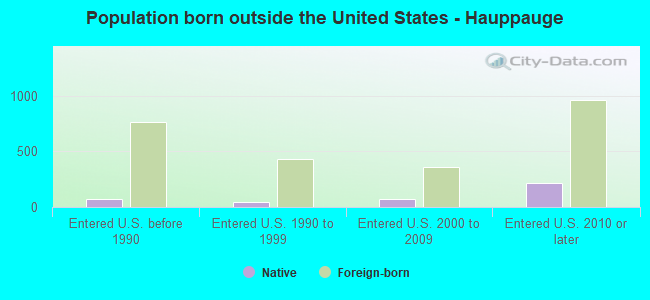
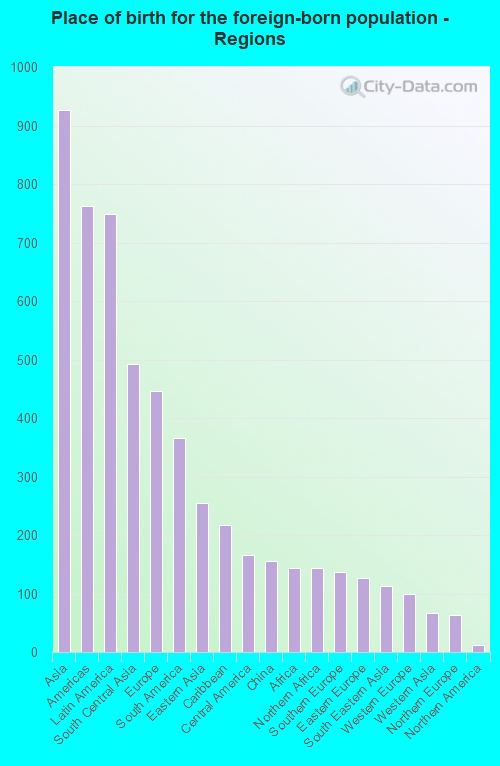
According to 2022 data, the most numerous races in Hauppauge, NY are White alone (15,046 residents), Hispanic (2,447 residents), and Black alone (215 residents). 84.6% of Hauppauge residents speak English at home. 11.2% of Hauppauge, NY residents are foreign-born (4.6% born in Asia, 3.7% born in Latin America, 2.2% born in Europe), which is 97.0% less than the foreign-born rate of 22.0% across the entire state of New York.
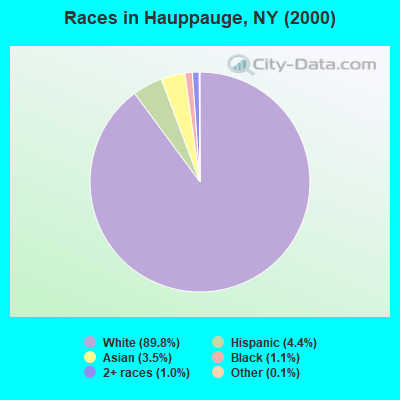
Race distribution in Hauppauge
2000 2022
11,760,981 62.0% White alone 2,867,583 15.1% Hispanic 2,812,623 14.8% Black alone 1,035,926 5.5% Asian alone 366,116 1.9% Two or more races 75,499 0.4% Other race alone 52,499 0.3% American Indian alone 5,230 0.03% Native Hawaiian and Other
10,408,933 52.9% White alone 3,867,299 19.7% Hispanic 2,633,840 13.4% Black alone 1,776,286 9.0% Asian alone 732,670 3.7% Two or more races 216,110 1.1% Other race alone 35,082 0.2% American Indian alone 6,931 0.04% Native Hawaiian and Other
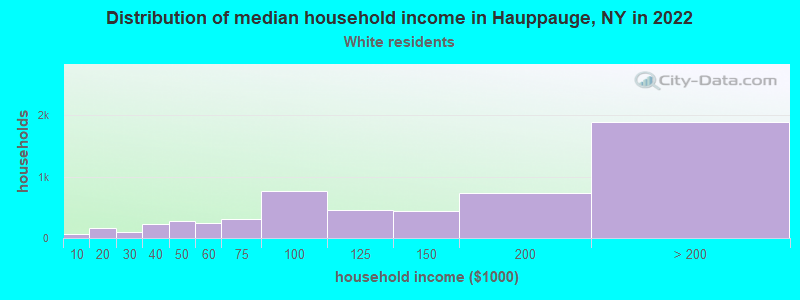
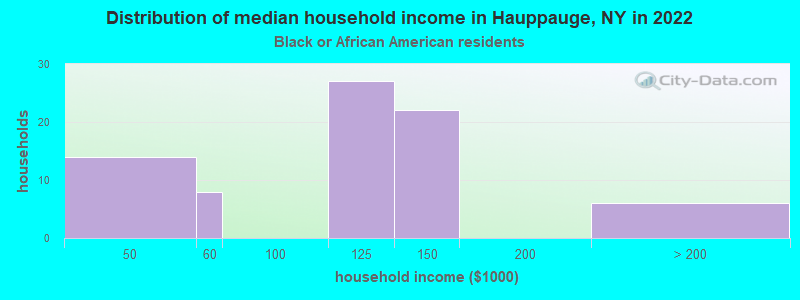
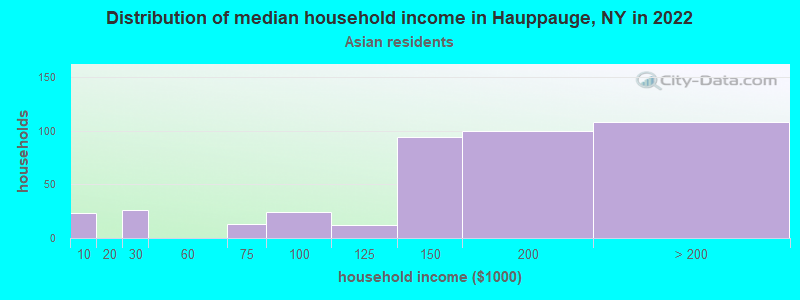
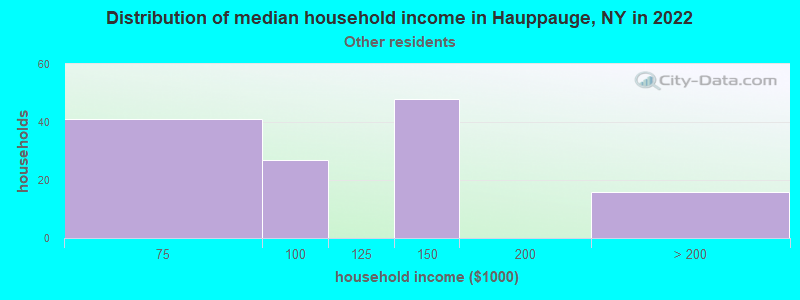
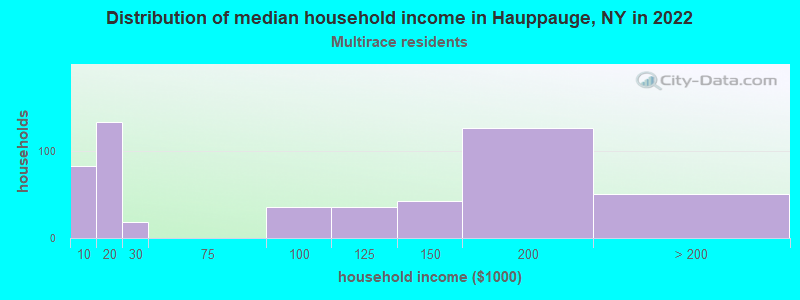
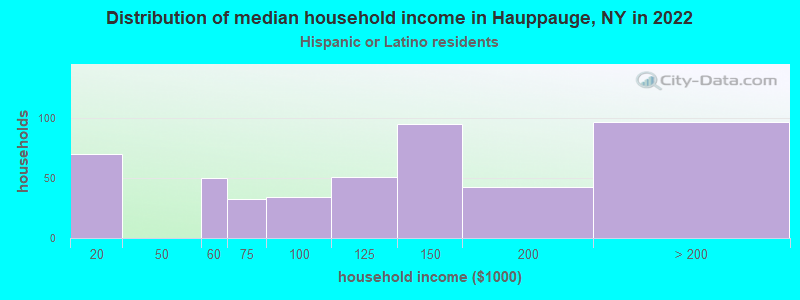
Income and house value in Hauppauge Median household income in 2022 $134,277 White non-Hispanic householders$104,235 Black householders$156,037 Asian householders$136,008 Two or more races householders$124,574 Hispanic or Latino race householdersMedian 2022 house value $688,852 White Non-Hispanic householders$765,082 Black or African American householders $876,923 Asian householders$452,094 Some other race householders$564,213 Two or more races householders$698,589 Hispanic or Latino householders
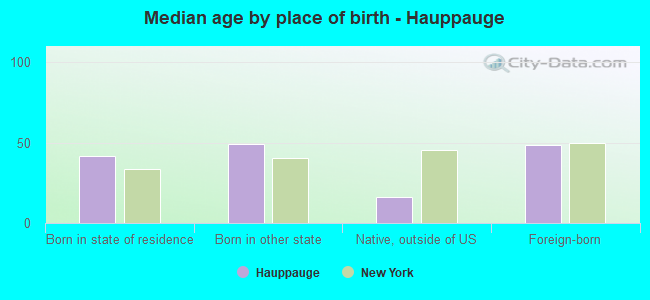
Median age by race in Hauppauge
49.1 Median age for White residents48.1 49.6 37.6 Median age for Black or African American residents34.2 47.6 -748,832,865.7 Median age for American Indian / Alaska Native residents-807,017,543.1 -513,692,161.9 34.6 Median age for Asian residents39.9 18.5 -742,816,091.2 Median age for Native Hawaiian / Pacific Islander residents-831,187,409.8 -771,300,447.7 42.8 Median age for Other race residents41.2 46.0 32.8 Median age for Two or more races residents31.4 36.0 49.0 Median age for White alone residents49.0 49.2 35.6 Median age for Hispanic or Latino residents34.3 36.7
Owner/renter occupied households by race in Hauppauge
House owners and renters - White residents 4,899 86.8% Owner occupied748 13.2% Renter occupiedHouse owners and renters - Black or African American residents 40 53.9% Owner occupied34 46.1% Renter occupiedHouse owners and renters - Asian residents 184 50.4% Owner occupied181 49.6% Renter occupiedHouse owners and renters - Other race residents 100 63.3% Owner occupied58 36.7% Renter occupiedHouse owners and renters - Two or more races residents 358 81.9% Owner occupied79 18.1% Renter occupiedHouse owners and renters - White alone residents 4,897 86.3% Owner occupied781 13.7% Renter occupiedHouse owners and renters - Hispanic or Latino residents 388 83.2% Owner occupied78 16.8% Renter occupied
Language usage in Hauppauge
English speakers - Total 84.6% of residents of Hauppauge speak English at home.
4.6% of residents speak Spanish at home 417 47.3% Speak English very well464 52.7% Speak English less than very well10.2% of residents speak other language at home 1,352 68.7% Speak English very well615 31.3% Speak English less than very well
English speakers - Born in the United States 94.7% of residents of Hauppauge speak English at home.
4.3% of residents speak Spanish at home 47 100.0% Speak English very well1.0% of residents speak other language at home 11 100.0% Speak English very well
English speakers - Native, born elsewhere 80.8% of residents of Hauppauge speak English at home.
7.9% of residents speak Spanish at home 24 100.0% Speak English very well28.5% of residents speak other language at home 86 100.0% Speak English very well
English speakers - Foreign-born 23.4% of residents of Hauppauge speak English at home.
23.0% of residents speak Spanish at home 154 28.1% Speak English very well395 71.9% Speak English less than very well52.2% of residents speak other language at home 727 58.3% Speak English very well520 41.7% Speak English less than very well
White (Caucasian) - Speak only English Native:
98.6% (13,828)Foreign-born:
44.7% (229)
White (Caucasian) - Speak another language Native:
2.4% (331)Foreign-born:
59.9% (307)
Black or African American - Speak only English Native:
85.8% (175)Foreign-born:
74.8% (43)
Black or African American - Speak another language Native:
15.1% (31)Foreign-born:
29.2% (17)
Asian - Speak only English Native:
47.7% (315)Foreign-born:
7.7% (64)
Asian - Speak another language Native:
51.9% (343)Foreign-born:
94.9% (790)
Other race - Speak only English Native:
62.9% (214)Foreign-born:
11.9% (54)
Other race - Speak another language Native:
39.9% (136)Foreign-born:
87.1% (395)
Two or more races - Speak only English Native:
93.3% (1,124)Foreign-born:
39.9% (155)
Two or more races - Speak another language Native:
7.8% (94)Foreign-born:
56.4% (218)
White alone - Speak only English Native:
97.3% (13,504)Foreign-born:
33.5% (206)
White alone - Speak another language Native:
2.6% (365)Foreign-born:
66.5% (410)
Hispanic or Latino - Speak only English Native:
80.7% (1,093)Foreign-born:
21.2% (149)
Hispanic or Latino - Speak another language Native:
21.3% (289)Foreign-born:
77.4% (542)
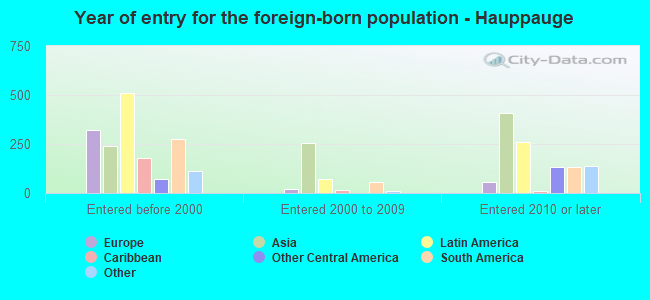
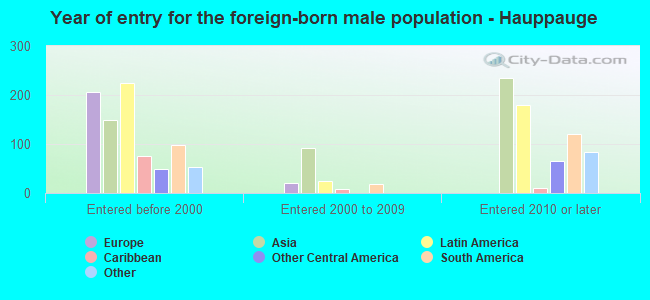
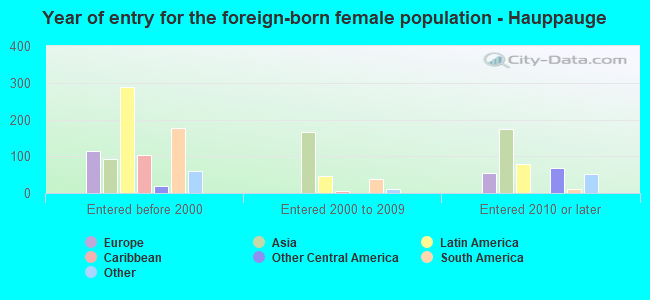
Foreign-born residents in Hauppauge 2,280 residents are foreign born (4.6% Asia , 3.7% Latin America , 2.2% Europe ).
This city:
11.2%New York:
22.6%
Marital status for residents in Hauppauge Marital status - White (Caucasian) population 15 years and over
Males 33.5% Never married58.2% Now married0.5% Separated2.5% Widowed5.3% DivorcedFemales 30.6% Never married53.3% Now married1.2% Separated7.1% Widowed7.8% DivorcedWomen who gave birth in the past 12 months Now married:
90.2% (215)Unmarried:
9.8% (23)
Women who did not give birth in the past 12 months Now married:
36.8% (1,085)Unmarried:
63.2% (1,865)
Marital status - Black or African American population 15 years and over
Males 66.1% Never married29.0% Now married0.0% Separated0.0% Widowed4.8% DivorcedFemales 37.5% Never married58.1% Now married4.4% Separated0.0% Widowed0.0% DivorcedWomen who gave birth in the past 12 months Now married:
0.0% (0)Unmarried:
100.0% (11)
Women who did not give birth in the past 12 months Now married:
78.1% (57)Unmarried:
21.9% (16)
Marital status - Asian population 15 years and over
Males 11.7% Never married85.2% Now married0.0% Separated3.1% Widowed0.0% DivorcedFemales 27.5% Never married65.4% Now married0.0% Separated4.7% Widowed2.5% DivorcedWomen who gave birth in the past 12 months Now married:
100.0% (62)Unmarried:
0.0% (0)
Women who did not give birth in the past 12 months Now married:
61.5% (223)Unmarried:
38.5% (140)
Marital status - Other race population 15 years and over
Males 40.6% Never married54.3% Now married0.0% Separated0.0% Widowed5.0% DivorcedFemales 33.2% Never married41.7% Now married0.0% Separated5.2% Widowed19.9% DivorcedWomen who gave birth in the past 12 months Now married:
0.0% (0)Unmarried:
100.0% (9)
Women who did not give birth in the past 12 months Now married:
33.3% (55)Unmarried:
66.7% (111)
Marital status - Two or more races population 15 years and over
Males 43.2% Never married56.6% Now married0.0% Separated0.2% Widowed0.0% DivorcedFemales 32.1% Never married50.7% Now married0.0% Separated0.2% Widowed17.0% DivorcedWomen who did not give birth in the past 12 months Now married:
35.2% (138)Unmarried:
64.8% (253)
Marital status - White alone, not Hispanic / Latino population 15 years and over
Males 33.0% Never married58.6% Now married0.5% Separated2.7% Widowed5.1% DivorcedFemales 30.4% Never married53.2% Now married1.2% Separated7.2% Widowed8.0% DivorcedWomen who gave birth in the past 12 months Now married:
86.9% (168)Unmarried:
13.1% (25)
Women who did not give birth in the past 12 months Now married:
36.4% (1,092)Unmarried:
63.6% (1,907)
Marital status - Hispanic or Latino population 15 years and over
Males 42.1% Never married53.0% Now married0.0% Separated0.1% Widowed4.8% DivorcedFemales 34.8% Never married49.9% Now married0.0% Separated2.8% Widowed12.4% DivorcedWomen who gave birth in the past 12 months Now married:
92.0% (71)Unmarried:
8.0% (6)
Women who did not give birth in the past 12 months Now married:
36.7% (179)Unmarried:
63.3% (308)
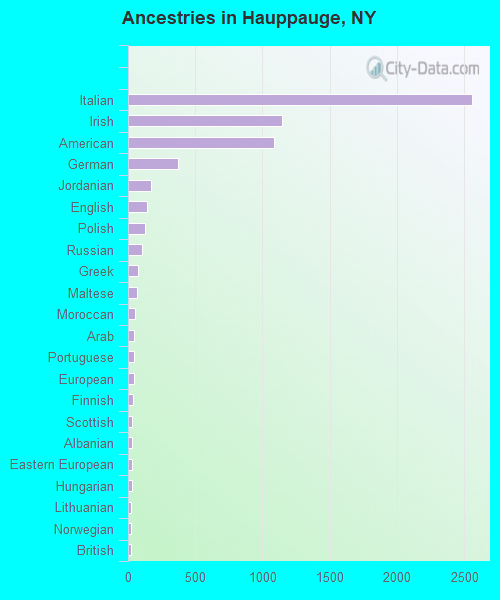
Ancestries in Hauppauge
2,558 29.4% Italian1,144 13.2% Irish1,086 12.5% American372 4.3% German173 2.0% Jordanian142 1.6% English127 1.5% Polish104 1.2% Russian78 0.9% Greek67 0.8% Maltese52 0.6% Moroccan46 0.5% Arab46 0.5% Portuguese43 0.5% European39 0.4% Finnish31 0.4% Scottish30 0.3% Albanian28 0.3% Eastern European27 0.3% Hungarian26 0.3% Lithuanian26 0.3% Norwegian25 0.3% British23 0.3% Soviet Union21 0.2% Ukrainian18 0.2% Iranian17 0.2% Haitian16 0.2% Croatian16 0.2% French12 0.1% Trinidadian and Tobagonian11 0.1% Dutch10 0.1% Swiss9 0.1% Slovak7 0.08% French Canadian5 0.06% Danish5 0.06% Romanian3 0.03% Armenian1 0.01% Afghan
Geographical mobility in Hauppauge Same house 1 year ago 13,779 92.7% White (Caucasian)261 99.2% Black or African American14 100.0% American Indian / Alaska Native1,488 87.8% Asian672 83.8% Other race1,790 99.0% Two or more races13,854 93.1% White alone, not Hispanic / Latino2,105 89.4% Hispanic or LatinoMoved within same county 723 4.9% White / Caucasian14 0.8% Asian37 4.6% Other race699 4.7% White alone, not Hispanic / Latino134 5.7% Hispanic or LatinoMoved within same state 232 1.6% White / Caucasian159 9.4% Asian19 2.4% Other race30 1.7% Two or more races194 1.3% White alone, not Hispanic / Latino77 3.3% Hispanic or LatinoMoved from different state 113 0.8% White / Caucasian25 1.5% Asian16 2.0% Other race109 0.7% White alone, not Hispanic / Latino21 0.9% Hispanic or LatinoMoved from abroad 12 0.1% White22 1.3% Asian28 3.5% Other race15 0.1% White alone, not Hispanic / Latino
Children Nativity (place of birth) in Hauppauge
Children under 6 years - Living with two parents Both parents native 611 100.0% NativeBoth parents foreign-born 179 100.0% NativeOne native, one foreign-born parent 186 61.8% Native115 38.2% Foreign-bornChildren under 6 years - Living with one parent Native parent 167 100.0% NativeForeign-born parent 14 100.0% NativeChildren 6 to 17 years - Living with two parents Both parents native 1,335 99.4% Native8 0.6% Foreign-bornBoth parents foreign-born 286 88.1% Native38 11.9% Foreign-bornOne native, one foreign-born parent 183 89.3% Native22 10.7% Foreign-bornChildren 6 to 17 years - Living with one parent Native parent 534 100.0% NativeForeign-born parent 66 51.5% Native62 48.5% Foreign-born
Grandparents responsible for own grandchildren in Hauppauge
Grandparents (30 to 59 years) White / Caucasian 11 100.0% Responsible for grandchildrenOther race 7 100.0% Not responsible for grandchildrenTwo or more races 69 100.0% Not responsible for grandchildrenWhite alone, not Hispanic / Latino 10 100.0% Responsible for grandchildrenHispanic or Latino 7 100.0% Not responsible for grandchildrenGrandparents (60 years and over) White / Caucasian 31 19.1% Responsible for grandchildren131 80.9% Not responsible for grandchildrenOther race 136 100.0% Not responsible for grandchildrenTwo or more races 19 100.0% Not responsible for grandchildrenWhite alone, not Hispanic / Latino 27 21.0% Responsible for grandchildren100 79.0% Not responsible for grandchildrenHispanic or Latino 7 3.9% Responsible for grandchildren160 96.1% Not responsible for grandchildren