Races in Hancock, Massachusetts (MA) Detailed Stats
Ancestries, Foreign-born residents, place of birth

Recent posts about races in Hancock, Massachusetts on our local forum with over 2,400,000 registered users:
 | Suggestion for Reopening John Hancock Tower Observation Deck (11 replies) |
| People are leaving Massachusetts in droves. Who are they? (334 replies) |
| Quincy to open "migrant" shelter in Wollaston (251 replies) |
| Mass migration: People continue to leave the state (143 replies) |
| Boston crime thread - all posts go here. (2506 replies) |
| High End brothel bust (61 replies) |
Latest news about races in Hancock, MA collected exclusively by city-data.com from local newspapers, TV, and radio stations
1.7% of Hancock, MA residents are foreign-born , which is 981.5% less than the foreign-born rate of 18.0% across the entire state of Massachusetts.
Race distribution in Hancock

- 69596.4%White alone
- 111.5%Two or more races
- 101.4%Hispanic
- 30.4%Asian alone
- 20.3%Black alone

2000
2022
-
- 5,198,35981.9%White alone
- 428,7296.8%Hispanic
- 318,3295.0%Black alone
- 236,7863.7%Asian alone
- 110,3381.7%Two or more races
- 43,5860.7%Other race alone
- 11,2640.2%American Indian alone
- 1,7060.03%Native Hawaiian and Other
Pacific Islander alone

-
- 4,676,62767.0%White alone
- 911,03813.0%Hispanic
- 501,4637.2%Asian alone
- 459,7406.6%Black alone
- 341,8894.9%Two or more races
- 84,4031.2%Other race alone
- 5,8380.08%American Indian alone
- 9760.01%Native Hawaiian and Other
Pacific Islander alone

Income and house value in Hancock
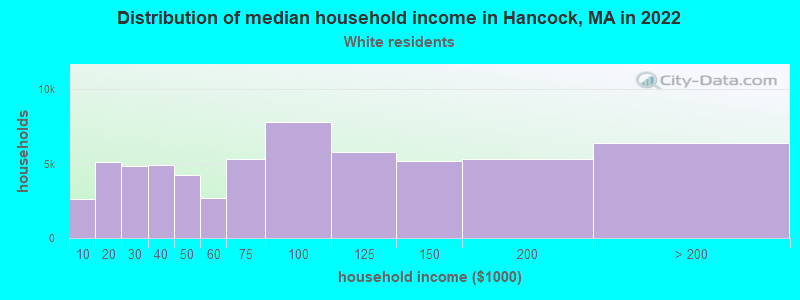
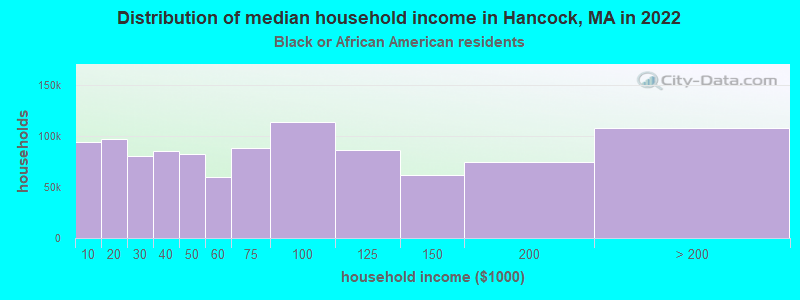
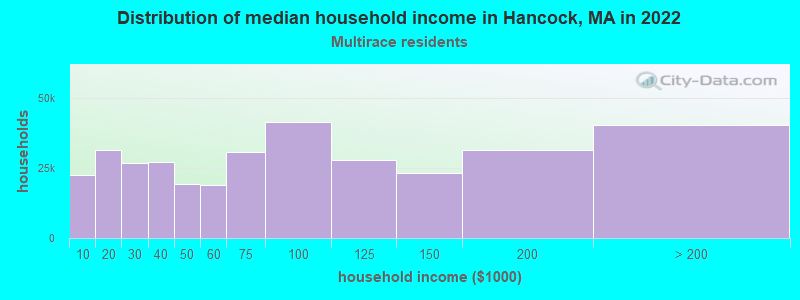
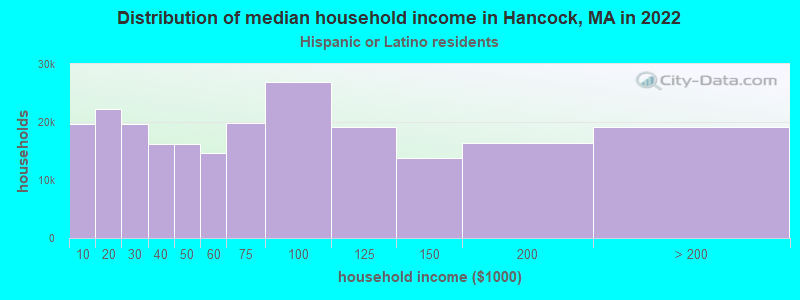
- Median household income in 2022
- $88,334White non-Hispanic householders
- over $200,000Black householders
- over $200,000Two or more races householders
- $35,997Hispanic or Latino race householders
- Median 2022 house value
- $320,903White Non-Hispanic householders
- $434,556Black or African American householders
- $434,556Two or more races householders
Household income for White non-Hispanic householders
Household income for Black householders
Household income for Two or more races householders
Household income for Hispanic or Latino race householders
Foreign-born residents in Hancock
12 residents are foreign born
| This city: | 1.7% |
| Massachusetts: | 12.2% |
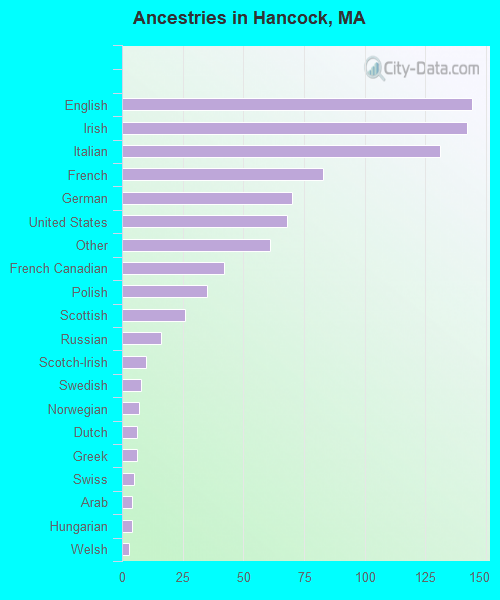
Ancestries in Hancock

- 14416.5%English
- 14216.3%Irish
- 13115.0%Italian
- 839.5%French
- 708.0%German
- 687.8%United States
- 617.0%Other
- 424.8%French Canadian
- 354.0%Polish
- 263.0%Scottish
- 161.8%Russian
- 101.1%Scotch-Irish
- 80.9%Swedish
- 70.8%Norwegian
- 60.7%Dutch
- 60.7%Greek
- 50.6%Swiss
- 40.5%Arab
- 40.5%Hungarian
- 30.3%Welsh
Zip codes: 01237.