Races in Haines City, Florida (FL) Detailed Stats
Data:
Races - White alone (%)
Races - White alone (% change since 2000)
Races - Black alone (%)
Races - Black alone (% change since 2000)
Races - American Indian alone (%)
Races - American Indian alone (% change since 2000)
Races - Asian alone (%)
Races - Asian alone (% change since 2000)
Races - Hispanic (%)
Races - Hispanic (% change since 2000)
Races - Native Hawaiian and Other Pacific Islander alone (%)
Races - Native Hawaiian and Other Pacific Islander alone (% change since 2000)
Races - Two or more races(%)
Races - Two or more races(% change since 2000)
Races - Other race alone (%)
Races - Other race alone (% change since 2000)
Racial diversity
Place of birth - Born in state of residence (%)
Place of birth - Born in state of residence (%) - White
Place of birth - Born in state of residence (%) - Black or African American
Place of birth - Born in state of residence (%) - Asian
Place of birth - Born in state of residence (%) - Hispanic or Latino
Place of birth - Born in state of residence (%) - American Indian and Alaska Native
Place of birth - Born in state of residence (%) - Multirace
Place of birth - Born in state of residence (%) - Other Race
Place of birth - Born in other state (%)
Place of birth - Born in other state (%) - White
Place of birth - Born in other state (%) - Black or African American
Place of birth - Born in other state (%) - Asian
Place of birth - Born in other state (%) - Hispanic or Latino
Place of birth - Born in other state (%) - American Indian and Alaska Native
Place of birth - Born in other state (%) - Multirace
Place of birth - Born in other state (%) - Other Race
Place of birth - Native, outside of US (%)
Place of birth - Native, outside of US (%) - White
Place of birth - Native, outside of US (%) - Black or African American
Place of birth - Native, outside of US (%) - Asian
Place of birth - Native, outside of US (%) - Hispanic or Latino
Place of birth - Native, outside of US (%) - American Indian and Alaska Native
Place of birth - Native, outside of US (%) - Multirace
Place of birth - Native, outside of US (%) - Other Race
Place of birth - Foreign born (%)
Place of birth - Foreign born (%) - White
Place of birth - Foreign born (%) - Black or African American
Place of birth - Foreign born (%) - Asian
Place of birth - Foreign born (%) - Hispanic or Latino
Place of birth - Foreign born (%) - American Indian and Alaska Native
Place of birth - Foreign born (%) - Multirace
Place of birth - Foreign born (%) - Other Race
Residents speaking English at home (%)
Residents speaking English at home - Born in the United States (%)
Residents speaking English at home - Native, born elsewhere (%)
Residents speaking English at home - Foreign born (%)
Residents speaking Spanish at home (%)
Residents speaking Spanish at home - Born in the United States (%)
Residents speaking Spanish at home - Native, born elsewhere (%)
Residents speaking Spanish at home - Foreign born (%)
Residents speaking other language at home (%)
Residents speaking other language at home - Born in the United States (%)
Residents speaking other language at home - Native, born elsewhere (%)
Residents speaking other language at home - Foreign born (%)
Marital status - Never married (%)
Marital status - Now married (%)
Marital status - Separated (%)
Marital status - Widowed (%)
Marital status - Divorced (%)
Ancestries Reported - Arab (%)
Ancestries Reported - Czech (%)
Ancestries Reported - Danish (%)
Ancestries Reported - Dutch (%)
Ancestries Reported - English (%)
Ancestries Reported - French (%)
Ancestries Reported - French Canadian (%)
Ancestries Reported - German (%)
Ancestries Reported - Greek (%)
Ancestries Reported - Hungarian (%)
Ancestries Reported - Irish (%)
Ancestries Reported - Italian (%)
Ancestries Reported - Lithuanian (%)
Ancestries Reported - Norwegian (%)
Ancestries Reported - Polish (%)
Ancestries Reported - Portuguese (%)
Ancestries Reported - Russian (%)
Ancestries Reported - Scotch-Irish (%)
Ancestries Reported - Scottish (%)
Ancestries Reported - Slovak (%)
Ancestries Reported - Subsaharan African (%)
Ancestries Reported - Swedish (%)
Ancestries Reported - Swiss (%)
Ancestries Reported - Ukrainian (%)
Ancestries Reported - United States (%)
Ancestries Reported - Welsh (%)
Ancestries Reported - West Indian (%)
Ancestries Reported - Other (%)
Geographical mobility - Same house 1 year ago (%)
Geographical mobility - Same house 1 year ago (%) - White
Geographical mobility - Same house 1 year ago (%) - Black or African American
Geographical mobility - Same house 1 year ago (%) - Asian
Geographical mobility - Same house 1 year ago (%) - Hispanic or Latino
Geographical mobility - Same house 1 year ago (%) - American Indian and Alaska Native
Geographical mobility - Same house 1 year ago (%) - Multirace
Geographical mobility - Same house 1 year ago (%) - Other Race
Geographical mobility - Moved within same county (%)
Geographical mobility - Moved within same county (%) - White
Geographical mobility - Moved within same county (%) - Black or African American
Geographical mobility - Moved within same county (%) - Asian
Geographical mobility - Moved within same county (%) - Hispanic or Latino
Geographical mobility - Moved within same county (%) - American Indian and Alaska Native
Geographical mobility - Moved within same county (%) - Multirace
Geographical mobility - Moved within same county (%) - Other Race
Geographical mobility - Moved from different county within same state (%)
Geographical mobility - Moved from different county within same state (%) - White
Geographical mobility - Moved from different county within same state (%) - Black or African American
Geographical mobility - Moved from different county within same state (%) - Asian
Geographical mobility - Moved from different county within same state (%) - Hispanic or Latino
Geographical mobility - Moved from different county within same state (%) - American Indian and Alaska Native
Geographical mobility - Moved from different county within same state (%) - Multirace
Geographical mobility - Moved from different county within same state (%) - Other Race
Geographical mobility - Moved from different state (%)
Geographical mobility - Moved from different state (%) - White
Geographical mobility - Moved from different state (%) - Black or African American
Geographical mobility - Moved from different state (%) - Asian
Geographical mobility - Moved from different state (%) - Hispanic or Latino
Geographical mobility - Moved from different state (%) - American Indian and Alaska Native
Geographical mobility - Moved from different state (%) - Multirace
Geographical mobility - Moved from different state (%) - Other Race
Geographical mobility - Moved from abroad (%)
Geographical mobility - Moved from abroad (%) - White
Geographical mobility - Moved from abroad (%) - Black or African American
Geographical mobility - Moved from abroad (%) - Asian
Geographical mobility - Moved from abroad (%) - Hispanic or Latino
Geographical mobility - Moved from abroad (%) - American Indian and Alaska Native
Geographical mobility - Moved from abroad (%) - Multirace
Geographical mobility - Moved from abroad (%) - Other Race
Place of birth for the foreign-born population - Ireland (%)
Place of birth for the foreign-born population - Denmark (%)
Place of birth for the foreign-born population - Norway (%)
Place of birth for the foreign-born population - Sweden (%)
Place of birth for the foreign-born population - United Kingdom (%)
Place of birth for the foreign-born population - England (%)
Place of birth for the foreign-born population - Scotland (%)
Place of birth for the foreign-born population - Other Northern Europe (%)
Place of birth for the foreign-born population - Austria (%)
Place of birth for the foreign-born population - Belgium (%)
Place of birth for the foreign-born population - France (%)
Place of birth for the foreign-born population - Germany (%)
Place of birth for the foreign-born population - Netherlands (%)
Place of birth for the foreign-born population - Switzerland (%)
Place of birth for the foreign-born population - Other Western Europe (%)
Place of birth for the foreign-born population - Greece (%)
Place of birth for the foreign-born population - Italy (%)
Place of birth for the foreign-born population - Portugal (%)
Place of birth for the foreign-born population - Spain (%)
Place of birth for the foreign-born population - Other Southern Europe (%)
Place of birth for the foreign-born population - Albania (%)
Place of birth for the foreign-born population - Belarus (%)
Place of birth for the foreign-born population - Bosnia and Herzegovina (%)
Place of birth for the foreign-born population - Bulgaria (%)
Place of birth for the foreign-born population - Croatia (%)
Place of birth for the foreign-born population - Czechoslovakia (%)
Place of birth for the foreign-born population - Hungary (%)
Place of birth for the foreign-born population - Latvia (%)
Place of birth for the foreign-born population - Lithuania (%)
Place of birth for the foreign-born population - North Macedonia (Macedonia) (%)
Place of birth for the foreign-born population - Moldova (%)
Place of birth for the foreign-born population - Poland (%)
Place of birth for the foreign-born population - Romania (%)
Place of birth for the foreign-born population - Russia (%)
Place of birth for the foreign-born population - Serbia (%)
Place of birth for the foreign-born population - Ukraine (%)
Place of birth for the foreign-born population - Other Eastern Europe (%)
Place of birth for the foreign-born population - China (%)
Place of birth for the foreign-born population - Hong Kong (%)
Place of birth for the foreign-born population - Taiwan (%)
Place of birth for the foreign-born population - Japan (%)
Place of birth for the foreign-born population - Korea (%)
Place of birth for the foreign-born population - Other Eastern Asia (%)
Place of birth for the foreign-born population - Afghanistan (%)
Place of birth for the foreign-born population - Bangladesh (%)
Place of birth for the foreign-born population - India (%)
Place of birth for the foreign-born population - Iran (%)
Place of birth for the foreign-born population - Kazakhstan (%)
Place of birth for the foreign-born population - Nepal (%)
Place of birth for the foreign-born population - Pakistan (%)
Place of birth for the foreign-born population - Sri Lanka (%)
Place of birth for the foreign-born population - Uzbekistan (%)
Place of birth for the foreign-born population - Other South Central Asia (%)
Place of birth for the foreign-born population - Burma (%)
Place of birth for the foreign-born population - Cambodia (%)
Place of birth for the foreign-born population - Indonesia (%)
Place of birth for the foreign-born population - Laos (%)
Place of birth for the foreign-born population - Malaysia (%)
Place of birth for the foreign-born population - Philippines (%)
Place of birth for the foreign-born population - Singapore (%)
Place of birth for the foreign-born population - Thailand (%)
Place of birth for the foreign-born population - Vietnam (%)
Place of birth for the foreign-born population - Other South Eastern Asia (%)
Place of birth for the foreign-born population - Armenia (%)
Place of birth for the foreign-born population - Iraq (%)
Place of birth for the foreign-born population - Israel (%)
Place of birth for the foreign-born population - Jordan (%)
Place of birth for the foreign-born population - Kuwait (%)
Place of birth for the foreign-born population - Lebanon (%)
Place of birth for the foreign-born population - Saudi Arabia (%)
Place of birth for the foreign-born population - Syria (%)
Place of birth for the foreign-born population - Turkey (%)
Place of birth for the foreign-born population - Yemen (%)
Place of birth for the foreign-born population - Other Western Asia (%)
Place of birth for the foreign-born population - Eritrea (%)
Place of birth for the foreign-born population - Ethiopia (%)
Place of birth for the foreign-born population - Kenya (%)
Place of birth for the foreign-born population - Somalia (%)
Place of birth for the foreign-born population - Uganda (%)
Place of birth for the foreign-born population - Zimbabwe (%)
Place of birth for the foreign-born population - Other Eastern Africa (%)
Place of birth for the foreign-born population - Cameroon (%)
Place of birth for the foreign-born population - Congo (%)
Place of birth for the foreign-born population - Democratic Republic of Congo (Zaire) (%)
Place of birth for the foreign-born population - Other Middle Africa (%)
Place of birth for the foreign-born population - Egypt (%)
Place of birth for the foreign-born population - Morocco (%)
Place of birth for the foreign-born population - Sudan (%)
Place of birth for the foreign-born population - Other Northern Africa (%)
Place of birth for the foreign-born population - South Africa (%)
Place of birth for the foreign-born population - Other Southern Africa (%)
Place of birth for the foreign-born population - Cabo Verde (%)
Place of birth for the foreign-born population - Ghana (%)
Place of birth for the foreign-born population - Liberia (%)
Place of birth for the foreign-born population - Nigeria (%)
Place of birth for the foreign-born population - Senegal (%)
Place of birth for the foreign-born population - Sierra Leone (%)
Place of birth for the foreign-born population - Other Western Africa (%)
Place of birth for the foreign-born population - Australia (%)
Place of birth for the foreign-born population - New Zealand (%)
Place of birth for the foreign-born population - Fiji (%)
Place of birth for the foreign-born population - Micronesia (%)
Place of birth for the foreign-born population - Bahamas (%)
Place of birth for the foreign-born population - Barbados (%)
Place of birth for the foreign-born population - Cuba (%)
Place of birth for the foreign-born population - Dominica (%)
Place of birth for the foreign-born population - Dominican Republic (%)
Place of birth for the foreign-born population - Grenada (%)
Place of birth for the foreign-born population - Haiti (%)
Place of birth for the foreign-born population - Jamaica (%)
Place of birth for the foreign-born population - St. Vincent and the Grenadines (%)
Place of birth for the foreign-born population - Trinidad and Tobago (%)
Place of birth for the foreign-born population - West Indies (%)
Place of birth for the foreign-born population - Other Caribbean (%)
Place of birth for the foreign-born population - Belize (%)
Place of birth for the foreign-born population - Costa Rica (%)
Place of birth for the foreign-born population - El Salvador (%)
Place of birth for the foreign-born population - Guatemala (%)
Place of birth for the foreign-born population - Honduras (%)
Place of birth for the foreign-born population - Mexico (%)
Place of birth for the foreign-born population - Nicaragua (%)
Place of birth for the foreign-born population - Panama (%)
Place of birth for the foreign-born population - Other Central America (%)
Place of birth for the foreign-born population - Argentina (%)
Place of birth for the foreign-born population - Bolivia (%)
Place of birth for the foreign-born population - Brazil (%)
Place of birth for the foreign-born population - Chile (%)
Place of birth for the foreign-born population - Colombia (%)
Place of birth for the foreign-born population - Ecuador (%)
Place of birth for the foreign-born population - Guyana (%)
Place of birth for the foreign-born population - Peru (%)
Place of birth for the foreign-born population - Uruguay (%)
Place of birth for the foreign-born population - Venezuela (%)
Place of birth for the foreign-born population - Other South America (%)
Place of birth for the foreign-born population - Canada (%)
Place of birth for the foreign-born population - Other Northern America (%)
Place of birth for the foreign-born population - Other (%)
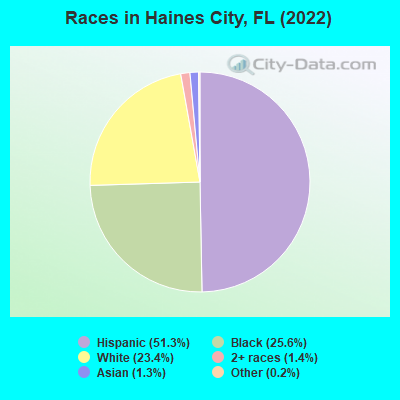
According to 2022 data, the most numerous races in Haines City, FL are White alone (7,232 residents), Hispanic (15,880 residents), and Black alone (7,924 residents). 49.7% of Haines City residents speak English at home. 18.1% of Haines City, FL residents are foreign-born (16.3% born in Latin America), which is 16.1% less than the foreign-born rate of 21.0% across the entire state of Florida.
Race distribution in Haines City
2000 2022
10,458,509 65.4% White alone 2,682,715 16.8% Hispanic 2,264,268 14.2% Black alone 261,693 1.6% Asian alone 236,954 1.5% Two or more races 42,358 0.3% American Indian alone 28,994 0.2% Other race alone 6,887 0.04% Native Hawaiian and Other
11,309,403 50.8% White alone 6,025,039 27.1% Hispanic 3,241,015 14.6% Black alone 861,630 3.9% Two or more races 623,692 2.8% Asian alone 152,054 0.7% Other race alone 22,504 0.1% American Indian alone 9,486 0.04% Native Hawaiian and Other
Income and house value in Haines City Median household income in 2022 $54,112 White non-Hispanic householders$61,576 Black householders$59,745 Some other race householders$57,402 Two or more races householders$57,696 Hispanic or Latino race householdersMedian 2022 house value $319,878 White Non-Hispanic householders$248,048 Black or African American householders$335,898 American Indian or Alaska Native householders $581,363 Asian householders$282,154 Some other race householders$680,582 Two or more races householders$294,040 Hispanic or Latino householders
Median age by race in Haines City
42.7 Median age for White residents41.7 44.2 33.0 Median age for Black or African American residents33.2 37.4 28.0 Median age for American Indian / Alaska Native residents-899,908,171.7 25.8 32.9 Median age for Asian residents51.0 20.1 -679,849,340.2 Median age for Native Hawaiian / Pacific Islander residents-858,307,848.3 -443,298,968.6 31.5 Median age for Other race residents34.3 31.2 31.0 Median age for Two or more races residents31.7 33.1 52.7 Median age for White alone residents45.0 55.3 31.8 Median age for Hispanic or Latino residents34.5 30.9
Owner/renter occupied households by race in Haines City
House owners and renters - White residents 3,526 76.1% Owner occupied1,108 23.9% Renter occupiedHouse owners and renters - Black or African American residents 1,798 70.0% Owner occupied772 30.0% Renter occupiedHouse owners and renters - American Indian / Alaska Native residents 14 75.7% Owner occupied4 24.3% Renter occupiedHouse owners and renters - Asian residents 103 92.5% Owner occupied8 7.5% Renter occupiedHouse owners and renters - Other race residents 1,451 58.6% Owner occupied1,025 41.4% Renter occupiedHouse owners and renters - Two or more races residents 854 64.0% Owner occupied481 36.0% Renter occupiedHouse owners and renters - White alone residents 2,861 81.9% Owner occupied633 18.1% Renter occupiedHouse owners and renters - Hispanic or Latino residents 2,690 59.8% Owner occupied1,809 40.2% Renter occupied
Language usage in Haines City
English speakers - Total 49.7% of residents of Haines City speak English at home.
43.3% of residents speak Spanish at home 7,335 58.4% Speak English very well5,228 41.6% Speak English less than very well10.4% of residents speak other language at home 2,028 67.3% Speak English very well985 32.7% Speak English less than very well
English speakers - Born in the United States 77.8% of residents of Haines City speak English at home.
17.7% of residents speak Spanish at home 1,269 81.7% Speak English very well284 18.3% Speak English less than very well4.0% of residents speak other language at home 355 100.0% Speak English very well
English speakers - Native, born elsewhere 13.4% of residents of Haines City speak English at home.
80.4% of residents speak Spanish at home 2,184 56.4% Speak English very well1,691 43.6% Speak English less than very well10.5% of residents speak other language at home 506 100.0% Speak English very well
English speakers - Foreign-born 11.4% of residents of Haines City speak English at home.
64.0% of residents speak Spanish at home 1,128 27.4% Speak English very well2,992 72.6% Speak English less than very well24.6% of residents speak other language at home 751 47.5% Speak English very well830 52.5% Speak English less than very well
White (Caucasian) - Speak only English Native:
71.8% (6,805)Foreign-born:
25.7% (205)
White (Caucasian) - Speak another language Native:
17.8% (1,685)Foreign-born:
61.5% (490)
Black or African American - Speak only English Native:
80.4% (4,893)Foreign-born:
20.3% (287)
Black or African American - Speak another language Native:
19.3% (1,172)Foreign-born:
82.9% (1,175)
American Indian / Alaska Native - Speak another language Native:
52.5% (10)Foreign-born:
100.0% (21)
Asian - Speak only English Native:
49.9% (76)Foreign-born:
15.0% (48)
Asian - Speak another language Native:
50.8% (78)Foreign-born:
85.9% (273)
Other race - Speak only English Native:
16.7% (995)Foreign-born:
1.4% (35)
Other race - Speak another language Native:
83.7% (4,987)Foreign-born:
98.8% (2,371)
Two or more races - Speak only English Native:
44.7% (1,349)Foreign-born:
8.6% (168)
Two or more races - Speak another language Native:
55.6% (1,678)Foreign-born:
88.1% (1,718)
White alone - Speak only English Native:
96.9% (6,410)Foreign-born:
66.6% (221)
White alone - Speak another language Native:
3.1% (207)Foreign-born:
34.0% (113)
Hispanic or Latino - Speak only English Native:
21.4% (2,256)Foreign-born:
2.2% (94)
Hispanic or Latino - Speak another language Native:
79.0% (8,340)Foreign-born:
97.3% (4,154)
Foreign-born residents in Haines City 5,597 residents are foreign born (16.3% Latin America ).
This city:
18.1%Florida:
21.1%
Marital status for residents in Haines City Marital status - White (Caucasian) population 15 years and over
Males 32.9% Never married51.1% Now married0.4% Separated1.2% Widowed14.4% DivorcedFemales 31.8% Never married41.6% Now married2.5% Separated13.9% Widowed10.3% DivorcedWomen who gave birth in the past 12 months Now married:
92.9% (138)Unmarried:
7.1% (10)
Women who did not give birth in the past 12 months Now married:
39.2% (984)Unmarried:
60.8% (1,524)
Marital status - Black or African American population 15 years and over
Males 50.7% Never married41.2% Now married0.4% Separated2.6% Widowed5.1% DivorcedFemales 49.8% Never married31.2% Now married1.4% Separated5.2% Widowed12.5% DivorcedWomen who gave birth in the past 12 months Now married:
62.8% (54)Unmarried:
37.2% (32)
Women who did not give birth in the past 12 months Now married:
33.9% (673)Unmarried:
66.1% (1,311)
Marital status - American Indian / Alaska Native population 15 years and over
Males 0.0% Never married100.0% Now married0.0% Separated0.0% Widowed0.0% DivorcedFemales 81.8% Never married18.2% Now married0.0% Separated0.0% Widowed0.0% DivorcedWomen who did not give birth in the past 12 months Now married:
25.0% (3)Unmarried:
75.0% (10)
Marital status - Asian population 15 years and over
Males 18.7% Never married81.2% Now married0.0% Separated0.0% Widowed0.0% DivorcedFemales 15.8% Never married84.2% Now married0.0% Separated0.0% Widowed0.0% DivorcedWomen who gave birth in the past 12 months Now married:
100.0% (25)Unmarried:
0.0% (0)
Women who did not give birth in the past 12 months Now married:
80.1% (117)Unmarried:
19.9% (29)
Marital status - Other race population 15 years and over
Males 44.0% Never married41.3% Now married1.3% Separated1.4% Widowed12.0% DivorcedFemales 37.7% Never married46.7% Now married0.7% Separated6.7% Widowed8.2% DivorcedWomen who gave birth in the past 12 months Now married:
100.0% (44)Unmarried:
0.0% (0)
Women who did not give birth in the past 12 months Now married:
48.7% (974)Unmarried:
51.3% (1,027)
Marital status - Two or more races population 15 years and over
Males 50.5% Never married44.1% Now married0.0% Separated0.0% Widowed5.4% DivorcedFemales 18.6% Never married59.9% Now married0.0% Separated1.3% Widowed20.2% DivorcedWomen who gave birth in the past 12 months Now married:
100.0% (20)Unmarried:
0.0% (0)
Women who did not give birth in the past 12 months Now married:
57.5% (534)Unmarried:
42.5% (394)
Marital status - White alone, not Hispanic / Latino population 15 years and over
Males 27.5% Never married53.9% Now married0.7% Separated1.7% Widowed16.2% DivorcedFemales 27.0% Never married43.6% Now married0.5% Separated18.2% Widowed10.7% DivorcedWomen who gave birth in the past 12 months Now married:
100.0% (139)Unmarried:
0.0% (0)
Women who did not give birth in the past 12 months Now married:
34.3% (470)Unmarried:
65.7% (901)
Marital status - Hispanic or Latino population 15 years and over
Males 44.1% Never married43.7% Now married0.8% Separated0.7% Widowed10.7% DivorcedFemales 35.1% Never married45.6% Now married2.7% Separated5.1% Widowed11.5% DivorcedWomen who gave birth in the past 12 months Now married:
82.6% (68)Unmarried:
17.4% (14)
Women who did not give birth in the past 12 months Now married:
47.0% (1,809)Unmarried:
53.0% (2,042)
Ancestries in Haines City
3,077 14.2% American1,913 8.8% Haitian691 3.2% English435 2.0% Jamaican268 1.2% Irish267 1.2% African243 1.1% German237 1.1% Italian164 0.8% U.S. Virgin Islander106 0.5% Polish66 0.3% Cape Verdean65 0.3% West Indian62 0.3% French55 0.3% Ukrainian47 0.2% Canadian43 0.2% Greek28 0.1% Scottish28 0.1% Slovak27 0.1% French Canadian25 0.1% European22 0.1% Swedish20 0.09% Guyanese19 0.09% Romanian16 0.07% Lithuanian15 0.07% Swiss14 0.06% Hungarian12 0.06% British8 0.04% Dutch7 0.03% Finnish5 0.02% Moroccan5 0.02% Scotch-Irish
Geographical mobility in Haines City Same house 1 year ago 9,201 84.4% White (Caucasian)7,185 91.0% Black or African American30 70.1% American Indian / Alaska Native237 50.5% Asian8,169 92.3% Other race3,933 75.8% Two or more races5,868 82.6% White alone, not Hispanic / Latino13,601 85.8% Hispanic or LatinoMoved within same county 689 6.3% White / Caucasian246 3.1% Black or African American103 22.0% Asian268 3.0% Other race863 16.6% Two or more races484 6.8% White alone, not Hispanic / Latino1,104 7.0% Hispanic or LatinoMoved within same state 469 4.3% White / Caucasian121 1.5% Black or African American12 27.6% American Indian / Alaska Native63 13.3% Asian13 0.2% Other race136 2.6% Two or more races314 4.4% White alone, not Hispanic / Latino289 1.8% Hispanic or LatinoMoved from different state 392 3.6% White / Caucasian387 4.9% Black or African American312 3.5% Other race85 1.6% Two or more races353 5.0% White alone, not Hispanic / Latino582 3.7% Hispanic or LatinoMoved from abroad 132 1.2% White49 10.5% Asian197 2.2% Other race59 0.8% White alone, not Hispanic / Latino240 1.5% Hispanic or Latino
Children Nativity (place of birth) in Haines City
Children under 6 years - Living with two parents Both parents native 648 100.0% NativeBoth parents foreign-born 307 80.0% Native77 20.0% Foreign-bornOne native, one foreign-born parent 483 100.0% NativeChildren under 6 years - Living with one parent Native parent 636 100.0% NativeForeign-born parent 117 80.6% Native28 19.4% Foreign-bornChildren 6 to 17 years - Living with two parents Both parents native 1,498 100.0% NativeBoth parents foreign-born 921 79.1% Native243 20.9% Foreign-bornOne native, one foreign-born parent 375 78.2% Native104 21.8% Foreign-bornChildren 6 to 17 years - Living with one parent Native parent 1,272 100.0% NativeForeign-born parent 636 49.4% Native650 50.6% Foreign-born
Grandparents responsible for own grandchildren in Haines City
Grandparents (30 to 59 years) White / Caucasian 38 100.0% Not responsible for grandchildrenBlack or African American 23 32.8% Responsible for grandchildren47 67.2% Not responsible for grandchildrenOther race 61 100.0% Not responsible for grandchildrenTwo or more races 47 100.0% Not responsible for grandchildrenHispanic or Latino 266 100.0% Not responsible for grandchildrenGrandparents (60 years and over) White / Caucasian 46 27.1% Responsible for grandchildren125 72.9% Not responsible for grandchildrenBlack or African American 112 26.4% Responsible for grandchildren313 73.6% Not responsible for grandchildrenOther race 65 100.0% Not responsible for grandchildrenTwo or more races 32 100.0% Not responsible for grandchildrenHispanic or Latino 148 100.0% Not responsible for grandchildren