Races in Grove City, Ohio (OH) Detailed Stats
Data:
Races - White alone (%)
Races - White alone (% change since 2000)
Races - Black alone (%)
Races - Black alone (% change since 2000)
Races - American Indian alone (%)
Races - American Indian alone (% change since 2000)
Races - Asian alone (%)
Races - Asian alone (% change since 2000)
Races - Hispanic (%)
Races - Hispanic (% change since 2000)
Races - Native Hawaiian and Other Pacific Islander alone (%)
Races - Native Hawaiian and Other Pacific Islander alone (% change since 2000)
Races - Two or more races(%)
Races - Two or more races(% change since 2000)
Races - Other race alone (%)
Races - Other race alone (% change since 2000)
Racial diversity
Place of birth - Born in state of residence (%)
Place of birth - Born in state of residence (%) - White
Place of birth - Born in state of residence (%) - Black or African American
Place of birth - Born in state of residence (%) - Asian
Place of birth - Born in state of residence (%) - Hispanic or Latino
Place of birth - Born in state of residence (%) - American Indian and Alaska Native
Place of birth - Born in state of residence (%) - Multirace
Place of birth - Born in state of residence (%) - Other Race
Place of birth - Born in other state (%)
Place of birth - Born in other state (%) - White
Place of birth - Born in other state (%) - Black or African American
Place of birth - Born in other state (%) - Asian
Place of birth - Born in other state (%) - Hispanic or Latino
Place of birth - Born in other state (%) - American Indian and Alaska Native
Place of birth - Born in other state (%) - Multirace
Place of birth - Born in other state (%) - Other Race
Place of birth - Native, outside of US (%)
Place of birth - Native, outside of US (%) - White
Place of birth - Native, outside of US (%) - Black or African American
Place of birth - Native, outside of US (%) - Asian
Place of birth - Native, outside of US (%) - Hispanic or Latino
Place of birth - Native, outside of US (%) - American Indian and Alaska Native
Place of birth - Native, outside of US (%) - Multirace
Place of birth - Native, outside of US (%) - Other Race
Place of birth - Foreign born (%)
Place of birth - Foreign born (%) - White
Place of birth - Foreign born (%) - Black or African American
Place of birth - Foreign born (%) - Asian
Place of birth - Foreign born (%) - Hispanic or Latino
Place of birth - Foreign born (%) - American Indian and Alaska Native
Place of birth - Foreign born (%) - Multirace
Place of birth - Foreign born (%) - Other Race
Residents speaking English at home (%)
Residents speaking English at home - Born in the United States (%)
Residents speaking English at home - Native, born elsewhere (%)
Residents speaking English at home - Foreign born (%)
Residents speaking Spanish at home (%)
Residents speaking Spanish at home - Born in the United States (%)
Residents speaking Spanish at home - Native, born elsewhere (%)
Residents speaking Spanish at home - Foreign born (%)
Residents speaking other language at home (%)
Residents speaking other language at home - Born in the United States (%)
Residents speaking other language at home - Native, born elsewhere (%)
Residents speaking other language at home - Foreign born (%)
Marital status - Never married (%)
Marital status - Now married (%)
Marital status - Separated (%)
Marital status - Widowed (%)
Marital status - Divorced (%)
Ancestries Reported - Arab (%)
Ancestries Reported - Czech (%)
Ancestries Reported - Danish (%)
Ancestries Reported - Dutch (%)
Ancestries Reported - English (%)
Ancestries Reported - French (%)
Ancestries Reported - French Canadian (%)
Ancestries Reported - German (%)
Ancestries Reported - Greek (%)
Ancestries Reported - Hungarian (%)
Ancestries Reported - Irish (%)
Ancestries Reported - Italian (%)
Ancestries Reported - Lithuanian (%)
Ancestries Reported - Norwegian (%)
Ancestries Reported - Polish (%)
Ancestries Reported - Portuguese (%)
Ancestries Reported - Russian (%)
Ancestries Reported - Scotch-Irish (%)
Ancestries Reported - Scottish (%)
Ancestries Reported - Slovak (%)
Ancestries Reported - Subsaharan African (%)
Ancestries Reported - Swedish (%)
Ancestries Reported - Swiss (%)
Ancestries Reported - Ukrainian (%)
Ancestries Reported - United States (%)
Ancestries Reported - Welsh (%)
Ancestries Reported - West Indian (%)
Ancestries Reported - Other (%)
Geographical mobility - Same house 1 year ago (%)
Geographical mobility - Same house 1 year ago (%) - White
Geographical mobility - Same house 1 year ago (%) - Black or African American
Geographical mobility - Same house 1 year ago (%) - Asian
Geographical mobility - Same house 1 year ago (%) - Hispanic or Latino
Geographical mobility - Same house 1 year ago (%) - American Indian and Alaska Native
Geographical mobility - Same house 1 year ago (%) - Multirace
Geographical mobility - Same house 1 year ago (%) - Other Race
Geographical mobility - Moved within same county (%)
Geographical mobility - Moved within same county (%) - White
Geographical mobility - Moved within same county (%) - Black or African American
Geographical mobility - Moved within same county (%) - Asian
Geographical mobility - Moved within same county (%) - Hispanic or Latino
Geographical mobility - Moved within same county (%) - American Indian and Alaska Native
Geographical mobility - Moved within same county (%) - Multirace
Geographical mobility - Moved within same county (%) - Other Race
Geographical mobility - Moved from different county within same state (%)
Geographical mobility - Moved from different county within same state (%) - White
Geographical mobility - Moved from different county within same state (%) - Black or African American
Geographical mobility - Moved from different county within same state (%) - Asian
Geographical mobility - Moved from different county within same state (%) - Hispanic or Latino
Geographical mobility - Moved from different county within same state (%) - American Indian and Alaska Native
Geographical mobility - Moved from different county within same state (%) - Multirace
Geographical mobility - Moved from different county within same state (%) - Other Race
Geographical mobility - Moved from different state (%)
Geographical mobility - Moved from different state (%) - White
Geographical mobility - Moved from different state (%) - Black or African American
Geographical mobility - Moved from different state (%) - Asian
Geographical mobility - Moved from different state (%) - Hispanic or Latino
Geographical mobility - Moved from different state (%) - American Indian and Alaska Native
Geographical mobility - Moved from different state (%) - Multirace
Geographical mobility - Moved from different state (%) - Other Race
Geographical mobility - Moved from abroad (%)
Geographical mobility - Moved from abroad (%) - White
Geographical mobility - Moved from abroad (%) - Black or African American
Geographical mobility - Moved from abroad (%) - Asian
Geographical mobility - Moved from abroad (%) - Hispanic or Latino
Geographical mobility - Moved from abroad (%) - American Indian and Alaska Native
Geographical mobility - Moved from abroad (%) - Multirace
Geographical mobility - Moved from abroad (%) - Other Race
Place of birth for the foreign-born population - Ireland (%)
Place of birth for the foreign-born population - Denmark (%)
Place of birth for the foreign-born population - Norway (%)
Place of birth for the foreign-born population - Sweden (%)
Place of birth for the foreign-born population - United Kingdom (%)
Place of birth for the foreign-born population - England (%)
Place of birth for the foreign-born population - Scotland (%)
Place of birth for the foreign-born population - Other Northern Europe (%)
Place of birth for the foreign-born population - Austria (%)
Place of birth for the foreign-born population - Belgium (%)
Place of birth for the foreign-born population - France (%)
Place of birth for the foreign-born population - Germany (%)
Place of birth for the foreign-born population - Netherlands (%)
Place of birth for the foreign-born population - Switzerland (%)
Place of birth for the foreign-born population - Other Western Europe (%)
Place of birth for the foreign-born population - Greece (%)
Place of birth for the foreign-born population - Italy (%)
Place of birth for the foreign-born population - Portugal (%)
Place of birth for the foreign-born population - Spain (%)
Place of birth for the foreign-born population - Other Southern Europe (%)
Place of birth for the foreign-born population - Albania (%)
Place of birth for the foreign-born population - Belarus (%)
Place of birth for the foreign-born population - Bosnia and Herzegovina (%)
Place of birth for the foreign-born population - Bulgaria (%)
Place of birth for the foreign-born population - Croatia (%)
Place of birth for the foreign-born population - Czechoslovakia (%)
Place of birth for the foreign-born population - Hungary (%)
Place of birth for the foreign-born population - Latvia (%)
Place of birth for the foreign-born population - Lithuania (%)
Place of birth for the foreign-born population - North Macedonia (Macedonia) (%)
Place of birth for the foreign-born population - Moldova (%)
Place of birth for the foreign-born population - Poland (%)
Place of birth for the foreign-born population - Romania (%)
Place of birth for the foreign-born population - Russia (%)
Place of birth for the foreign-born population - Serbia (%)
Place of birth for the foreign-born population - Ukraine (%)
Place of birth for the foreign-born population - Other Eastern Europe (%)
Place of birth for the foreign-born population - China (%)
Place of birth for the foreign-born population - Hong Kong (%)
Place of birth for the foreign-born population - Taiwan (%)
Place of birth for the foreign-born population - Japan (%)
Place of birth for the foreign-born population - Korea (%)
Place of birth for the foreign-born population - Other Eastern Asia (%)
Place of birth for the foreign-born population - Afghanistan (%)
Place of birth for the foreign-born population - Bangladesh (%)
Place of birth for the foreign-born population - India (%)
Place of birth for the foreign-born population - Iran (%)
Place of birth for the foreign-born population - Kazakhstan (%)
Place of birth for the foreign-born population - Nepal (%)
Place of birth for the foreign-born population - Pakistan (%)
Place of birth for the foreign-born population - Sri Lanka (%)
Place of birth for the foreign-born population - Uzbekistan (%)
Place of birth for the foreign-born population - Other South Central Asia (%)
Place of birth for the foreign-born population - Burma (%)
Place of birth for the foreign-born population - Cambodia (%)
Place of birth for the foreign-born population - Indonesia (%)
Place of birth for the foreign-born population - Laos (%)
Place of birth for the foreign-born population - Malaysia (%)
Place of birth for the foreign-born population - Philippines (%)
Place of birth for the foreign-born population - Singapore (%)
Place of birth for the foreign-born population - Thailand (%)
Place of birth for the foreign-born population - Vietnam (%)
Place of birth for the foreign-born population - Other South Eastern Asia (%)
Place of birth for the foreign-born population - Armenia (%)
Place of birth for the foreign-born population - Iraq (%)
Place of birth for the foreign-born population - Israel (%)
Place of birth for the foreign-born population - Jordan (%)
Place of birth for the foreign-born population - Kuwait (%)
Place of birth for the foreign-born population - Lebanon (%)
Place of birth for the foreign-born population - Saudi Arabia (%)
Place of birth for the foreign-born population - Syria (%)
Place of birth for the foreign-born population - Turkey (%)
Place of birth for the foreign-born population - Yemen (%)
Place of birth for the foreign-born population - Other Western Asia (%)
Place of birth for the foreign-born population - Eritrea (%)
Place of birth for the foreign-born population - Ethiopia (%)
Place of birth for the foreign-born population - Kenya (%)
Place of birth for the foreign-born population - Somalia (%)
Place of birth for the foreign-born population - Uganda (%)
Place of birth for the foreign-born population - Zimbabwe (%)
Place of birth for the foreign-born population - Other Eastern Africa (%)
Place of birth for the foreign-born population - Cameroon (%)
Place of birth for the foreign-born population - Congo (%)
Place of birth for the foreign-born population - Democratic Republic of Congo (Zaire) (%)
Place of birth for the foreign-born population - Other Middle Africa (%)
Place of birth for the foreign-born population - Egypt (%)
Place of birth for the foreign-born population - Morocco (%)
Place of birth for the foreign-born population - Sudan (%)
Place of birth for the foreign-born population - Other Northern Africa (%)
Place of birth for the foreign-born population - South Africa (%)
Place of birth for the foreign-born population - Other Southern Africa (%)
Place of birth for the foreign-born population - Cabo Verde (%)
Place of birth for the foreign-born population - Ghana (%)
Place of birth for the foreign-born population - Liberia (%)
Place of birth for the foreign-born population - Nigeria (%)
Place of birth for the foreign-born population - Senegal (%)
Place of birth for the foreign-born population - Sierra Leone (%)
Place of birth for the foreign-born population - Other Western Africa (%)
Place of birth for the foreign-born population - Australia (%)
Place of birth for the foreign-born population - New Zealand (%)
Place of birth for the foreign-born population - Fiji (%)
Place of birth for the foreign-born population - Micronesia (%)
Place of birth for the foreign-born population - Bahamas (%)
Place of birth for the foreign-born population - Barbados (%)
Place of birth for the foreign-born population - Cuba (%)
Place of birth for the foreign-born population - Dominica (%)
Place of birth for the foreign-born population - Dominican Republic (%)
Place of birth for the foreign-born population - Grenada (%)
Place of birth for the foreign-born population - Haiti (%)
Place of birth for the foreign-born population - Jamaica (%)
Place of birth for the foreign-born population - St. Vincent and the Grenadines (%)
Place of birth for the foreign-born population - Trinidad and Tobago (%)
Place of birth for the foreign-born population - West Indies (%)
Place of birth for the foreign-born population - Other Caribbean (%)
Place of birth for the foreign-born population - Belize (%)
Place of birth for the foreign-born population - Costa Rica (%)
Place of birth for the foreign-born population - El Salvador (%)
Place of birth for the foreign-born population - Guatemala (%)
Place of birth for the foreign-born population - Honduras (%)
Place of birth for the foreign-born population - Mexico (%)
Place of birth for the foreign-born population - Nicaragua (%)
Place of birth for the foreign-born population - Panama (%)
Place of birth for the foreign-born population - Other Central America (%)
Place of birth for the foreign-born population - Argentina (%)
Place of birth for the foreign-born population - Bolivia (%)
Place of birth for the foreign-born population - Brazil (%)
Place of birth for the foreign-born population - Chile (%)
Place of birth for the foreign-born population - Colombia (%)
Place of birth for the foreign-born population - Ecuador (%)
Place of birth for the foreign-born population - Guyana (%)
Place of birth for the foreign-born population - Peru (%)
Place of birth for the foreign-born population - Uruguay (%)
Place of birth for the foreign-born population - Venezuela (%)
Place of birth for the foreign-born population - Other South America (%)
Place of birth for the foreign-born population - Canada (%)
Place of birth for the foreign-born population - Other Northern America (%)
Place of birth for the foreign-born population - Other (%)
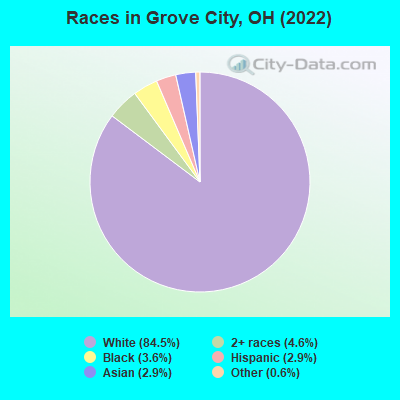
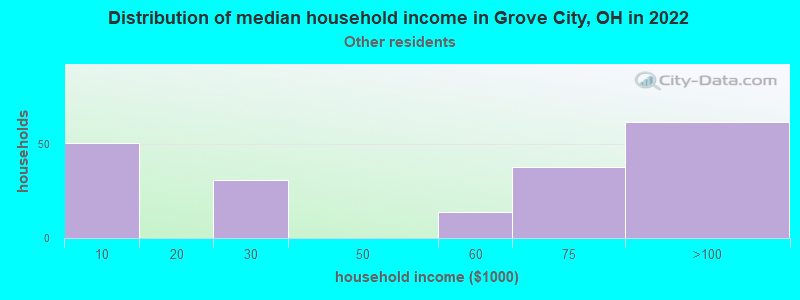
According to 2022 data, the most numerous races in Grove City, OH are White alone (35,092 residents), Black alone (1,484 residents), and Two or more races (1,916 residents). 92.2% of Grove City residents speak English at home. 3.6% of Grove City, OH residents are foreign-born (1.7% born in Asia, 0.8% born in Europe, 0.7% born in Latin America), which is 10.4% less than the foreign-born rate of 4.0% across the entire state of Ohio.
Race distribution in Grove City
2000 2022
9,538,111 84.0% White alone 1,290,662 11.4% Black alone 217,123 1.9% Hispanic 137,770 1.2% Two or more races 131,670 1.2% Asian alone 21,985 0.2% American Indian alone 13,483 0.1% Other race alone 2,336 0.02% Native Hawaiian and Other
8,948,793 76.1% White alone 1,401,403 11.9% Black alone 529,291 4.5% Two or more races 517,232 4.4% Hispanic 293,387 2.5% Asian alone 52,805 0.4% Other race alone 9,785 0.08% American Indian alone 3,362 0.03% Native Hawaiian and Other
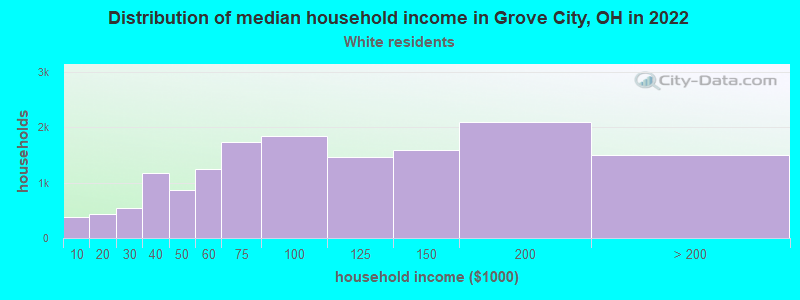
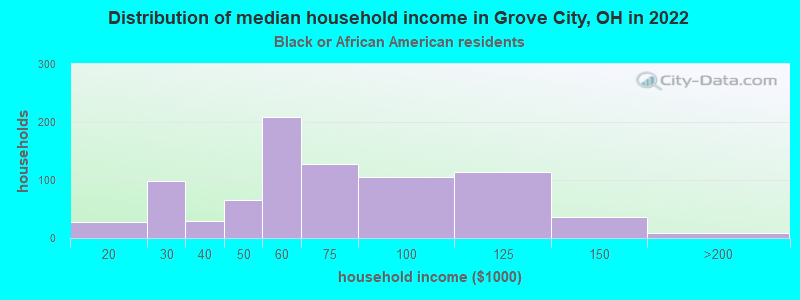
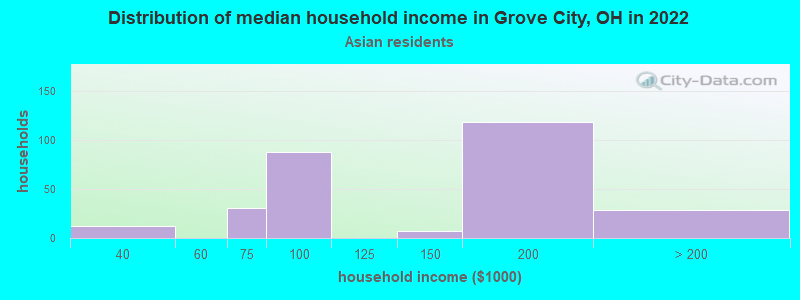
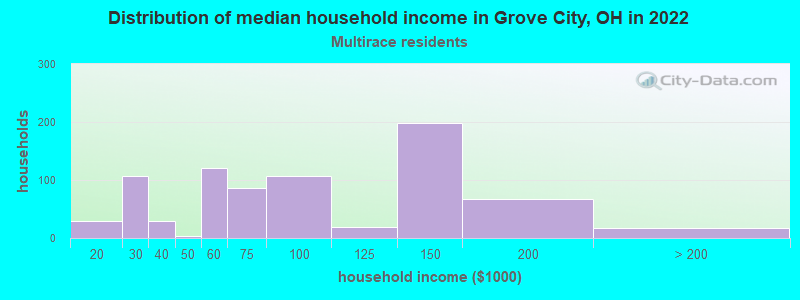
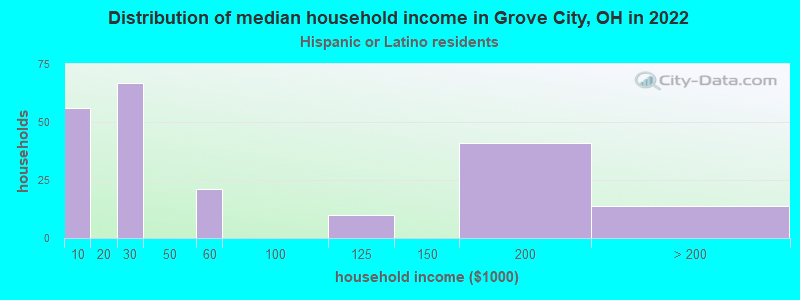
Income and house value in Grove City Median household income in 2022 $86,491 White non-Hispanic householders$60,799 Black householders$142,294 Asian householders$74,687 Some other race householders$87,664 Two or more races householdersMedian 2022 house value $303,014 White Non-Hispanic householders$427,399 Black or African American householders$214,456 American Indian or Alaska Native householders $389,806 Asian householders$189,226 Some other race householders$343,887 Two or more races householders$287,372 Hispanic or Latino householders
Median age by race in Grove City
43.3 Median age for White residents40.9 44.9 37.0 Median age for Black or African American residents32.8 51.7 -691,029,899.6 Median age for American Indian / Alaska Native residents-670,953,911.4 -732,121,211.4 36.1 Median age for Asian residents34.0 41.2 -497,206,703.4 Median age for Native Hawaiian / Pacific Islander residents-544,891,640.3 -805,394,989.6 29.0 Median age for Other race residents27.9 26.2 25.0 Median age for Two or more races residents18.0 32.3 43.1 Median age for White alone residents40.7 45.0 22.2 Median age for Hispanic or Latino residents23.5 18.8
Owner/renter occupied households by race in Grove City
House owners and renters - White residents 10,881 73.5% Owner occupied3,928 26.5% Renter occupiedHouse owners and renters - Black or African American residents 176 21.5% Owner occupied645 78.5% Renter occupiedHouse owners and renters - Asian residents 197 63.5% Owner occupied113 36.5% Renter occupiedHouse owners and renters - Other race residents 143 61.1% Owner occupied91 38.9% Renter occupiedHouse owners and renters - Two or more races residents 468 66.9% Owner occupied231 33.1% Renter occupiedHouse owners and renters - White alone residents 10,927 73.3% Owner occupied3,978 26.7% Renter occupiedHouse owners and renters - Hispanic or Latino residents 68 36.8% Owner occupied117 63.2% Renter occupied
Language usage in Grove City
English speakers - Total 92.2% of residents of Grove City speak English at home.
1.9% of residents speak Spanish at home 512 68.4% Speak English very well236 31.6% Speak English less than very well5.1% of residents speak other language at home 1,123 57.3% Speak English very well837 42.7% Speak English less than very well
English speakers - Born in the United States 96.7% of residents of Grove City speak English at home.
1.5% of residents speak Spanish at home 97 100.0% Speak English very well1.7% of residents speak other language at home 79 71.8% Speak English very well31 28.2% Speak English less than very well
English speakers - Native, born elsewhere 92.0% of residents of Grove City speak English at home.
8.0% of residents speak Spanish at home 13 100.0% Speak English very well
English speakers - Foreign-born 12.7% of residents of Grove City speak English at home.
16.0% of residents speak Spanish at home 96 39.0% Speak English very well150 61.0% Speak English less than very well71.1% of residents speak other language at home 403 36.9% Speak English very well689 63.1% Speak English less than very well
White (Caucasian) - Speak only English Native:
97.9% (31,502)Foreign-born:
20.1% (70)
White (Caucasian) - Speak another language Native:
2.1% (676)Foreign-born:
79.7% (279)
Black or African American - Speak only English Native:
94.3% (1,344)Foreign-born:
6.1% (5)
Black or African American - Speak another language Native:
5.4% (77)Foreign-born:
94.8% (76)
Asian - Speak only English Native:
48.3% (186)Foreign-born:
10.8% (76)
Asian - Speak another language Native:
48.8% (187)Foreign-born:
89.5% (632)
Other race - Speak another language Native:
30.6% (179)Foreign-born:
100.0% (135)
Two or more races - Speak only English Native:
95.1% (1,947)Foreign-born:
18.9% (43)
Two or more races - Speak another language Native:
5.5% (114)Foreign-born:
81.2% (183)
White alone - Speak only English Native:
97.8% (31,569)Foreign-born:
19.7% (72)
White alone - Speak another language Native:
2.2% (702)Foreign-born:
81.4% (298)
Hispanic or Latino - Speak only English Native:
55.7% (451)Foreign-born:
13.2% (40)
Hispanic or Latino - Speak another language Native:
42.7% (346)Foreign-born:
87.9% (266)
Foreign-born residents in Grove City 1,505 residents are foreign born (1.7% Asia , 0.8% Europe , 0.7% Latin America ).
Marital status for residents in Grove City Marital status - White (Caucasian) population 15 years and over
Males 25.3% Never married59.0% Now married0.9% Separated2.9% Widowed11.9% DivorcedFemales 21.8% Never married57.6% Now married1.3% Separated8.4% Widowed10.9% DivorcedWomen who gave birth in the past 12 months Now married:
78.8% (261)Unmarried:
21.2% (70)
Women who did not give birth in the past 12 months Now married:
54.8% (3,759)Unmarried:
45.2% (3,100)
Marital status - Black or African American population 15 years and over
Males 59.2% Never married24.3% Now married0.0% Separated0.0% Widowed16.5% DivorcedFemales 37.6% Never married11.1% Now married0.0% Separated11.9% Widowed39.4% DivorcedWomen who did not give birth in the past 12 months Now married:
5.5% (10)Unmarried:
94.5% (164)
Marital status - Asian population 15 years and over
Males 24.0% Never married76.0% Now married0.0% Separated0.0% Widowed0.0% DivorcedFemales 7.6% Never married90.0% Now married2.2% Separated0.0% Widowed0.2% DivorcedWomen who gave birth in the past 12 months Now married:
100.0% (23)Unmarried:
0.0% (0)
Women who did not give birth in the past 12 months Now married:
90.3% (387)Unmarried:
9.7% (41)
Marital status - Other race population 15 years and over
Males 65.8% Never married34.2% Now married0.0% Separated0.0% Widowed0.0% DivorcedFemales 34.3% Never married32.3% Now married0.0% Separated0.0% Widowed33.3% DivorcedWomen who gave birth in the past 12 months Now married:
0.0% (0)Unmarried:
100.0% (22)
Women who did not give birth in the past 12 months Now married:
27.1% (23)Unmarried:
72.9% (61)
Marital status - Two or more races population 15 years and over
Males 30.6% Never married61.6% Now married0.0% Separated2.2% Widowed5.6% DivorcedFemales 35.2% Never married40.4% Now married1.0% Separated7.4% Widowed16.0% DivorcedWomen who gave birth in the past 12 months Now married:
100.0% (16)Unmarried:
0.0% (0)
Women who did not give birth in the past 12 months Now married:
35.9% (173)Unmarried:
64.1% (310)
Marital status - White alone, not Hispanic / Latino population 15 years and over
Males 25.3% Never married59.0% Now married0.9% Separated2.9% Widowed11.9% DivorcedFemales 21.8% Never married57.6% Now married1.4% Separated8.5% Widowed10.8% DivorcedWomen who gave birth in the past 12 months Now married:
78.8% (265)Unmarried:
21.2% (71)
Women who did not give birth in the past 12 months Now married:
54.8% (3,786)Unmarried:
45.2% (3,128)
Marital status - Hispanic or Latino population 15 years and over
Males 56.9% Never married38.1% Now married0.0% Separated0.0% Widowed5.0% DivorcedFemales 25.7% Never married60.0% Now married0.0% Separated0.0% Widowed14.3% DivorcedWomen who gave birth in the past 12 months Now married:
37.9% (12)Unmarried:
62.1% (20)
Women who did not give birth in the past 12 months Now married:
46.2% (68)Unmarried:
53.8% (79)
Ancestries in Grove City
4,779 23.6% German3,203 15.8% American2,232 11.0% English1,698 8.4% Irish792 3.9% Italian481 2.4% European287 1.4% Welsh275 1.4% Scotch-Irish269 1.3% Polish236 1.2% Scottish158 0.8% Danish139 0.7% Ukrainian109 0.5% French88 0.4% British66 0.3% Croatian62 0.3% Hungarian61 0.3% Ghanaian59 0.3% Brazilian53 0.3% Russian51 0.3% Eastern European48 0.2% French Canadian26 0.1% Belgian23 0.1% Romanian23 0.1% African20 0.10% Serbian17 0.08% Austrian15 0.07% Northern European15 0.07% Swiss13 0.06% Czechoslovakian12 0.06% Canadian12 0.06% Slovak6 0.03% Dutch6 0.03% Pennsylvania German3 0.01% Swedish
Children Nativity (place of birth) in Grove City
Children under 6 years - Living with two parents Both parents native 2,408 100.0% NativeBoth parents foreign-born 35 100.0% NativeOne native, one foreign-born parent 181 100.0% NativeChildren under 6 years - Living with one parent Native parent 748 100.0% NativeForeign-born parent 59 100.0% NativeChildren 6 to 17 years - Living with two parents Both parents native 3,554 100.0% NativeBoth parents foreign-born 595 100.0% NativeOne native, one foreign-born parent 134 100.0% NativeChildren 6 to 17 years - Living with one parent Native parent 1,542 100.0% NativeForeign-born parent 133 50.6% Native130 49.4% Foreign-born
Grandparents responsible for own grandchildren in Grove City
Grandparents (30 to 59 years) White / Caucasian 9 16.6% Responsible for grandchildren47 83.4% Not responsible for grandchildrenAsian 11 100.0% Not responsible for grandchildrenWhite alone, not Hispanic / Latino 9 16.3% Responsible for grandchildren49 83.7% Not responsible for grandchildrenGrandparents (60 years and over) White / Caucasian 48 40.7% Responsible for grandchildren69 59.3% Not responsible for grandchildrenWhite alone, not Hispanic / Latino 48 40.3% Responsible for grandchildren72 59.7% Not responsible for grandchildren