Races in Grier City-Park Crest, Pennsylvania (PA) Detailed Stats
Ancestries, Foreign-born residents, place of birth

Discuss Grier City-Park Crest, Pennsylvania races on our local forum with over 2,400,000 registered users
1.0% of Grier City-Park Crest, PA residents are foreign-born , which is 567.8% less than the foreign-born rate of 7.0% across the entire state of Pennsylvania.
Race distribution in Grier City-Park Crest

- 94999.5%White alone
- 30.3%Hispanic
- 20.2%Two or more races
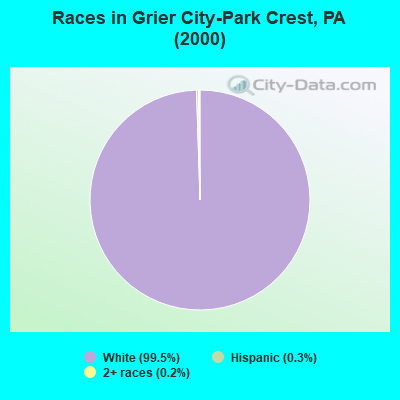
2000
2022
-
- 10,322,45584.1%White alone
- 1,202,4379.8%Black alone
- 394,0883.2%Hispanic
- 218,2961.8%Asian alone
- 113,0970.9%Two or more races
- 13,0860.1%Other race alone
- 14,9040.1%American Indian alone
- 2,6910.02%Native Hawaiian and Other
Pacific Islander alone

-
- 9,487,22873.1%White alone
- 1,311,58110.1%Black alone
- 1,115,9978.6%Hispanic
- 493,9423.8%Two or more races
- 487,1243.8%Asian alone
- 63,5820.5%Other race alone
- 10,1300.08%American Indian alone
- 2,4240.02%Native Hawaiian and Other
Pacific Islander alone

Income and house value in Grier City-Park Crest
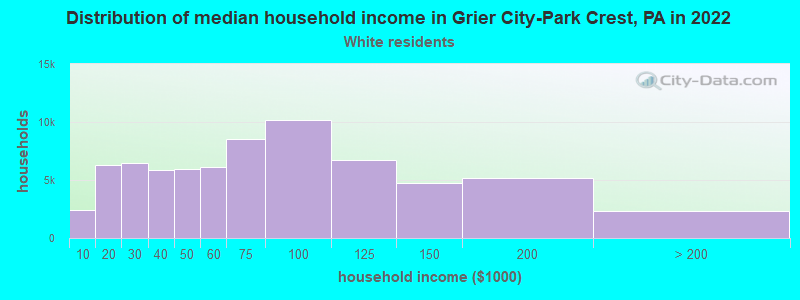
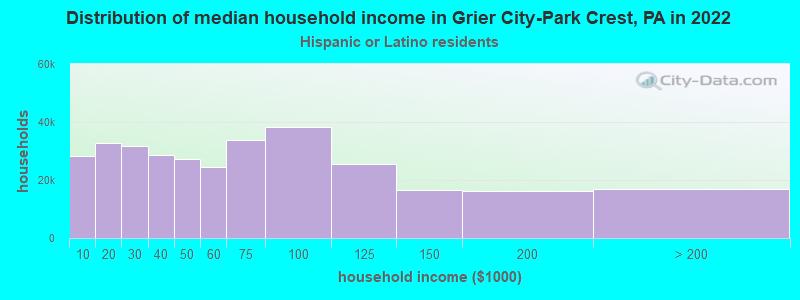
- Median household income in 2022
- $81,460White non-Hispanic householders
- $100,960Hispanic or Latino race householders
- Median 2022 house value
- $185,828White Non-Hispanic householders
- $188,489Hispanic or Latino householders
Household income for White non-Hispanic householders
Household income for Hispanic or Latino race householders
Foreign-born residents in Grier City-Park Crest
10 residents are foreign born
| This city: | 1.0% |
| Pennsylvania: | 4.1% |
Ancestries in Grier City-Park Crest

- 27320.8%German
- 21516.4%Irish
- 13910.6%Polish
- 13210.1%Lithuanian
- 1148.7%Dutch
- 785.9%English
- 785.9%Italian
- 534.0%Other
- 513.9%Russian
- 473.6%Slovak
- 302.3%French
- 231.8%Welsh
- 221.7%United States
- 211.6%Swedish
- 191.4%Ukrainian
- 100.8%Greek
- 50.4%Portuguese
- 20.2%Norwegian

Zip codes: 18214.