Races in Gresham, Oregon (OR) Detailed Stats
Data:
Races - White alone (%)
Races - White alone (% change since 2000)
Races - Black alone (%)
Races - Black alone (% change since 2000)
Races - American Indian alone (%)
Races - American Indian alone (% change since 2000)
Races - Asian alone (%)
Races - Asian alone (% change since 2000)
Races - Hispanic (%)
Races - Hispanic (% change since 2000)
Races - Native Hawaiian and Other Pacific Islander alone (%)
Races - Native Hawaiian and Other Pacific Islander alone (% change since 2000)
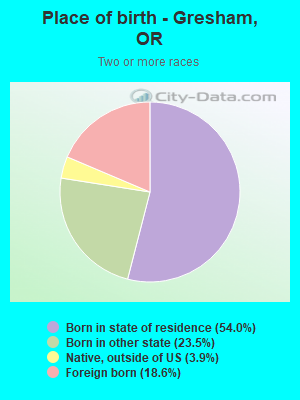
Races - Two or more races(%)
Races - Two or more races(% change since 2000)
Races - Other race alone (%)
Races - Other race alone (% change since 2000)
Racial diversity
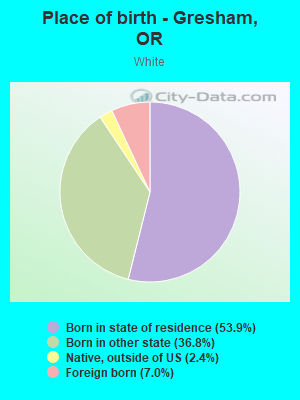
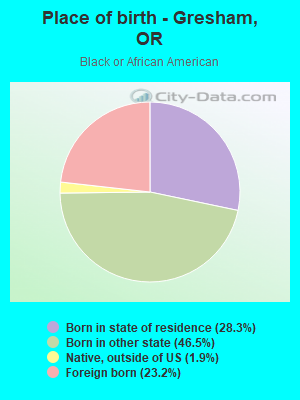
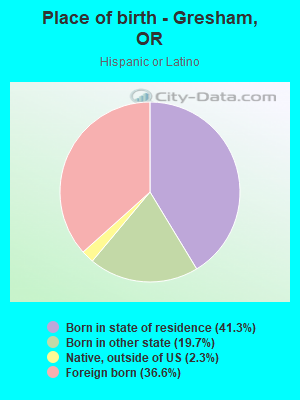
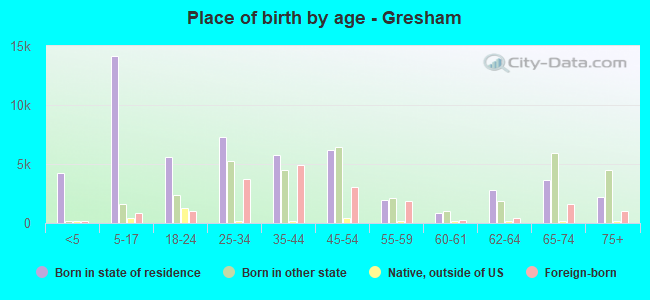
Place of birth - Born in state of residence (%)
Place of birth - Born in state of residence (%) - White
Place of birth - Born in state of residence (%) - Black or African American
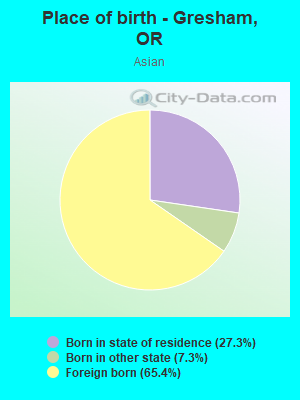
Place of birth - Born in state of residence (%) - Asian
Place of birth - Born in state of residence (%) - Hispanic or Latino
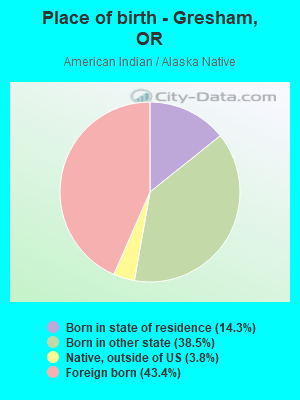
Place of birth - Born in state of residence (%) - American Indian and Alaska Native
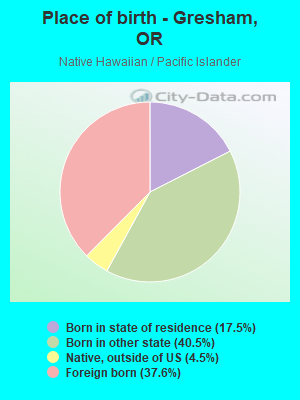
Place of birth - Born in state of residence (%) - Multirace
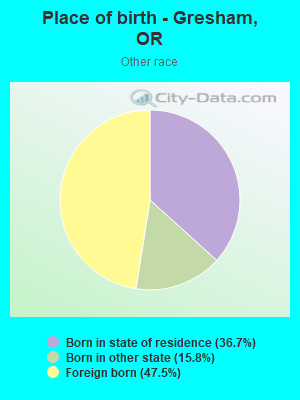
Place of birth - Born in state of residence (%) - Other Race
Place of birth - Born in other state (%)
Place of birth - Born in other state (%) - White
Place of birth - Born in other state (%) - Black or African American
Place of birth - Born in other state (%) - Asian
Place of birth - Born in other state (%) - Hispanic or Latino
Place of birth - Born in other state (%) - American Indian and Alaska Native
Place of birth - Born in other state (%) - Multirace
Place of birth - Born in other state (%) - Other Race
Place of birth - Native, outside of US (%)
Place of birth - Native, outside of US (%) - White
Place of birth - Native, outside of US (%) - Black or African American
Place of birth - Native, outside of US (%) - Asian
Place of birth - Native, outside of US (%) - Hispanic or Latino
Place of birth - Native, outside of US (%) - American Indian and Alaska Native
Place of birth - Native, outside of US (%) - Multirace
Place of birth - Native, outside of US (%) - Other Race
Place of birth - Foreign born (%)
Place of birth - Foreign born (%) - White
Place of birth - Foreign born (%) - Black or African American
Place of birth - Foreign born (%) - Asian
Place of birth - Foreign born (%) - Hispanic or Latino
Place of birth - Foreign born (%) - American Indian and Alaska Native
Place of birth - Foreign born (%) - Multirace
Place of birth - Foreign born (%) - Other Race
Residents speaking English at home (%)
Residents speaking English at home - Born in the United States (%)
Residents speaking English at home - Native, born elsewhere (%)
Residents speaking English at home - Foreign born (%)
Residents speaking Spanish at home (%)
Residents speaking Spanish at home - Born in the United States (%)
Residents speaking Spanish at home - Native, born elsewhere (%)
Residents speaking Spanish at home - Foreign born (%)
Residents speaking other language at home (%)
Residents speaking other language at home - Born in the United States (%)
Residents speaking other language at home - Native, born elsewhere (%)
Residents speaking other language at home - Foreign born (%)
Marital status - Never married (%)
Marital status - Now married (%)
Marital status - Separated (%)
Marital status - Widowed (%)
Marital status - Divorced (%)
Ancestries Reported - Arab (%)
Ancestries Reported - Czech (%)
Ancestries Reported - Danish (%)
Ancestries Reported - Dutch (%)
Ancestries Reported - English (%)
Ancestries Reported - French (%)
Ancestries Reported - French Canadian (%)
Ancestries Reported - German (%)
Ancestries Reported - Greek (%)
Ancestries Reported - Hungarian (%)
Ancestries Reported - Irish (%)
Ancestries Reported - Italian (%)
Ancestries Reported - Lithuanian (%)
Ancestries Reported - Norwegian (%)
Ancestries Reported - Polish (%)
Ancestries Reported - Portuguese (%)
Ancestries Reported - Russian (%)
Ancestries Reported - Scotch-Irish (%)
Ancestries Reported - Scottish (%)
Ancestries Reported - Slovak (%)
Ancestries Reported - Subsaharan African (%)
Ancestries Reported - Swedish (%)
Ancestries Reported - Swiss (%)
Ancestries Reported - Ukrainian (%)
Ancestries Reported - United States (%)
Ancestries Reported - Welsh (%)
Ancestries Reported - West Indian (%)
Ancestries Reported - Other (%)
Geographical mobility - Same house 1 year ago (%)
Geographical mobility - Same house 1 year ago (%) - White
Geographical mobility - Same house 1 year ago (%) - Black or African American
Geographical mobility - Same house 1 year ago (%) - Asian
Geographical mobility - Same house 1 year ago (%) - Hispanic or Latino
Geographical mobility - Same house 1 year ago (%) - American Indian and Alaska Native
Geographical mobility - Same house 1 year ago (%) - Multirace
Geographical mobility - Same house 1 year ago (%) - Other Race
Geographical mobility - Moved within same county (%)
Geographical mobility - Moved within same county (%) - White
Geographical mobility - Moved within same county (%) - Black or African American
Geographical mobility - Moved within same county (%) - Asian
Geographical mobility - Moved within same county (%) - Hispanic or Latino
Geographical mobility - Moved within same county (%) - American Indian and Alaska Native
Geographical mobility - Moved within same county (%) - Multirace
Geographical mobility - Moved within same county (%) - Other Race
Geographical mobility - Moved from different county within same state (%)
Geographical mobility - Moved from different county within same state (%) - White
Geographical mobility - Moved from different county within same state (%) - Black or African American
Geographical mobility - Moved from different county within same state (%) - Asian
Geographical mobility - Moved from different county within same state (%) - Hispanic or Latino
Geographical mobility - Moved from different county within same state (%) - American Indian and Alaska Native
Geographical mobility - Moved from different county within same state (%) - Multirace
Geographical mobility - Moved from different county within same state (%) - Other Race
Geographical mobility - Moved from different state (%)
Geographical mobility - Moved from different state (%) - White
Geographical mobility - Moved from different state (%) - Black or African American
Geographical mobility - Moved from different state (%) - Asian
Geographical mobility - Moved from different state (%) - Hispanic or Latino
Geographical mobility - Moved from different state (%) - American Indian and Alaska Native
Geographical mobility - Moved from different state (%) - Multirace
Geographical mobility - Moved from different state (%) - Other Race
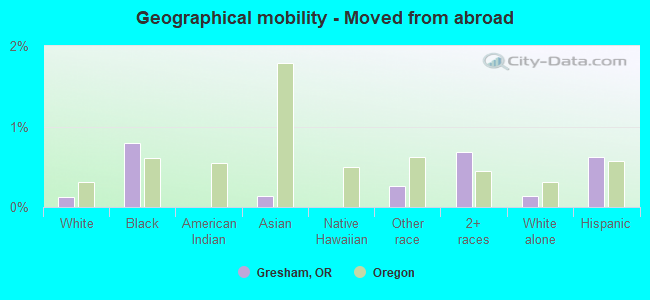
Geographical mobility - Moved from abroad (%)
Geographical mobility - Moved from abroad (%) - White
Geographical mobility - Moved from abroad (%) - Black or African American
Geographical mobility - Moved from abroad (%) - Asian
Geographical mobility - Moved from abroad (%) - Hispanic or Latino
Geographical mobility - Moved from abroad (%) - American Indian and Alaska Native
Geographical mobility - Moved from abroad (%) - Multirace
Geographical mobility - Moved from abroad (%) - Other Race
Place of birth for the foreign-born population - Ireland (%)
Place of birth for the foreign-born population - Denmark (%)
Place of birth for the foreign-born population - Norway (%)
Place of birth for the foreign-born population - Sweden (%)
Place of birth for the foreign-born population - United Kingdom (%)
Place of birth for the foreign-born population - England (%)
Place of birth for the foreign-born population - Scotland (%)
Place of birth for the foreign-born population - Other Northern Europe (%)
Place of birth for the foreign-born population - Austria (%)
Place of birth for the foreign-born population - Belgium (%)
Place of birth for the foreign-born population - France (%)
Place of birth for the foreign-born population - Germany (%)
Place of birth for the foreign-born population - Netherlands (%)
Place of birth for the foreign-born population - Switzerland (%)
Place of birth for the foreign-born population - Other Western Europe (%)
Place of birth for the foreign-born population - Greece (%)
Place of birth for the foreign-born population - Italy (%)
Place of birth for the foreign-born population - Portugal (%)
Place of birth for the foreign-born population - Spain (%)
Place of birth for the foreign-born population - Other Southern Europe (%)
Place of birth for the foreign-born population - Albania (%)
Place of birth for the foreign-born population - Belarus (%)
Place of birth for the foreign-born population - Bosnia and Herzegovina (%)
Place of birth for the foreign-born population - Bulgaria (%)
Place of birth for the foreign-born population - Croatia (%)
Place of birth for the foreign-born population - Czechoslovakia (%)
Place of birth for the foreign-born population - Hungary (%)
Place of birth for the foreign-born population - Latvia (%)
Place of birth for the foreign-born population - Lithuania (%)
Place of birth for the foreign-born population - North Macedonia (Macedonia) (%)
Place of birth for the foreign-born population - Moldova (%)
Place of birth for the foreign-born population - Poland (%)
Place of birth for the foreign-born population - Romania (%)
Place of birth for the foreign-born population - Russia (%)
Place of birth for the foreign-born population - Serbia (%)
Place of birth for the foreign-born population - Ukraine (%)
Place of birth for the foreign-born population - Other Eastern Europe (%)
Place of birth for the foreign-born population - China (%)
Place of birth for the foreign-born population - Hong Kong (%)
Place of birth for the foreign-born population - Taiwan (%)
Place of birth for the foreign-born population - Japan (%)
Place of birth for the foreign-born population - Korea (%)
Place of birth for the foreign-born population - Other Eastern Asia (%)
Place of birth for the foreign-born population - Afghanistan (%)
Place of birth for the foreign-born population - Bangladesh (%)
Place of birth for the foreign-born population - India (%)
Place of birth for the foreign-born population - Iran (%)
Place of birth for the foreign-born population - Kazakhstan (%)
Place of birth for the foreign-born population - Nepal (%)
Place of birth for the foreign-born population - Pakistan (%)
Place of birth for the foreign-born population - Sri Lanka (%)
Place of birth for the foreign-born population - Uzbekistan (%)
Place of birth for the foreign-born population - Other South Central Asia (%)
Place of birth for the foreign-born population - Burma (%)
Place of birth for the foreign-born population - Cambodia (%)
Place of birth for the foreign-born population - Indonesia (%)
Place of birth for the foreign-born population - Laos (%)
Place of birth for the foreign-born population - Malaysia (%)
Place of birth for the foreign-born population - Philippines (%)
Place of birth for the foreign-born population - Singapore (%)
Place of birth for the foreign-born population - Thailand (%)
Place of birth for the foreign-born population - Vietnam (%)
Place of birth for the foreign-born population - Other South Eastern Asia (%)
Place of birth for the foreign-born population - Armenia (%)
Place of birth for the foreign-born population - Iraq (%)
Place of birth for the foreign-born population - Israel (%)
Place of birth for the foreign-born population - Jordan (%)
Place of birth for the foreign-born population - Kuwait (%)
Place of birth for the foreign-born population - Lebanon (%)
Place of birth for the foreign-born population - Saudi Arabia (%)
Place of birth for the foreign-born population - Syria (%)
Place of birth for the foreign-born population - Turkey (%)
Place of birth for the foreign-born population - Yemen (%)
Place of birth for the foreign-born population - Other Western Asia (%)
Place of birth for the foreign-born population - Eritrea (%)
Place of birth for the foreign-born population - Ethiopia (%)
Place of birth for the foreign-born population - Kenya (%)
Place of birth for the foreign-born population - Somalia (%)
Place of birth for the foreign-born population - Uganda (%)
Place of birth for the foreign-born population - Zimbabwe (%)
Place of birth for the foreign-born population - Other Eastern Africa (%)
Place of birth for the foreign-born population - Cameroon (%)
Place of birth for the foreign-born population - Congo (%)
Place of birth for the foreign-born population - Democratic Republic of Congo (Zaire) (%)
Place of birth for the foreign-born population - Other Middle Africa (%)
Place of birth for the foreign-born population - Egypt (%)
Place of birth for the foreign-born population - Morocco (%)
Place of birth for the foreign-born population - Sudan (%)
Place of birth for the foreign-born population - Other Northern Africa (%)
Place of birth for the foreign-born population - South Africa (%)
Place of birth for the foreign-born population - Other Southern Africa (%)
Place of birth for the foreign-born population - Cabo Verde (%)
Place of birth for the foreign-born population - Ghana (%)
Place of birth for the foreign-born population - Liberia (%)
Place of birth for the foreign-born population - Nigeria (%)
Place of birth for the foreign-born population - Senegal (%)
Place of birth for the foreign-born population - Sierra Leone (%)
Place of birth for the foreign-born population - Other Western Africa (%)
Place of birth for the foreign-born population - Australia (%)
Place of birth for the foreign-born population - New Zealand (%)
Place of birth for the foreign-born population - Fiji (%)
Place of birth for the foreign-born population - Micronesia (%)
Place of birth for the foreign-born population - Bahamas (%)
Place of birth for the foreign-born population - Barbados (%)
Place of birth for the foreign-born population - Cuba (%)
Place of birth for the foreign-born population - Dominica (%)
Place of birth for the foreign-born population - Dominican Republic (%)
Place of birth for the foreign-born population - Grenada (%)
Place of birth for the foreign-born population - Haiti (%)
Place of birth for the foreign-born population - Jamaica (%)
Place of birth for the foreign-born population - St. Vincent and the Grenadines (%)
Place of birth for the foreign-born population - Trinidad and Tobago (%)
Place of birth for the foreign-born population - West Indies (%)
Place of birth for the foreign-born population - Other Caribbean (%)
Place of birth for the foreign-born population - Belize (%)
Place of birth for the foreign-born population - Costa Rica (%)
Place of birth for the foreign-born population - El Salvador (%)
Place of birth for the foreign-born population - Guatemala (%)
Place of birth for the foreign-born population - Honduras (%)
Place of birth for the foreign-born population - Mexico (%)
Place of birth for the foreign-born population - Nicaragua (%)
Place of birth for the foreign-born population - Panama (%)
Place of birth for the foreign-born population - Other Central America (%)
Place of birth for the foreign-born population - Argentina (%)
Place of birth for the foreign-born population - Bolivia (%)
Place of birth for the foreign-born population - Brazil (%)
Place of birth for the foreign-born population - Chile (%)
Place of birth for the foreign-born population - Colombia (%)
Place of birth for the foreign-born population - Ecuador (%)
Place of birth for the foreign-born population - Guyana (%)
Place of birth for the foreign-born population - Peru (%)
Place of birth for the foreign-born population - Uruguay (%)
Place of birth for the foreign-born population - Venezuela (%)
Place of birth for the foreign-born population - Other South America (%)
Place of birth for the foreign-born population - Canada (%)
Place of birth for the foreign-born population - Other Northern America (%)
Place of birth for the foreign-born population - Other (%)
Latest news about races in Gresham, OR collected exclusively by city-data.com from local newspapers, TV, and radio stations
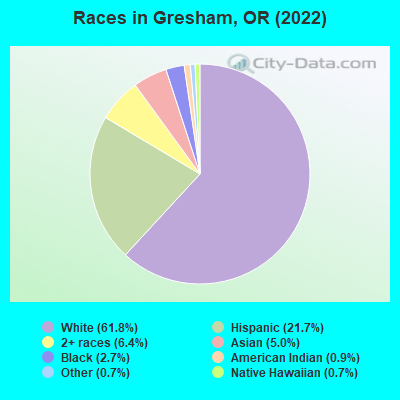
According to 2022 data, the most numerous races in Gresham, OR are White alone (69,040 residents), Hispanic (24,174 residents), and Two or more races (7,147 residents). 73.6% of Gresham residents speak English at home. 17.3% of Gresham, OR residents are foreign-born (7.9% born in Latin America, 4.1% born in Asia, 2.7% born in Europe), which is 47.8% greater than the foreign-born rate of 9.0% across the entire state of Oregon.
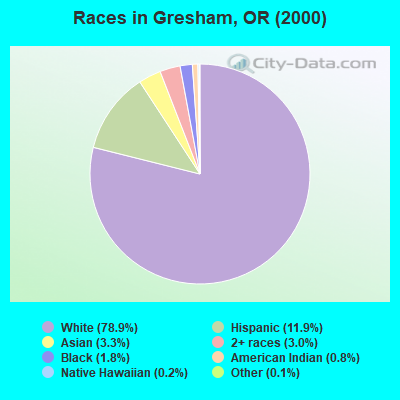
Race distribution in Gresham
2000 2022
71,194 78.9% White alone 10,732 11.9% Hispanic 2,969 3.3% Asian alone 2,672 3.0% Two or more races 1,618 1.8% Black alone 704 0.8% American Indian alone 217 0.2% Native Hawaiian and Other 99 0.1% Other race alone
69,040 61.8% White alone 24,174 21.7% Hispanic 7,147 6.4% Two or more races 5,588 5.0% Asian alone 3,037 2.7% Black alone 1,044 0.9% American Indian alone 824 0.7% Other race alone 780 0.7% Native Hawaiian and Other
2000 2022
2,857,616 83.5% White alone 275,314 8.0% Hispanic 100,333 2.9% Asian alone 82,733 2.4% Two or more races 53,325 1.6% Black alone 40,130 1.2% American Indian alone 7,398 0.2% Native Hawaiian and Other 4,550 0.1% Other race alone
3,037,571 71.6% White alone 609,538 14.4% Hispanic 252,744 6.0% Two or more races 191,283 4.5% Asian alone 78,228 1.8% Black alone 29,399 0.7% American Indian alone 25,731 0.6% Other race alone 15,643 0.4% Native Hawaiian and Other
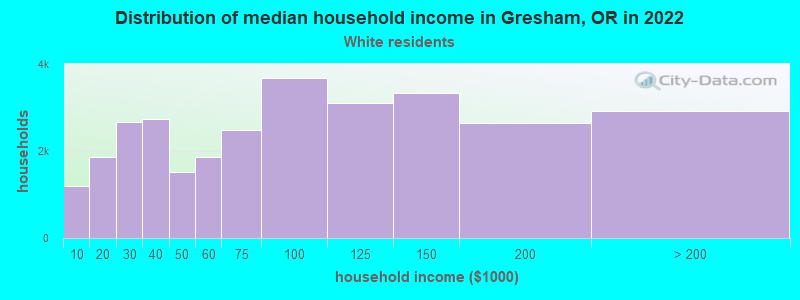
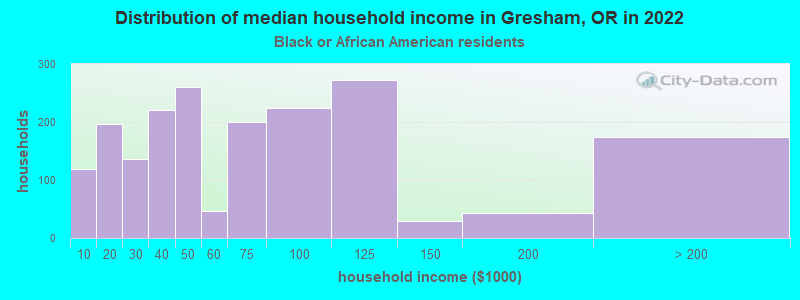
Income and house value in Gresham Median household income in 2022 $80,576 White non-Hispanic householders$45,323 Black householders$108,360 American Indian and Alaska Native householders$73,015 Asian householders$65,090 Some other race householders$57,256 Two or more races householders$67,065 Hispanic or Latino race householdersMedian 2022 house value $457,164 White Non-Hispanic householders$521,001 Black or African American householders$423,957 American Indian or Alaska Native householders $476,344 Asian householders$541,326 Native Hawaiian and other Pacific Islander householders$399,625 Some other race householders$427,679 Two or more races householders$412,793 Hispanic or Latino householders
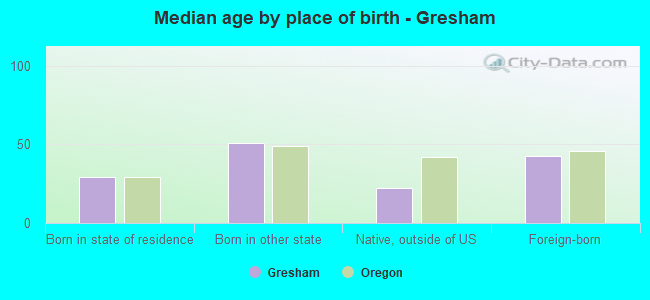
Median age by race in Gresham
44.4 Median age for White residents45.0 43.5 32.8 Median age for Black or African American residents32.7 54.4 41.0 Median age for American Indian / Alaska Native residents41.5 40.5 44.5 Median age for Asian residents40.4 49.0 24.5 Median age for Native Hawaiian / Pacific Islander residents24.6 23.7 34.8 Median age for Other race residents33.2 37.4 26.1 Median age for Two or more races residents21.3 30.1 45.4 Median age for White alone residents46.0 44.7 27.5 Median age for Hispanic or Latino residents25.8 30.0
Owner/renter occupied households by race in Gresham
House owners and renters - White residents 18,677 62.2% Owner occupied11,350 37.8% Renter occupiedHouse owners and renters - Black or African American residents 634 37.3% Owner occupied1,068 62.7% Renter occupiedHouse owners and renters - American Indian / Alaska Native residents 478 46.1% Owner occupied559 53.9% Renter occupiedHouse owners and renters - Asian residents 1,201 60.5% Owner occupied784 39.5% Renter occupiedHouse owners and renters - Native Hawaiian / Pacific Islander residents 83 18.7% Owner occupied358 81.3% Renter occupiedHouse owners and renters - Other race residents 1,459 43.1% Owner occupied1,926 56.9% Renter occupiedHouse owners and renters - Two or more races residents 2,022 32.5% Owner occupied4,194 67.5% Renter occupiedHouse owners and renters - White alone residents 18,638 63.1% Owner occupied10,919 36.9% Renter occupiedHouse owners and renters - Hispanic or Latino residents 2,243 30.5% Owner occupied5,105 69.5% Renter occupied
Language usage in Gresham
English speakers - Total 73.6% of residents of Gresham speak English at home.
15.2% of residents speak Spanish at home 7,603 46.6% Speak English very well8,728 53.4% Speak English less than very well11.2% of residents speak other language at home 6,327 52.8% Speak English very well5,658 47.2% Speak English less than very well
English speakers - Born in the United States 90.1% of residents of Gresham speak English at home.
7.5% of residents speak Spanish at home 2,055 77.3% Speak English very well603 22.7% Speak English less than very well2.4% of residents speak other language at home 679 79.9% Speak English very well171 20.1% Speak English less than very well
English speakers - Native, born elsewhere 87.7% of residents of Gresham speak English at home.
11.1% of residents speak Spanish at home 284 100.0% Speak English very well1.2% of residents speak other language at home 31 100.0% Speak English very well
English speakers - Foreign-born 11.4% of residents of Gresham speak English at home.
45.3% of residents speak Spanish at home 1,797 21.4% Speak English very well6,618 78.6% Speak English less than very well43.3% of residents speak other language at home 3,063 38.1% Speak English very well4,983 61.9% Speak English less than very well
White (Caucasian) - Speak only English Native:
95.3% (60,971)Foreign-born:
11.0% (534)
White (Caucasian) - Speak another language Native:
4.7% (3,030)Foreign-born:
89.0% (4,322)
Black or African American - Speak only English Native:
93.1% (2,863)Foreign-born:
20.8% (168)
Black or African American - Speak another language Native:
5.1% (158)Foreign-born:
78.1% (629)
American Indian / Alaska Native - Speak only English Native:
93.7% (1,092)Foreign-born:
5.4% (43)
American Indian / Alaska Native - Speak another language Native:
7.8% (91)Foreign-born:
97.1% (768)
Asian - Speak only English Native:
47.0% (851)Foreign-born:
17.3% (631)
Asian - Speak another language Native:
53.0% (961)Foreign-born:
82.7% (3,021)
Native Hawaiian / Pacific Islander - Speak another language Native:
36.5% (225)Foreign-born:
86.1% (371)
Other race - Speak only English Native:
40.0% (1,966)Foreign-born:
12.7% (578)
Other race - Speak another language Native:
60.0% (2,951)Foreign-born:
87.3% (3,972)
Two or more races - Speak only English Native:
65.7% (8,306)Foreign-born:
0.2% (8)
Two or more races - Speak another language Native:
34.3% (4,341)Foreign-born:
99.8% (3,291)
White alone - Speak only English Native:
96.0% (59,604)Foreign-born:
11.6% (534)
White alone - Speak another language Native:
4.0% (2,466)Foreign-born:
88.4% (4,082)
Hispanic or Latino - Speak only English Native:
44.3% (6,018)Foreign-born:
8.0% (706)
Hispanic or Latino - Speak another language Native:
55.7% (7,562)Foreign-born:
92.0% (8,148)
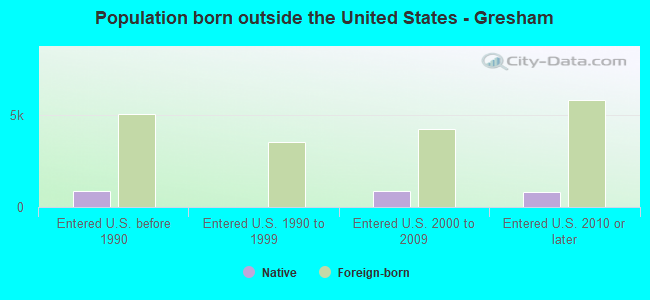
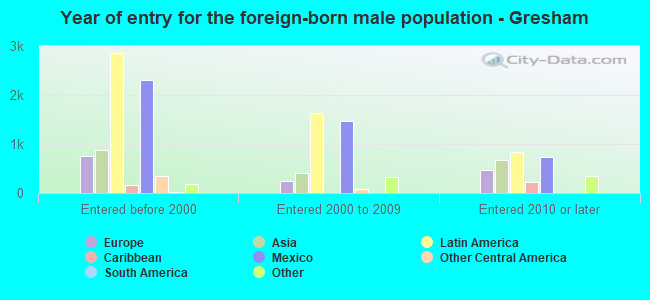
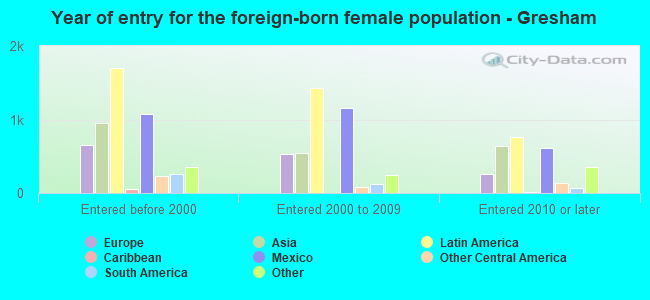
Foreign-born residents in Gresham 19,269 residents are foreign born (7.9% Latin America , 4.1% Asia , 2.7% Europe ).
This city:
17.3%Oregon:
9.8%
Marital status for residents in Gresham Marital status - White (Caucasian) population 15 years and over
Males 34.2% Never married47.9% Now married1.1% Separated4.4% Widowed12.3% DivorcedFemales 32.5% Never married44.3% Now married1.7% Separated10.0% Widowed11.6% DivorcedWomen who gave birth in the past 12 months Now married:
75.3% (463)Unmarried:
24.7% (152)
Women who did not give birth in the past 12 months Now married:
38.8% (6,787)Unmarried:
61.2% (10,710)
Marital status - Black or African American population 15 years and over
Males 37.8% Never married45.5% Now married3.8% Separated0.0% Widowed13.0% DivorcedFemales 37.8% Never married28.9% Now married0.5% Separated7.8% Widowed25.1% DivorcedWomen who gave birth in the past 12 months Now married:
100.0% (15)Unmarried:
0.0% (0)
Women who did not give birth in the past 12 months Now married:
28.8% (209)Unmarried:
71.2% (517)
Marital status - American Indian / Alaska Native population 15 years and over
Males 51.4% Never married30.7% Now married0.0% Separated2.0% Widowed15.8% DivorcedFemales 48.7% Never married22.3% Now married0.0% Separated9.8% Widowed19.2% DivorcedWomen who gave birth in the past 12 months Now married:
0.0% (0)Unmarried:
100.0% (2)
Women who did not give birth in the past 12 months Now married:
24.4% (97)Unmarried:
75.6% (302)
Marital status - Asian population 15 years and over
Males 19.1% Never married55.7% Now married0.0% Separated1.9% Widowed23.3% DivorcedFemales 13.7% Never married52.9% Now married0.0% Separated10.3% Widowed23.0% DivorcedWomen who gave birth in the past 12 months Now married:
100.0% (47)Unmarried:
0.0% (0)
Women who did not give birth in the past 12 months Now married:
52.4% (692)Unmarried:
47.6% (629)
Marital status - Native Hawaiian / Pacific Islander population 15 years and over
Males 24.2% Never married64.9% Now married0.0% Separated0.0% Widowed10.9% DivorcedFemales 47.3% Never married40.8% Now married0.0% Separated1.8% Widowed10.0% DivorcedWomen who gave birth in the past 12 months Now married:
0.0% (0)Unmarried:
100.0% (41)
Women who did not give birth in the past 12 months Now married:
37.1% (107)Unmarried:
62.9% (182)
Marital status - Other race population 15 years and over
Males 49.3% Never married40.2% Now married4.3% Separated0.2% Widowed5.9% DivorcedFemales 39.9% Never married52.6% Now married0.1% Separated2.6% Widowed4.7% DivorcedWomen who gave birth in the past 12 months Now married:
16.0% (18)Unmarried:
84.0% (96)
Women who did not give birth in the past 12 months Now married:
47.1% (821)Unmarried:
52.9% (923)
Marital status - Two or more races population 15 years and over
Males 54.8% Never married42.2% Now married0.0% Separated0.0% Widowed3.0% DivorcedFemales 48.6% Never married31.8% Now married0.0% Separated3.6% Widowed16.0% DivorcedWomen who gave birth in the past 12 months Now married:
100.0% (363)Unmarried:
0.0% (0)
Women who did not give birth in the past 12 months Now married:
34.4% (1,222)Unmarried:
65.6% (2,331)
Marital status - White alone, not Hispanic / Latino population 15 years and over
Males 32.5% Never married49.0% Now married1.2% Separated4.6% Widowed12.8% DivorcedFemales 31.7% Never married44.4% Now married1.7% Separated10.2% Widowed11.9% DivorcedWomen who gave birth in the past 12 months Now married:
75.3% (463)Unmarried:
24.7% (152)
Women who did not give birth in the past 12 months Now married:
39.0% (6,528)Unmarried:
61.0% (10,228)
Marital status - Hispanic or Latino population 15 years and over
Males 51.5% Never married35.7% Now married1.2% Separated0.0% Widowed11.5% DivorcedFemales 47.7% Never married36.5% Now married0.0% Separated3.3% Widowed12.5% DivorcedWomen who gave birth in the past 12 months Now married:
59.6% (296)Unmarried:
40.4% (201)
Women who did not give birth in the past 12 months Now married:
44.0% (2,553)Unmarried:
56.0% (3,250)
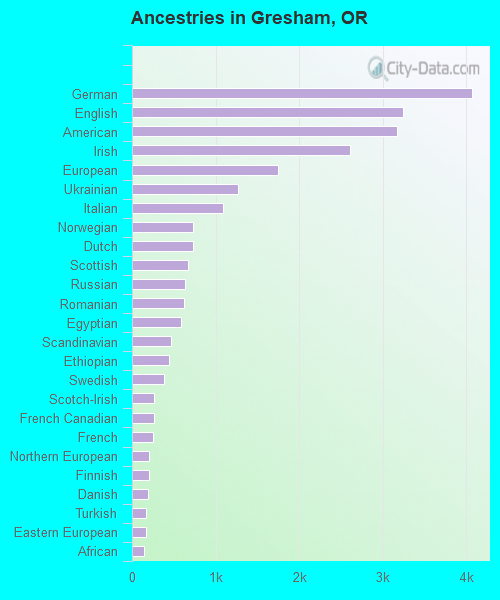
Ancestries in Gresham
4,069 6.7% German3,244 5.3% English3,173 5.2% American2,609 4.3% Irish1,753 2.9% European1,266 2.1% Ukrainian1,087 1.8% Italian727 1.2% Norwegian727 1.2% Dutch674 1.1% Scottish629 1.0% Russian626 1.0% Romanian591 1.0% Egyptian469 0.8% Scandinavian443 0.7% Ethiopian381 0.6% Swedish266 0.4% Scotch-Irish259 0.4% French Canadian252 0.4% French205 0.3% Northern European198 0.3% Finnish192 0.3% Danish166 0.3% Turkish162 0.3% Eastern European142 0.2% African138 0.2% Welsh122 0.2% Hungarian118 0.2% Celtic116 0.2% Slavic96 0.2% British89 0.1% Polish69 0.1% Portuguese60 0.10% Somali52 0.09% Moroccan51 0.08% Czech46 0.08% Kenyan45 0.07% Greek44 0.07% Estonian44 0.07% Belgian44 0.07% Jamaican41 0.07% Yugoslavian40 0.07% Czechoslovakian37 0.06% South African35 0.06% Arab35 0.06% Trinidadian and Tobagonian32 0.05% Lebanese27 0.04% Icelander27 0.04% Swiss23 0.04% Canadian21 0.03% Cape Verdean18 0.03% Ghanaian18 0.03% Bulgarian15 0.02% West Indian14 0.02% Australian13 0.02% Latvian7 0.01% Afghan7 0.01% Brazilian4 0.01% Luxembourger
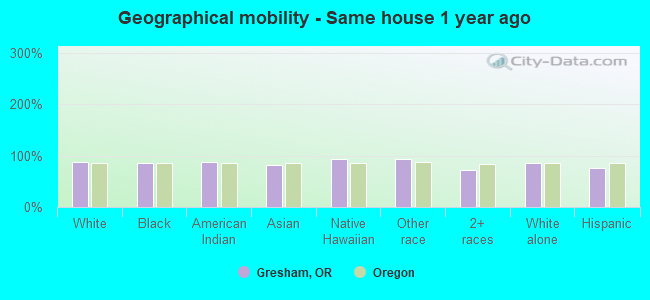
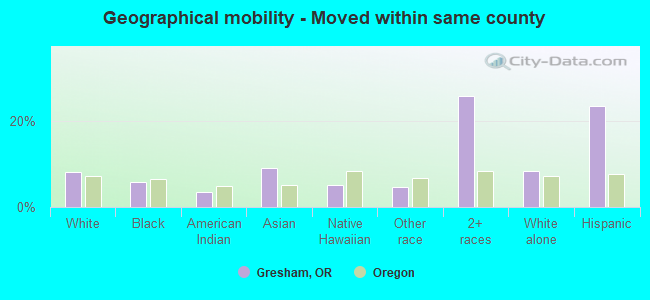
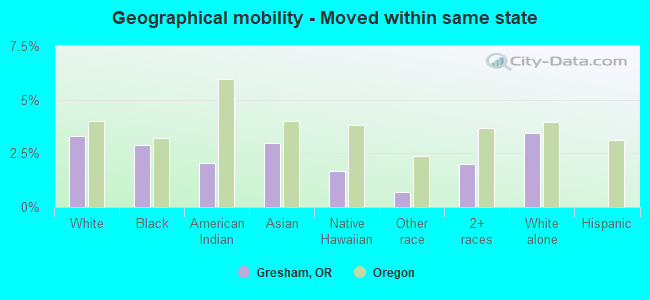
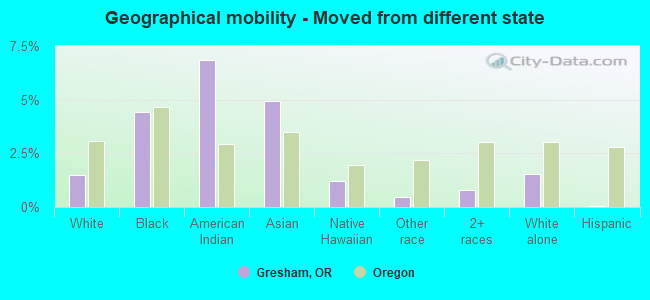
Geographical mobility in Gresham Same house 1 year ago 61,290 86.9% White (Caucasian)3,534 86.5% Black or African American1,425 87.7% American Indian / Alaska Native4,744 81.7% Asian1,196 93.9% Native Hawaiian / Pacific Islander5,878 93.4% Other race12,828 71.3% Two or more races59,119 86.5% White alone, not Hispanic / Latino18,265 75.8% Hispanic or LatinoMoved within same county 5,784 8.2% White / Caucasian236 5.8% Black or African American58 3.6% American Indian / Alaska Native527 9.1% Asian65 5.1% Native Hawaiian / Pacific Islander296 4.7% Other race4,647 25.8% Two or more races5,784 8.5% White alone, not Hispanic / Latino5,667 23.5% Hispanic or LatinoMoved within same state 2,345 3.3% White / Caucasian118 2.9% Black or African American33 2.0% American Indian / Alaska Native174 3.0% Asian21 1.7% Native Hawaiian / Pacific Islander45 0.7% Other race362 2.0% Two or more races2,345 3.4% White alone, not Hispanic / LatinoMoved from different state 1,042 1.5% White / Caucasian180 4.4% Black or African American111 6.8% American Indian / Alaska Native287 4.9% Asian15 1.2% Native Hawaiian / Pacific Islander29 0.5% Other race140 0.8% Two or more races1,042 1.5% White alone, not Hispanic / Latino10 0.0% Hispanic or LatinoMoved from abroad 92 0.1% White32 0.8% Black or African American8 0.1% Asian17 0.3% Other race122 0.7% Two or more races92 0.1% White alone, not Hispanic / Latino150 0.6% Hispanic or Latino
Children Nativity (place of birth) in Gresham
Children under 6 years - Living with two parents Both parents native 2,441 100.0% NativeBoth parents foreign-born 1,302 92.9% Native100 7.1% Foreign-bornOne native, one foreign-born parent 687 100.0% NativeChildren under 6 years - Living with one parent Native parent 996 100.0% NativeForeign-born parent 677 100.0% NativeChildren 6 to 17 years - Living with two parents Both parents native 5,657 97.7% Native132 2.3% Foreign-bornBoth parents foreign-born 3,176 100.0% NativeOne native, one foreign-born parent 343 100.0% NativeChildren 6 to 17 years - Living with one parent Native parent 2,777 100.0% NativeForeign-born parent 2,024 60.3% Native1,334 39.7% Foreign-born
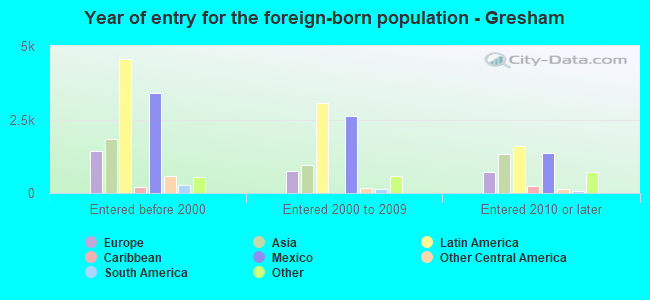
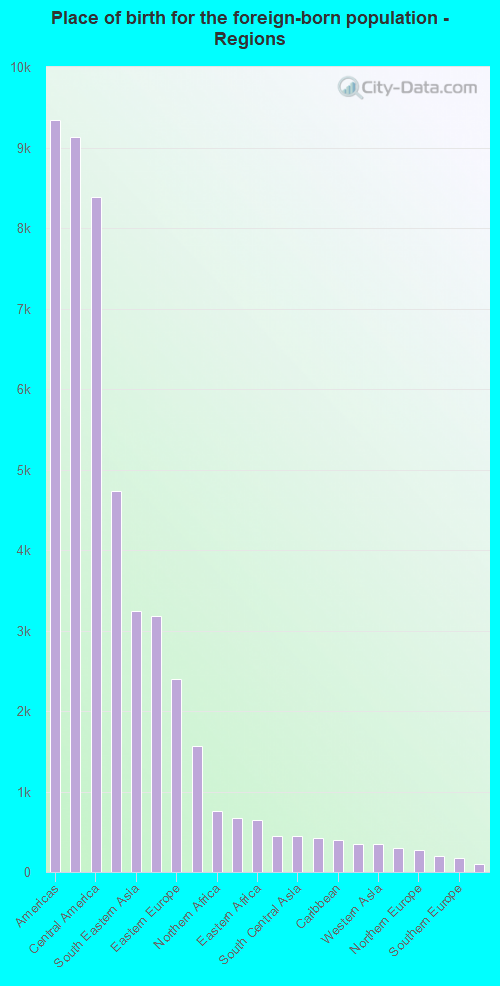
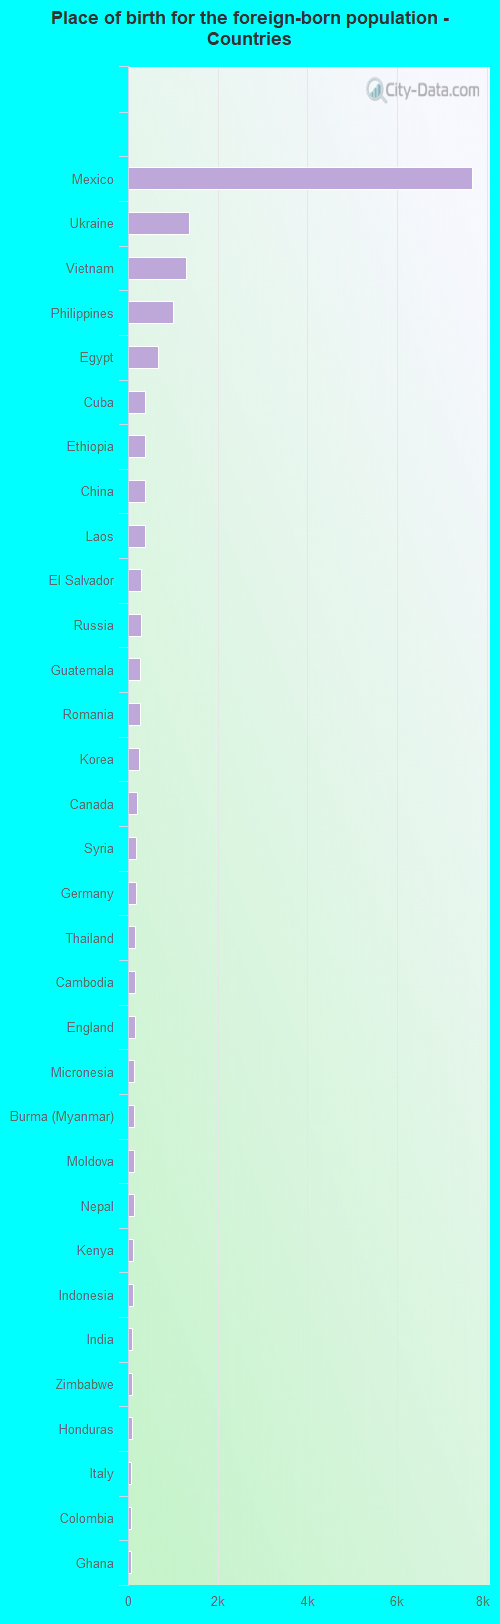
Place of birth for residents in Gresham 9,336 Americas9,136 Latin America8,384 Central America4,739 Asia3,244 South Eastern Asia3,176 Europe2,398 Eastern Europe1,570 Africa762 Northern Africa674 Eastern Asia645 Eastern Africa446 Oceania442 South Central Asia426 China399 Caribbean351 South America349 Western Asia299 Western Europe269 Northern Europe199 Northern America168 Southern Europe97 Western Africa23 Australia and New Zealand Subregion5 Southern Africa7,669 Mexico1,367 Ukraine1,299 Vietnam1,014 Philippines679 Egypt387 Cuba382 Ethiopia380 China379 Laos300 El Salvador298 Russia261 Guatemala260 Romania248 Korea199 Canada184 Syria172 Germany167 Thailand148 Cambodia146 England142 Micronesia132 Burma (Myanmar)129 Moldova127 Nepal104 Kenya102 Indonesia100 India82 Zimbabwe80 Honduras76 Italy74 Colombia72 Ghana69 Brazil69 Chile68 Turkey67 Portugal67 Peru64 France60 Bolivia59 Bosnia and Herzegovina56 Netherlands54 Scotland53 Kazakhstan42 United Arab Emirates42 Morocco41 Somalia38 Nicaragua36 Hong Kong35 United Kingdom33 Eritrea33 Costa Rica30 Georgia29 Afghanistan29 Hungary29 Czechoslovakia26 Bhutan25 Liberia24 Spain23 New Zealand23 Poland22 Uzbekistan21 Marshall Islands20 Croatia19 Sweden19 Pakistan17 Fiji13 Ireland13 Jordan11 Sudan11 Guyana10 Trinidad and Tobago9 Taiwan9 Lebanon7 Austria5 Bulgaria5 South Africa1 Yemen
Grandparents responsible for own grandchildren in Gresham
Grandparents (30 to 59 years) White / Caucasian 245 44.9% Responsible for grandchildren302 55.1% Not responsible for grandchildrenBlack or African American 12 100.0% Not responsible for grandchildrenAsian 59 100.0% Not responsible for grandchildrenNative Hawaiian / Pacific Islander 45 100.0% Responsible for grandchildrenOther race 9 4.0% Responsible for grandchildren207 96.0% Not responsible for grandchildrenTwo or more races 138 100.0% Not responsible for grandchildrenWhite alone, not Hispanic / Latino 223 42.0% Responsible for grandchildren307 58.0% Not responsible for grandchildrenHispanic or Latino 40 14.9% Responsible for grandchildren227 85.1% Not responsible for grandchildrenGrandparents (60 years and over) White / Caucasian 53 3.9% Responsible for grandchildren1,313 96.1% Not responsible for grandchildrenBlack or African American 26 40.9% Responsible for grandchildren37 59.1% Not responsible for grandchildrenAsian 70 100.0% Not responsible for grandchildrenNative Hawaiian / Pacific Islander 33 100.0% Responsible for grandchildrenOther race 9 6.5% Responsible for grandchildren127 93.5% Not responsible for grandchildrenTwo or more races 2 2.4% Responsible for grandchildren91 97.6% Not responsible for grandchildrenWhite alone, not Hispanic / Latino 55 4.3% Responsible for grandchildren1,210 95.7% Not responsible for grandchildrenHispanic or Latino 6 2.3% Responsible for grandchildren251 97.7% Not responsible for grandchildren